LOCA IFA-650.10
Overview
The LOCA experiments performed in the Halden Research Reactor are integral in-pile single rod tests on fuel behavior under simulated LOCA conditions. The tenth LOCA test, i.e., IFA-650.10 (Lavoil, 2010), was carried out using a segment of a PWR rod that had been irradiated in a commercial PWR (Gravelines 5, 900 MWe, EDF, France) up to a burn-up of 61 MWd/kgU. During the test a low fission power (25 W/cm) was used to achieve the desired conditions for high cladding temperatures, ballooning and oxidation. A heater surrounding the rod and operating at 12 W/cm was used for simulating the heat from adjacent rods. The average cladding temperature increase rate during the heat-up was around 8 K/s. Cladding failure occurred 249 seconds after blowdown at a cladding temperature of 1025 K.
The Halden IFA-650.10 test was selected for comparative fuel performance modelling in the IAEA IAEA FUMAC Project on Fuel Modelling under Accident Conditions (Zhang and Veshchunov, 2016).
Test Description
Fuel rod characteristics and experimental setup
The fabrication characteristics of the IFA-650.10 fuel rod are reported in Table 1. The test rod was a segment from the commercially irradiated PWR mother rod. The fuel and cladding materials are UO and Zircaloy-4, respectively, with typical PWR design specifications. The refabricated rod was filled with a gas mixture of 95 % argon and 5 % helium at 4 MPa. Argon was chosen to simulate the (low-conductivity) fission gases. The rod plenum volume (free gas volume) was made relatively large in order to maintain stable pressure conditions until cladding burst occurred. The total free gas volume (17 cm) was thus practically all located in the plenum, outside the heated region.
Table 1: Design data of IFA-650.10 fuel rod (Lavoil, 2010) (Lavoil, 2010)
| Fuel material | UO | |
| Fuel density | 95.32 | %TD |
| U enrichment | 4.487 | wt% |
| Active fuel length | 440 | mm |
| Pellet OD | 8.21 | mm |
| Pellet ID | 0 | mm |
| Pellet length | 10 | mm |
| Cladding material | Zy-4 | |
| Cladding ID | 8.36 | mm |
| Cladding OD | 9.50 | mm |
| Diametral gap | 150 | m |
| Free volume | 17 | cm |
| Fill gas | Ar (95%), He (5%) | |
| Fill gas pressure | 4.0 | MPa |
| Coolant temperature | 508 | K |
| Coolant pressure | 7 | MPa |
For consistency with the fuel-cladding diametral gap width (Lavoil, 2010) (Lavoil, 2010).
The fuel rod was located in a standard high-pressure flask in the IFA-650 test rig, which was connected to a high-pressure heavy water loop and a blowdown system. A schematic of the test rig with its instrumentation is shown in Figure 1 and a cross-sectional view of the rig is shown in Figure 2.

Figure 1: Schematic of the IFA-650.10 test rig with instrument elevations. Figure from (Lavoil, 2010)
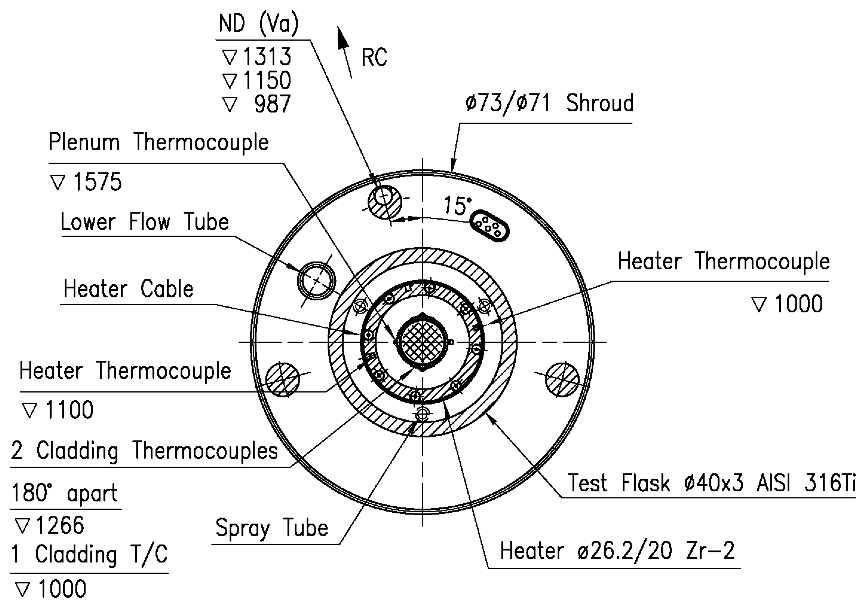
Figure 2: Cross sectional geometry of the IFA-650.10 test rig. Figure from (Lavoil, 2010)
The rod was located in the center of the rig and surrounded by an electrical heater inside the flask. The heater is part of a flow separator, which divides the space into a central channel surrounding the fuel rod and an outer annulus. The heater is used for simulating heat from the adjacent fuel rods in a power reactor core. Cladding temperature is influenced by both rod and heater powers. The flask was surrounded by a shroud and was placed inside the Halden reactor. The annulus between the shroud and the flask is filled with moderator (heavy water) at a pressure of 34 bar and a temperature of 235 C. One cladding surface thermocouple, TCC1, was located 9.5 cm above the fuel stack bottom, and the other two, TCC2 and TCC3, were attached 8 cm below the top of the stack. In IFA-650.10 the temperature of the heater was measured by two embedded thermocouples, i.e., TCH1 at the same elevation as TCC1, and TCH2 at 2.6 cm below the fuel mid plane. A third thermocouple was placed on the outside surface at the axial midplane of the plenum. The axial power distribution was measured by three self-powered vanadium neutron detectors (ND) at three different elevations. The rig instrumentation also included a fuel pressure sensor (PF) and thermocouples at the inlet (TI) and outlet (TO) of the rig to measure the coolant temperatures.
Operation procedure and conditions
The experimental procedure for the IFA-650.10 test is detailed below (Lavoil, 2010). Note that we refer here to the LOCA test performed in the Halden reactor on the pre-irradiated, refabricated PWR fuel rod. In the BISON simulation, we also considered the commercial base irradiation preceding the test, as described in Model Description and Development of time-dependent boundary conditions
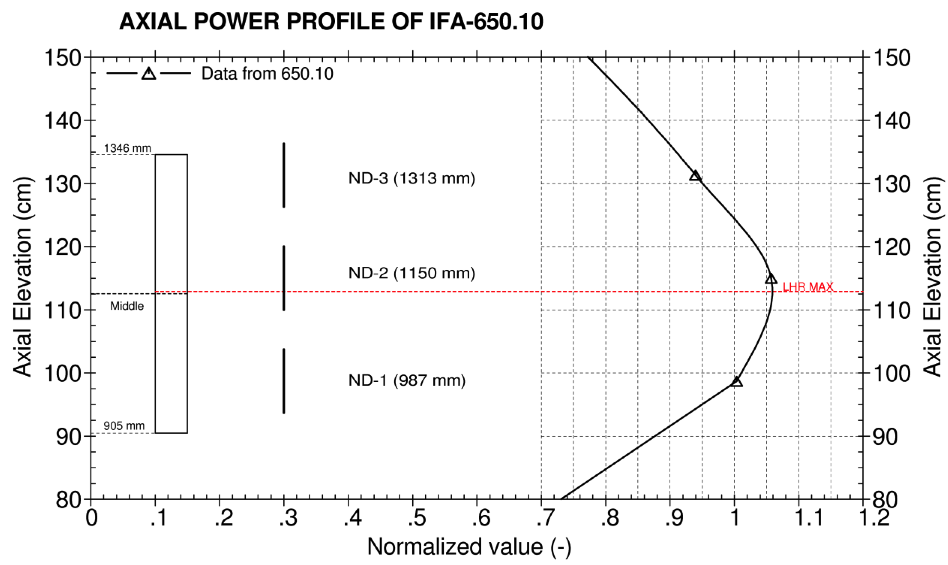
Figure 3: Axial power profile at the start of the test of IFA-650.10. Figure from (Lavoil, 2010)
The general test scheme of IFA-650.10 consisted of the following phases:
Preparatory phases. The test started with a preparatory irradiation with effective water cooling. This consisted of a forced circulation phase followed by a natural circulation phase. At the start of the test, the axial power distribution was symmetric with a peak to average power factor of 1.05 (Figure 3). The forced circulation phase started with steady state operation at a linear heat generation rate (LHGR) of 120-130 W/cm, with the outer loop connected and the pressure in the loop set to 70 bar. Then the LHGR was decreased to 25 W/cm by decreasing the reactor power. After reaching the correct fuel power level the electrical heater was turned on to the preset value 12 W/cm. The power levels were chosen based on the previous test runs and pre-calculations to achieve the target peak cladding temperature (PCT) of 850 C during the heat-up phase of the test. Then the flow regime was switched to natural circulation by disconnecting the rig from the outer loop. The flow separator enabled natural convection flow in the test section of the rig: water flowed up between the fuel rod and flow separator (with heater) and down between flow separator and flask wall. Full pressure still existed in the rig. Temperatures in the rig were left to stabilize for three minutes before blowdown.
Blowdown phase. Valves to the dump tank were opened (blowdown). The channel pressure decreased rapidly to 4 bar as water flew out of the pressure flask. The rig was practically emptied of water in 71 s, which corresponds to the end of the blowdown phase (beginning of the dry phase). The end of the blowdown phase is identified by the sudden increase in cladding and heater surface temperature. Also the temperature difference between the cladding and heater increases rapidly at end of the blowdown phase.
Dry or heat-up phase. Stagnant superheated steam surrounding the test rod provided inadequate cooling and the fuel cladding temperature increased quickly. Much of the heat removal from the test rod is by radiation to the surrounding heater. Small amounts of water are periodically sprayed into the rig to maintain a sufficient amount of steam for cladding oxidation during this phase. The influence of spraying on measured cladding, heater and coolant temperatures is reported to be weak, but no quantitative information on this issue is provided. Ballooning and burst occurred during the heat-up phase and were detected from pressure and temperature signals (burst at 1025 K, 249 s after blowdown). The test was ended by a reactor scram 418 s after the blowdown.
Test results
The test was carried out successfully in May 2010. The test facility with its instruments worked well and cladding ballooning and burst occurred.
After the blowdown was completed (beginning of the dry or heat-up phase), an increase in the internal pressure and cladding temperatures was observed. At the beginning of the heat-up phase, and starting from a temperature of 460 K, the average cladding temperature increase rate was 5 K/s for TCC1 and 4.3 K/s for TCC2 and TCC3. This rate slowly decreased until the burst, when it was approximately 1 K/s for all the thermocouples. The evolution of cladding, heater and coolant temperature signals during the phases of the experiment are reported in Figure 4.
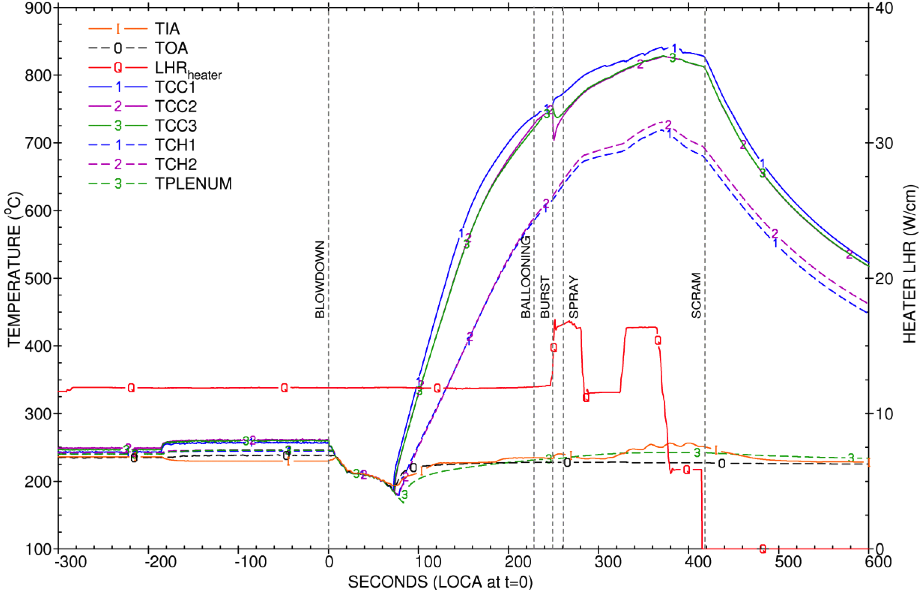
Figure 4: Signals for measured cladding (TCC), heater (TCH), coolant inlet (TIA) and outlet (TOA) temperatures, and heater power (LHR) during the IFA-650.10 test. Taken from (Lavoil, 2010).
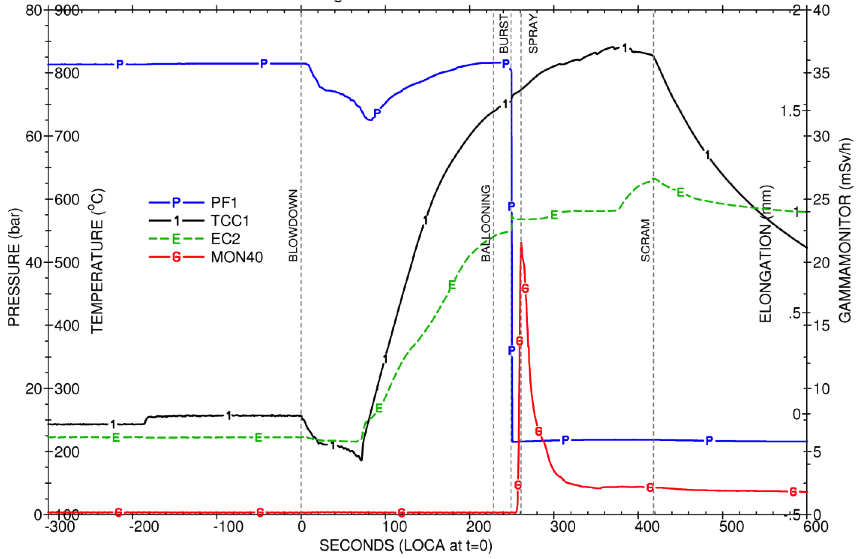
Figure 5: Signals for measured rod inner pressure (PF1), clad temperature (TCC), elongation (EC2) and gamma monitor response in the blow-down line (MON40). Taken from (Lavoil, 2010).
Rod inner pressure in hot conditions was 70 bar. Cladding ballooning started 228 seconds after the blowdown initiation (ifa65010_inner_pressure_hwr-974]). The burst occurred 249 sec after the beginning of the blowdown. The burst time is recognizable as corresponding to the drop of the internal pressure signal and also, by the increase in activity indicated by the gamma monitor 5 sec after the burst.
During post-irradiation examinations (PIE), the cladding outer diameter profile for IFA-650.10 was measured, which can be compared to code calculations for the mechanical behavior (ballooning) of the cladding. Figure 6 shown a visual inspection of the IFA-650 fuel rod around the burst opening.
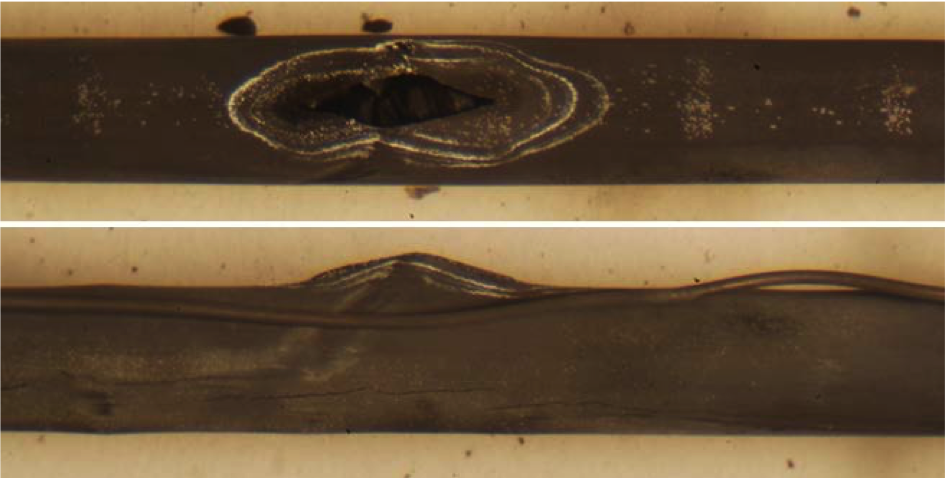
Figure 6: Post-test visual inspection for IFA-650.10 showing burst opening at two orthogonal orientations.
Model Description
A 2D BISON model of the IFA-650.2 fuel rod was constructed. The geometric parameters specified in Table 1 were used to develop a BISON finite-element mesh that suitably represents the experimental rod, including the fuel column, cladding tube, and plenum volumes.. The fuel was meshed as a smeared column with 12 radial elements and 88 axial elements. The cladding was meshed with 4 radial elements and 176 axial elements. Linear (Quad4) elements were used. The adopted mesh parameters are consistent with previous BISON validation work (Williamson et al., 2016) and guarantee a high accuracy of the BISON thermo-mechanics solution. The plenum length was adjusted such that the initial rod inner volume is equal to the value of 17 cubic centimeters given in the documentation for the experiment (Lavoil, 2010) (Lavoil, 2010). The BISON computational mesh for the simulation of IFA-650.10 is shown in Figure 7.

Figure 7: BISON computational finite-element mesh for the IFA-650.10 fuel rod. The view is magnified 10 times in the radial direction for improved visualization.
The BISON input file was developed, which includes calls to the thermo-mechanics, material and behavioral models, fuel-cladding contact models, initial conditions, boundary conditions, coolant channel heat transfer models, and time discretization controls.
Refabrication in BISON is accounted for by specifying the refabrication temperature, pressure, and volume to suitably reset the rod conditions at the time of refabrication.
Material and Behavioral Models
The following material and behavioral models were used for the UO fuel:
UO2Thermal - NFIR: temperature and burnup dependent thermal properties
UO2IsotropicDamageElasticityTensor, and UO2CreepUpdate: Mechanical behavior including the combined effects of creep and isotropic damage
UO2RelocationEigenstrain: relocation strains, relocation activation threshold power set to 5 kW/m
ComputeThermalExpansionEigenstrain: thermal expansion with a constant instantaneous thermal expansion coefficient
UO2VolumetricSwellingEigenstrain: volumetric expansion due to solid and gaseous swelling
UO2Sifgrs: fission gas release model with the combined gaseous swelling model.
The following models were used for the Zircaloy-4 cladding that allow for representing ballooning and burst under LOCA conditions:
ZryCreepLOCAUpdate: High-temperature creep model based on the correlations from (Neitzel and Rosinger, 1980) (Erbacher et al., 1982). This allows for outward creep deformation of the cladding tube under the effect of internal pressurization and high temperature leading to cladding ballooning. The model accounts for the effect of crystallographic phase transition.
ComputeIsotropicElasticityTensor: elastic properties of the cladding
ZryIrradiationGrowthEigenstrain: ESCORE model for volumetric swelling due to irradiation exposure
ZryThermalExpansionMATPROEigenstrain: MATPRO model for thermal expansion in zirconium alloy
ZryOxidation: High-temperature cladding oxidation calculated using the correlations of Leistikow (Leistikow et al., 1983) (in ZryOxidation model).
ZRPhase: Crystallographic phase transition model which computes the volume fraction of phase for Zr-based cladding materials as a function of time and temperature. The model is based on (Massih, 2009) (Massih and Jernkvist, 2009).
ZryCladdingFailure: Evaluates the onset of cladding burst due to combined overstress and plastic instability (Erbacher et al., 1982) (Marcello et al., 2014), and takes into account the effect of Zirconium phase transition and oxidation.
Development of time-dependent boundary conditions
As for the time-dependent boundary conditions such as linear power, coolant pressure histories, and thermal boundary conditions at the cladding outer wall, clearly their accurate determination is crucial to the reliability of the experiment simulation. For the Halden LOCA experiments, evaluating the time-dependent boundary conditions is a very significant task given the complexity of the experimental setup and procedure. The fuel rod power and coolant pressure histories need to be appropriately tabulated and supplied for the BISON calculation, which involves elaboration of the raw Halden data from neutron detector measurements. Determining the thermal boundary conditions at the cladding outer surface requires modeling heat transfer from the cladding to the coolant during the multiple phases of the IFA-650.10 experimental procedure, with each phase being characterized by a specific coolant condition, including forced and natural circulation, and the dry phase with the coolant becoming steam, the heat transfer being degraded and the heat transfer mode gradually switching from convection to radiation.
A BISON developer was stationed onsite at the Halden Reactor Project in Norway starting in October 2016. This researcher learned how to extract experimental data from the Halden data base plus use onsite data plotting programs. The IFA-650.10 experiment was discussed with Halden scientists to gain a better understanding of the experimental setup and available data. This information was been transferred to INL along with Halden raw data for the measured experimental conditions. Such data have been subsequently elaborated at INL in order to develop the boundary conditions (time-dependent inputs) for the BISON simulation of IFA-650.10. Because the raw measured data are available only at selected locations, while the fuel performance simulation requires boundary conditions at every location along the boundary of the computational domain, the development of such boundary conditions required a work of interpolation/extrapolation, involving the application of appropriate assumptions and physical sense in order to provide accurate inputs to the BISON code. An account of the work of development of the boundary conditions for each of the phases of the IFA-650.10 experiment is given in the following subsections.
Commercial base irradiation
As mentioned in Fuel rod characteristics and experimental setup, the IFA-650.10 experiment was carried out using a segment of a PWR rod that had been irradiated in a commercial PWR up to a burn-up of 61 MWd/kgU. Clearly, the commercial base irradiation needs to be included in a fuel performance simulation in order to account for the burnup dependent changes occurring in the fuel rod, hence providing the correct initial conditions for the simulation of the LOCA test in the Halden reactor. Simulation of the commercial base irradiation was included in the BISON analysis of IFA-650.10. The power history for the base irradiation was made available by the Halden Project in chart form and is reported in Figure 8. The power data were digitized from this chart and tabulated for usage as input to BISON. For simplicity, the base irradiation was simulated on the geometry of the refabricated IFA-650.10 rod rather than on the geometry of the original commercial mother rod. As for the coolant conditions during the base irradiation, typical PWR parameters were adopted, i.e.: water at a pressure of 15.5 MPa, an inlet temperature of 580 K and an inlet mass flux of 3800 kg/m-s was considered. The heat transfer from the cladding to the coolant was modeled using BISON's internal coolant channel model for convective heat transfer under PWR conditions.
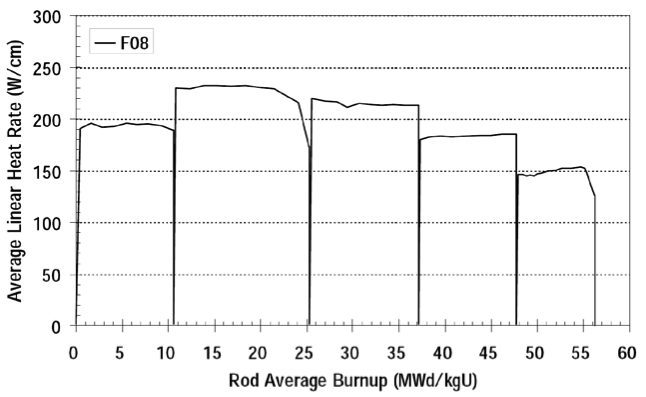
Figure 8: Power history for the commercial base irradiation of IFA-650.10
Halden test - Preparatory phases
As outlined in Operation procedure and conditions, the Halden test began with preparatory phases of fuel rod irradiation under coolant conditions of forced circulation, first, and natural circulation, afterwards. To determine the temperature boundary conditions at the cladding outer surface, rather than explicitly modeling the cladding-to-coolant heat transfer during these preparatory phases, we chose a pragmatic approach in which we used the measured temperatures available from the Halden data. In particular, for these initial phases of the experiment, we considered an axially flat temperature profile, with the (time dependent) temperature value being the average of the temperature data measured at two different axial locations (Fuel rod characteristics and experimental setup). The temperature profile along the plenum length is also considered as flat, with the temperature value being equal to the temperature measured by the third thermocouple, which was placed at the axial midplane of the plenum (Fuel rod characteristics and experimental setup).
This approach guarantees good accuracy as the temperature values are derived directly from the measurements. The downside of this approach is that axial temperature peaking (which is associated with power peaking) is not allowed as an axially flat profile is used. This makes such an approach less suitable for the post-blowdown phases of the test (i.e., the blowdown phase and the heat-up phase), when cladding ballooning occurs that presents an axial dependence (localized ballooning and burst in correspondence of the hottest axial position). This is a consequence of the axial temperature peaking in the cladding and the strong temperature dependence of Zircaloy thermal creep and the associated cladding ballooning. Hence, a more detailed approach with a physically based modeling of heat transfer is needed for the post-blowdown phases (see Extension of the BISON coolant channel model and Halden test - Blowdown and heat-up phases). However, axial peaking is not anticipated to be important during the low-temperature, preparatory phases of the test, when no ballooning of the cladding is involved. Basically, the simulation of the preparatory phases only serves the purpose of determining the initial temperature and rod inner pressure conditions for the subsequent post-blowdown phases. Therefore, the approach based on measured temperatures is thought to be ideal as it allows one to minimize uncertainty in the temperature boundary condition for the simulation utilizing an axially flat profile, sufficient for the purpose of analyzing the preparatory phases of the test.
As for the post-blowdown phases, a more detailed approach is developed, which is described in the next sections. Since radiative heat transfer to structural components surrounding the rod becomes important (dominant) during the hot phase (while it is negligible for fuel performance simulations under normal reactor conditions), extending BISON's coolant channel model to include the radiative contribution was necessary. This work is briefly described in Extension of the BISON coolant channel model. Then, we applied the extended model to the determination of the cladding thermal boundary conditions during the post-blowdown phases of the experiment, as discussed in the Halden test section.
Switching between different approaches to prescribing the thermal boundary conditions (i.e., convection calculations for the base irradiation, prescribed temperatures during the preparatory phases, and convection-radiation calculations during the post-blowdown phases) was made possible by a recently developed MOOSE capability (called 'Controls') (INL, 2019).
As for the rod LHGR and coolant pressure histories, these were also obtained from Halden as measured time-dependent data and tabulated for usage to inform the BISON simulation.
Extension of the BISON coolant channel model
At high temperature, radiative heat transfer can occur from the cladding outer surface to the surrounding core structural components. In simulated LOCA tests at Halden, heat can be transferred to the heating element as well. Indeed, radiation is the dominant mode of heat transfer during the dry phase of the experiment.
Radiative heat transfer was implemented in BISON for modeling heat transfer in Halden LOCA tests. A new heat transfer mode was added to the code to compute radiative heat transfer. For this purpose, the effective emissivity parameter is needed. The value chosen for this parameter for the IFA-650.10 simulation is 0.6, which is the typical surface emissivity of oxidized zirconium alloy cladding (Stuckert, 2002).
The radiation heat transfer coefficient is described by the following equation:
Where is the Stefan-Boltzmann constant ( W/m K), T and T the temperatures of the two heat exchanging surfaces, and the surface emissivities of the cladding and heater, respectively, and and the radii of the cladding and heater surfaces.
Halden test - Blowdown and heat-up phases
Measured temperatures at different locations in the IFA-650 rig during the post-blowdown phases of the test (outer cladding surface along the fuel stack and in correspondence of the upper plenum mid-plane, heater surface) are plotted in Figure 9.
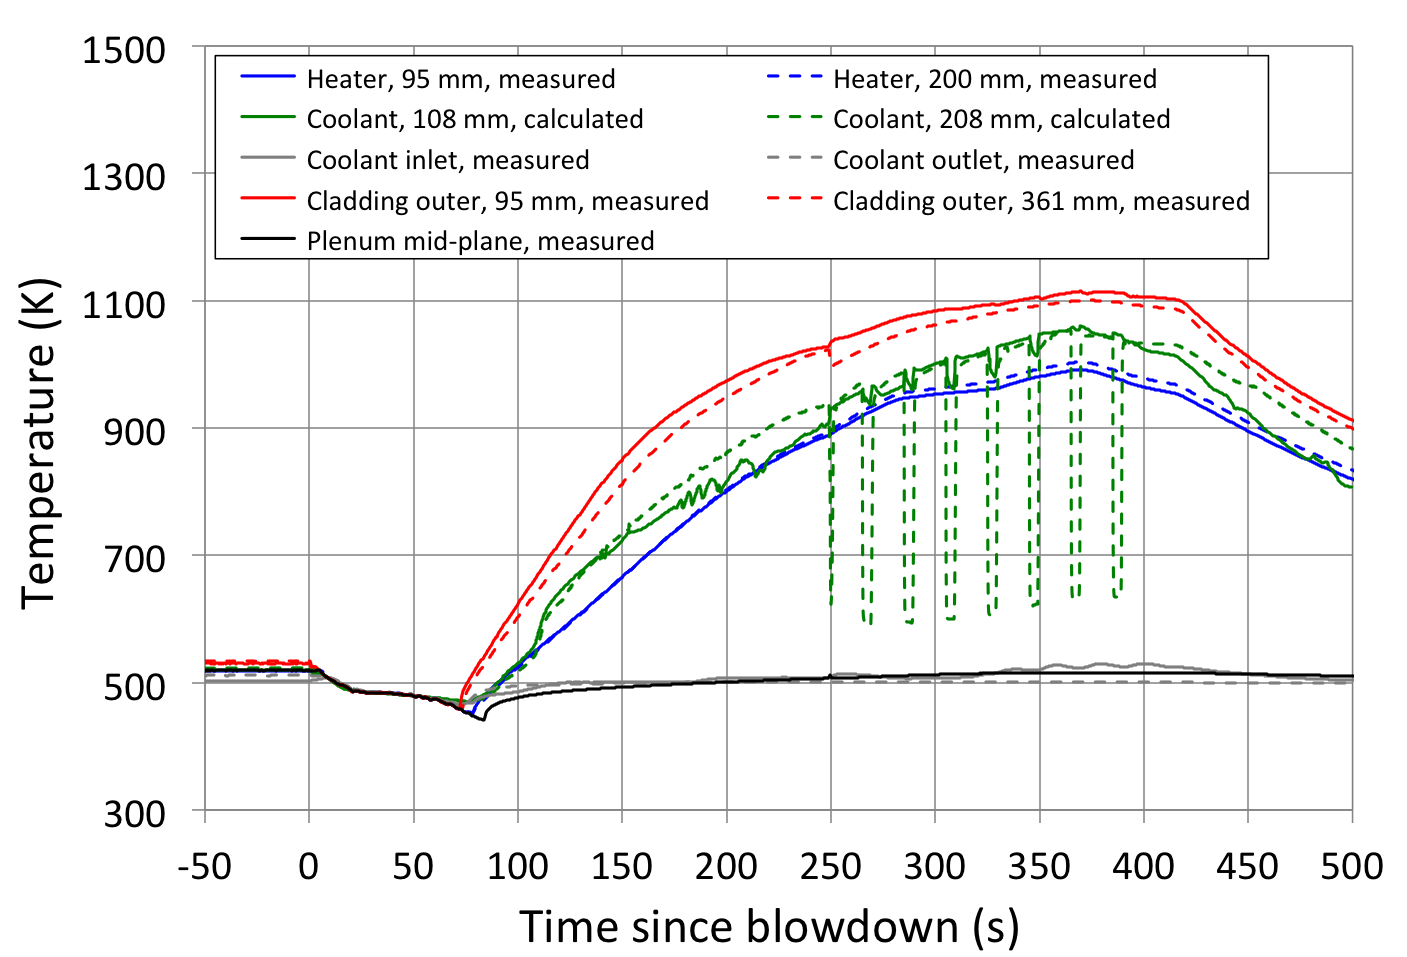
Figure 9: Measured temperatures at different locations in the IFA-650 rig during the post-blowdown phases of the test. Calculated coolant temperatures (FUMAC project) are also shown. Positions are axial distances from the bottom of the fuel stack. Note that the fuel stack length is 440 mm (Table 1).
The cladding temperatures start increasing 71 s after blowdown, i.e., when the rig is emptied of water and heat transfer from the cladding to the coolant (i.e., steam at this point) is degraded. This time identifies the end of the blowdown phase and the beginning of the heat-up or dry phase. As expected, the temperature at the plenum is very close to the coolant inlet/outlet temperatures, since there is no power generation at the plenum. The plot also includes calculated coolant temperatures at axial positions that approximately correspond to the positions of the heater temperature measurements. These calculations were provided through the FUMAC project. The comparison demonstrates that during the post-blowdown phases of the test, the coolant temperature is close to the heater temperature. This justifies the assumption, which was made in the present work, of considering the coolant temperature as equal to the heater temperature for the purpose of estimating the radiative heat transfer from the cladding to the heater. In particular, we considered the coolant temperature along the fuel rod length and up to the top of the heater as equal to the average of the heater temperatures measured with the two heater thermocouples (Fuel rod characteristics and experimental setup).
Above the top of the heater, i.e., in correspondence of the top portion of the fuel rod plenum, the coolant temperature was approximated as equal to the measured coolant outer temperature. The validity of such hypothesis is confirmed by the comparison between measured coolant outlet temperature and temperature at plenum mid-plane in Figure 9. Since we expect the coolant temperature along the plenum to be close to the temperature of the cladding at the same position (because there is no heat generation at the plenum), the comparison indicates that the measured coolant temperature at outlet position is a good approximation for the coolant temperature along the plenum.
As for the linear heat generation rate (LHGR) history for the rod, this was obtained from Halden as raw data from neutron detector measurements. In particular, Halden provided experimental measurements as a fast-scan recording (two per second). The time-dependent LHGR raw data were tabulated for usage in BISON. The data were provided at 5 axial locations. The full information, i.e., data at all locations, was used for the BISON simulation in order to allow for the axial power peaking profile, with the maximum power being close to the axial mid-plane of the fuel stack. Linear interpolation of the data along the axial direction was performed in order to obtain the rod power profile at each time step. Power peaking determines the axially varying heat transfer and ultimately is reflected in the axial peaking of the cladding temperature profile. As mentioned in Halden test - Preparatory phases, such axial peaking is important during the dry phase of the test, when cladding ballooning occurs with the maximum ballooning and burst location being at the hottest axial position. These localized effects occur in spite of the power and temperature peaking effects being low, and result from the strong temperature dependence of Zircaloy thermal creep and the associated cladding ballooning. Hence, detailed consideration of the axial power and temperature profiles is necessary in order to accurately capture cladding ballooning and burst during a LOCA simulation.
Based on the coolant temperatures estimated as above and the prescribed LHGR profile, the calculation of the heat transfer from the cladding to the coolant (or the heater, for the radiative contribution) was performed in the present work using the extended BISON coolant channel model (Extension of the BISON coolant channel model). Such calculation enabled the determination of the thermal boundary conditions at the cladding outer wall. Some further details of this calculation are discussed hereafter.
Figure 10 shows the heat transfer coefficient (HTC) for the BISON simulation of IFA-650.10 during the post-blowdown phase of the test. The figure only illustrates the time span after the end of blowdown (when the water coolant flashes to steam, heat transfer is rapidly degraded and the cladding temperature consequently starts increasing, i.e., 71 seconds after valves opening (Lavoil, 2010)). The extended BISON coolant channel model (Extension of the BISON coolant channel model) allows for combined convective, conductive and radiative heat transfer, as is necessary to model the dry phase of the experiment. As for the HTC for convection and conduction, we prescribe values dropping from 20,000 W/mK during the first 71 seconds after valves opening (Jernkvist, 2016) to 67.5 W/mK over four seconds. The latter value represents the average of best-estimate values for the dry phase of the test (Jernkvist, 2016). BISON's coolant channel model computes the radiative HTC and calculates the thermal boundary condition at the cladding outer surface considering all contributions to heat transfer. The overall HTC is also plotted in Figure 10. Average values along the active rod length as well as the value at the mid-plane of the active length are included. The value at the mid-plane is higher because the radiative HTC is roughly proportional to the cubed average of the temperatures of the heat exchanging bodies (i.e., the cladding and the heater in this case), which is highest near the mid-plane of the active length.
Note that the experimental transient continued beyond the time of burst (ifa65010_temperatures]), but we stop the simulation at burst time. After burst, factors such as the geometry of the burst opening, fuel rod depressurization, and possible fuel dispersal all affect fuel rod behavior. Accounting for these additional aspects is beyond the scope of this work, where we rather focus on predicting pre-burst fuel rod behavior (temperatures, ballooning) as well as the time to burst. Burst time is directly related to the coping time for reactor operators during a LOCA accident; hence, its accurate prediction is a capability of primary importance for a fuel performance code.
Figure 10: Heat transfer coefficients for the BISON calculation of thermal boundary conditions during the post-blowdown phase of the IFA-650.10 test. Positions are axial distances from the bottom of the fuel stack.
The quantitative accuracy of the calculated cladding temperature boundary conditions with the code development and procedure described above is demonstrated in the Results section, where the Halden temperature measurements are compared to BISON calculated temperatures.
Input files
The BISON input and all supporting files (power histories, axial power profile, etc.) for this case are provided with the code distribution at bison/assessment/LWR/validation/LOCA_IFA_650/analysis/IFA_650_10.
Results
The BISON simulation covers all of the the phases of the IFA-650.10 experiment, from the base irradiation to the LOCA transient up to the burst failure of the fuel rod cladding.
Temperature distributions in the fuel rod
Figure 11 shows the comparison of the cladding outer temperatures calculated in BISON for the IFA-650.10 test compared to the Halden measurements at the axial locations where the measurements were performed. The plot covers the blowdown and heat-up phases up to cladding burst. A very good agreement between the calculated temperatures (BISON boundary conditions) and the measurements is demonstrated. Cladding temperature drives thermally activated processes of cladding creep and ballooning, and ultimately cladding failure due to burst, hence, the accurate determination of the temperature boundary conditions at the cladding outer surface is a prerequisite for realistic fuel performance simulations. Indeed, correctly determining the thermal boundary conditions for a LOCA experiment involves significant additional complexity compared to normal reactor operating conditions, due to the different phases of the experiment which are associated with different heat transfer regimes and, mostly, the importance of radiative heat transfer, which is negligible in normal operating conditions but becomes the dominant mode during the heat-up phase of the Halden LOCA experiments. Therefore, the significant work performed on the thermal boundary conditions (Development of time-dependent boundary conditions), also involving an ad-hoc extension of BISON's coolant channel model to introduce the effect of radiative heat transfer (Extension of the BISON coolant channel model and Halden test - Blowdown and heat-up phases) was of paramount importance for the successful completion of the present milestone.
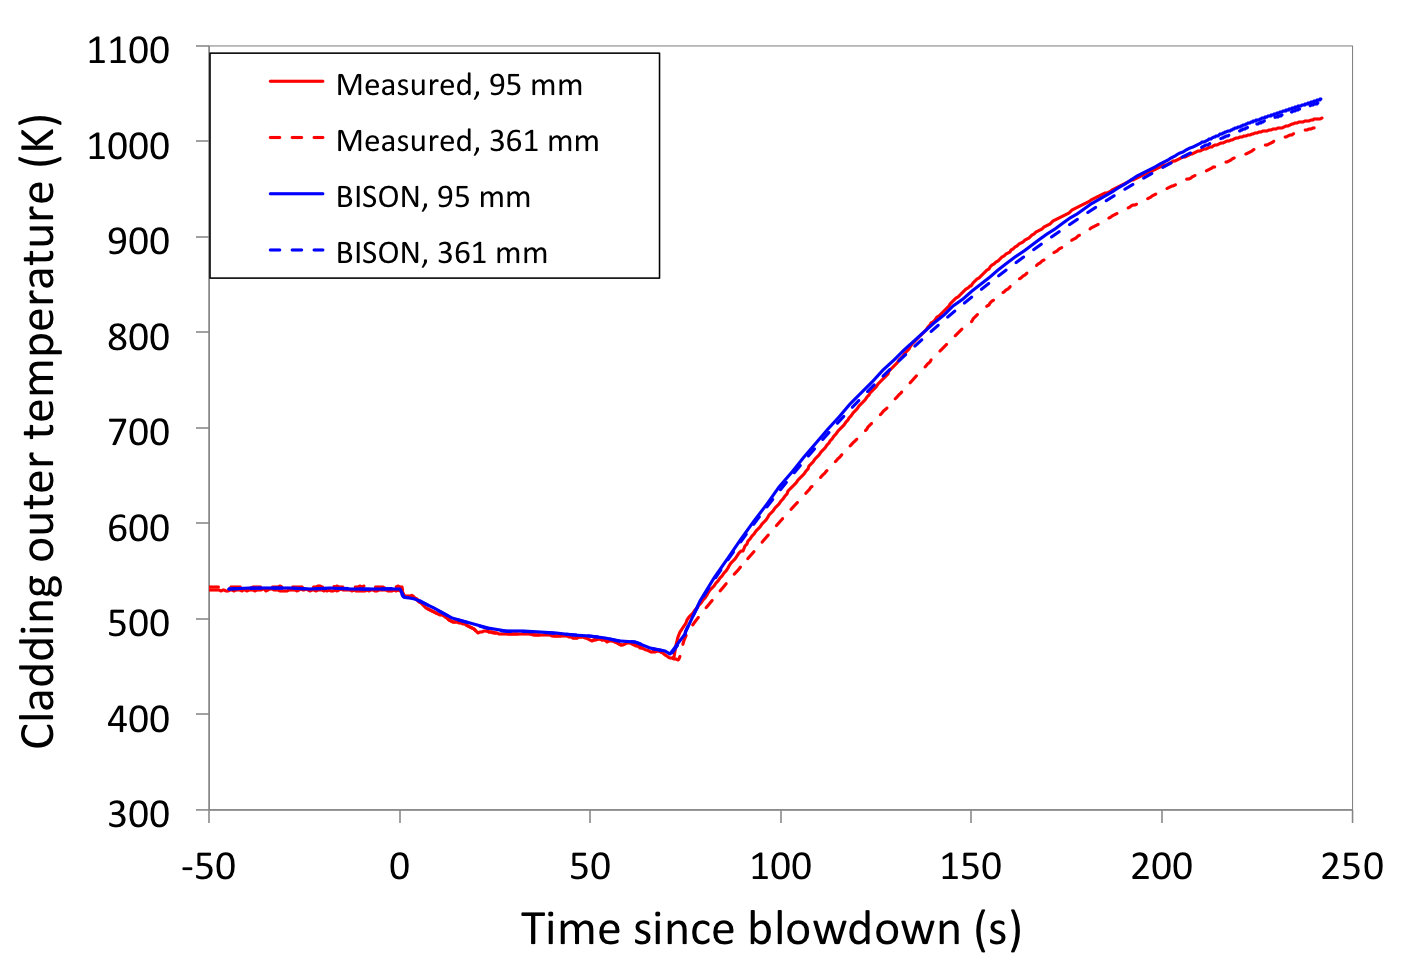
Figure 11: Measured cladding outer temperatures at two different axial locations in the IFA-650.10 rod during the post-blowdown phases of the test and calculated temperatures in BISON (with an extended coolant channel model at corresponding locations). Positions are axial distances from the bottom of the fuel stack.
Figure 12 illustrates calculated axial profiles of cladding outer temperature at three instants during the IFA-650 test. Temperature starts increasing at the end of the blowdown phase (beginning of heat-up). Increasing temperature causes cladding ballooning due to high-temperature Zircaloy creep until burst failure occurs. Note that an (albeit slight) axial peaking of the cladding outer temperature profile is predicted during the heat-up phase. This originates in the axial peaking of the rod power, which is accounted for in the simulation, and ultimately leads to localized ballooning and burst. Hence, with these boundary conditions and BISON's capabilities for fuel rod high-temperature behavior during LOCAs, we expect to be able to predict localized ballooning and burst through the BISON simulation. This is confirmed by results, as discussed in subsection Cladding ballooning and burst behavior.
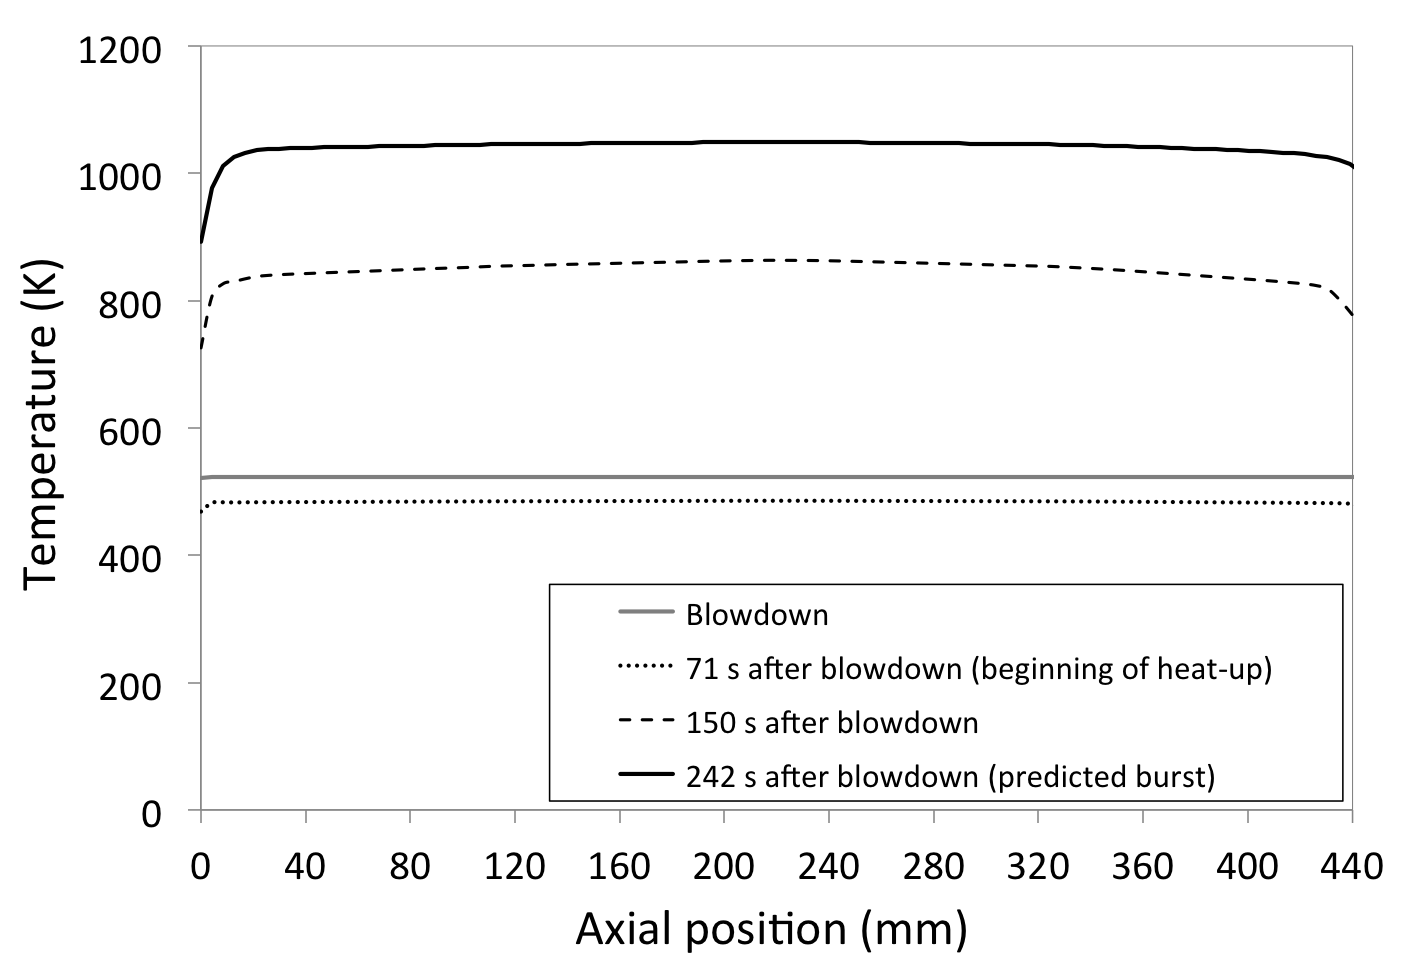
Figure 12: Calculated axial profiles of cladding outer temperature at three instants during the IFA-650.10 test, i.e., blowdown (valves opening), beginning of heat-up and time of predicted burst failure.
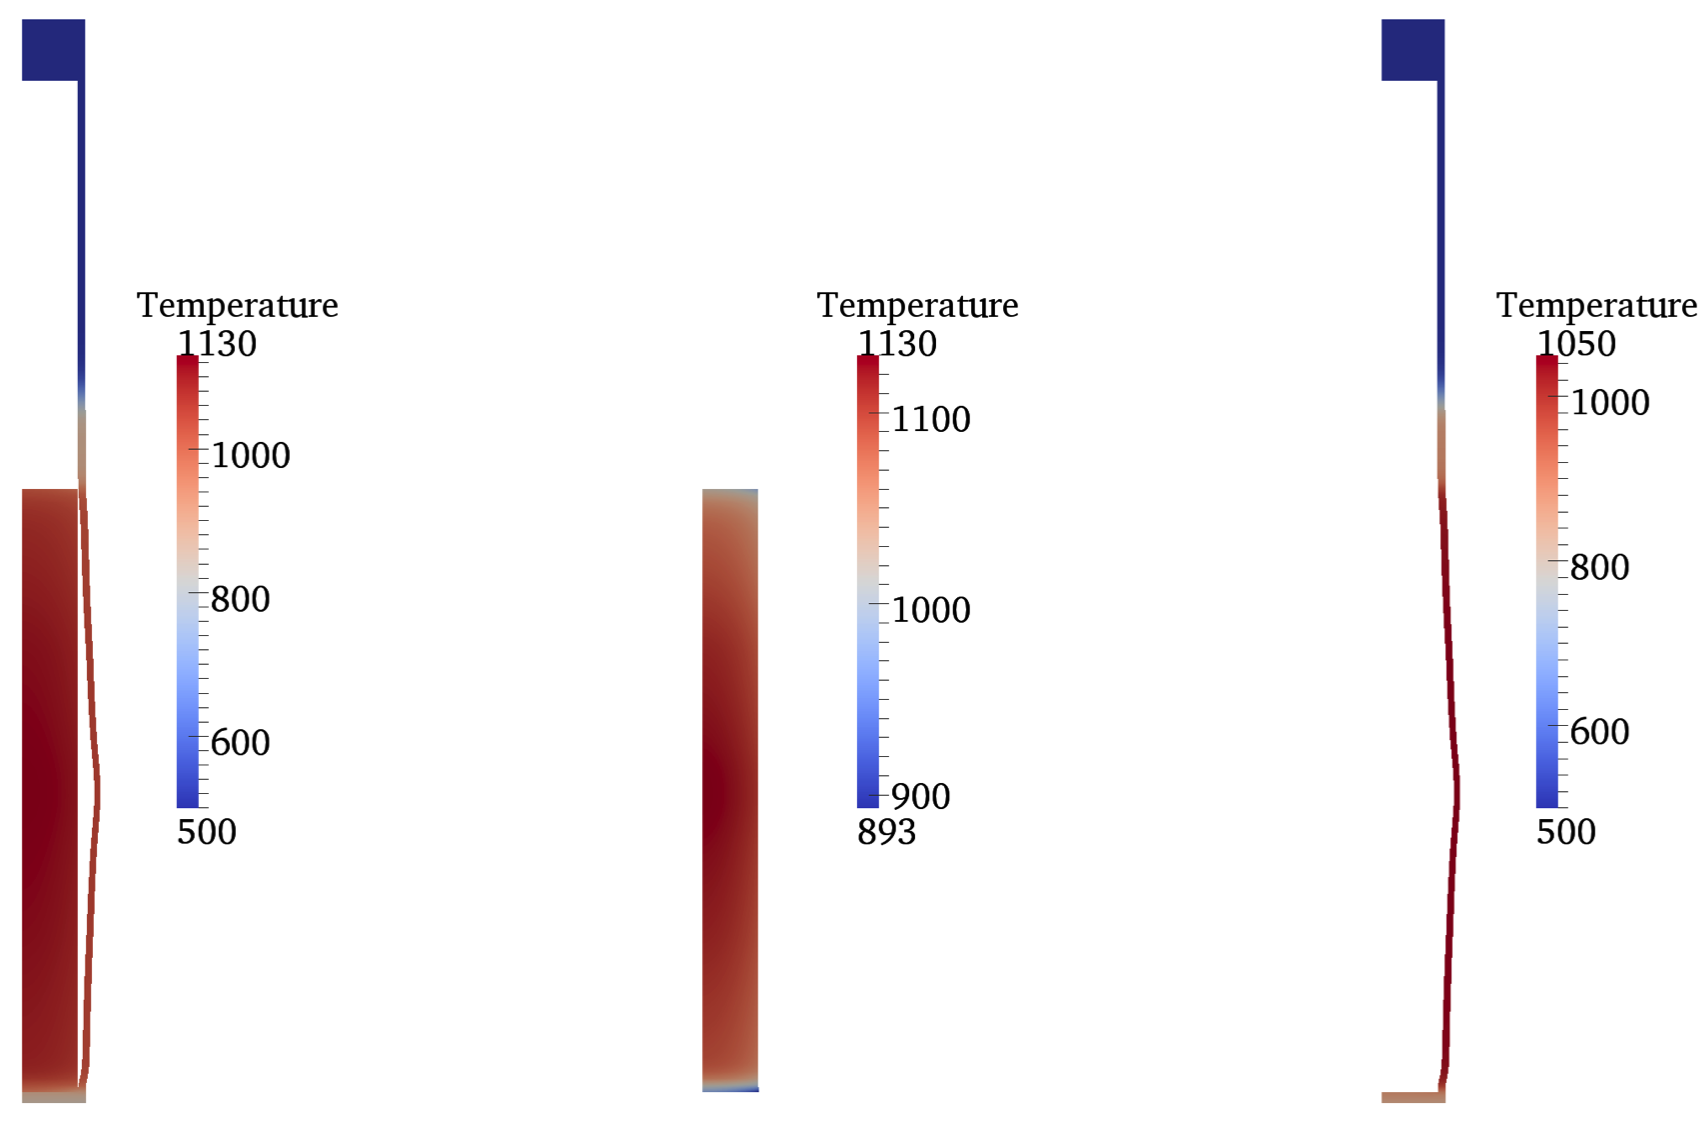
Figure 13: Temp Aggregate Contour Burst
Figure 13 shows contour plots of calculated fuel temperatures in the fuel rod at the time during the simulations that corresponds to the predicted cladding burst failure. Besides the full rod, separate plots for the fuel and cladding are shown with specific color scales. The temperature in the fuel is lower than for normal PWR operation, because of the lower power generation during a LOCA (decay power, which is simulated by a low fission power in the Halden LOCA experiments). The cladding, instead, reaches very high temperatures compared to normal PWR operation values of around 600 K because of the degraded heat transfer to the coolant during a LOCA that ultimately causes cladding heat-up and ballooning due to thermal creep. These effects are consistently reproduced in the BISON simulation.
Cladding ballooning and burst behavior
Figure 14 shows a contour plot of calculated hoop strain at the time of burst. This corresponds to the final time of the simulation and occurs in hot conditions during the LOCA transient, at the peak of cladding strain. The figure demonstrates how cladding ballooning, with large cladding strain and a maximum localized near the axial mid-plane of the fuel stack, is properly reproduced by BISON.
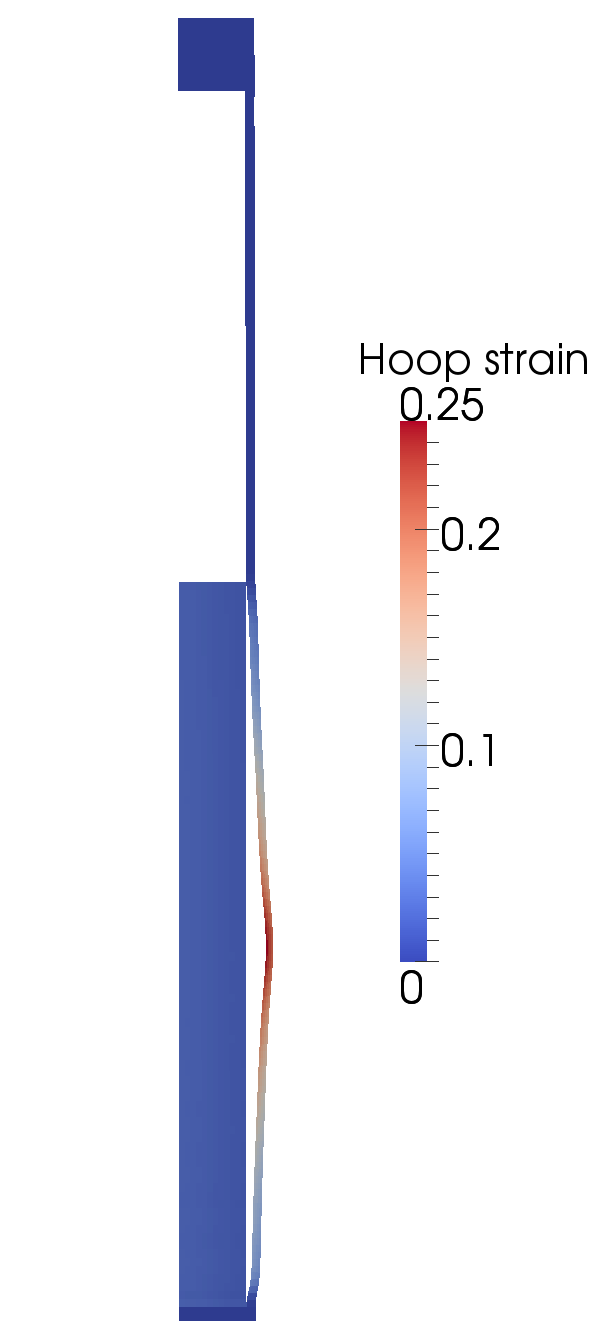
Figure 14: Contour plot of calculated hoop strain in the IFA-650.10 fuel rod at the time of cladding burst failure. Cladding ballooning as reproduced in the simulation is evident. The view is magnified 10 times in the radial direction for improved visualization.
In order to give an account of the kinetics of the ballooning process as reproduced in the simulation, Figure 15 shows the calculated time evolution of the hoop strain in the cladding (specifically, at the outer surface) during the heat-up phase of the IFA-650.10 experiment. The corresponding peak outer cladding temperature is also shown. The cladding strain rapidly accelerates (ballooning) with increasing temperature during the last 100 s before burst. This behavior ensues primarily from the exponential dependence of Zircaloy cladding creep upon temperature. This kinetics is qualitatively consistent with the behavior observed experimentally during separate-effects cladding ballooning tests (Erbacher et al., 1990). Hence, BISON reproduces cladding ballooning during the LOCA test as expected. Rapid thermal creep and ballooning continue until the cladding fails due to burst at the location of maximum strain. BISON predicts cladding burst failure according to the plastic instability criterion as the strain rate reaches the limit level. Cladding burst is predicted to occur 242 seconds after blowdown, i.e., about 7 seconds before the time observed experimentally. Such an agreement of the simulation with the experimental behavior is very good. Furthermore, BISON's prediction is conservative as cladding is predicted to fail before it was experimentally observed.
The accuracy of the solution during the very high strain rate period is guaranteed by the automatic time step control in BISON specifically developed for this work, which progressively reduces the time step length as the strain rate increases. Just before the time of burst (maximum strain rate), the time step length is 3 s. Note that time steps up to the order of 10 are used during the simulation of a base irradiation. This highlights the variety of time scales that are involved and need to be properly accounted for in a complete simulation of this experiment.
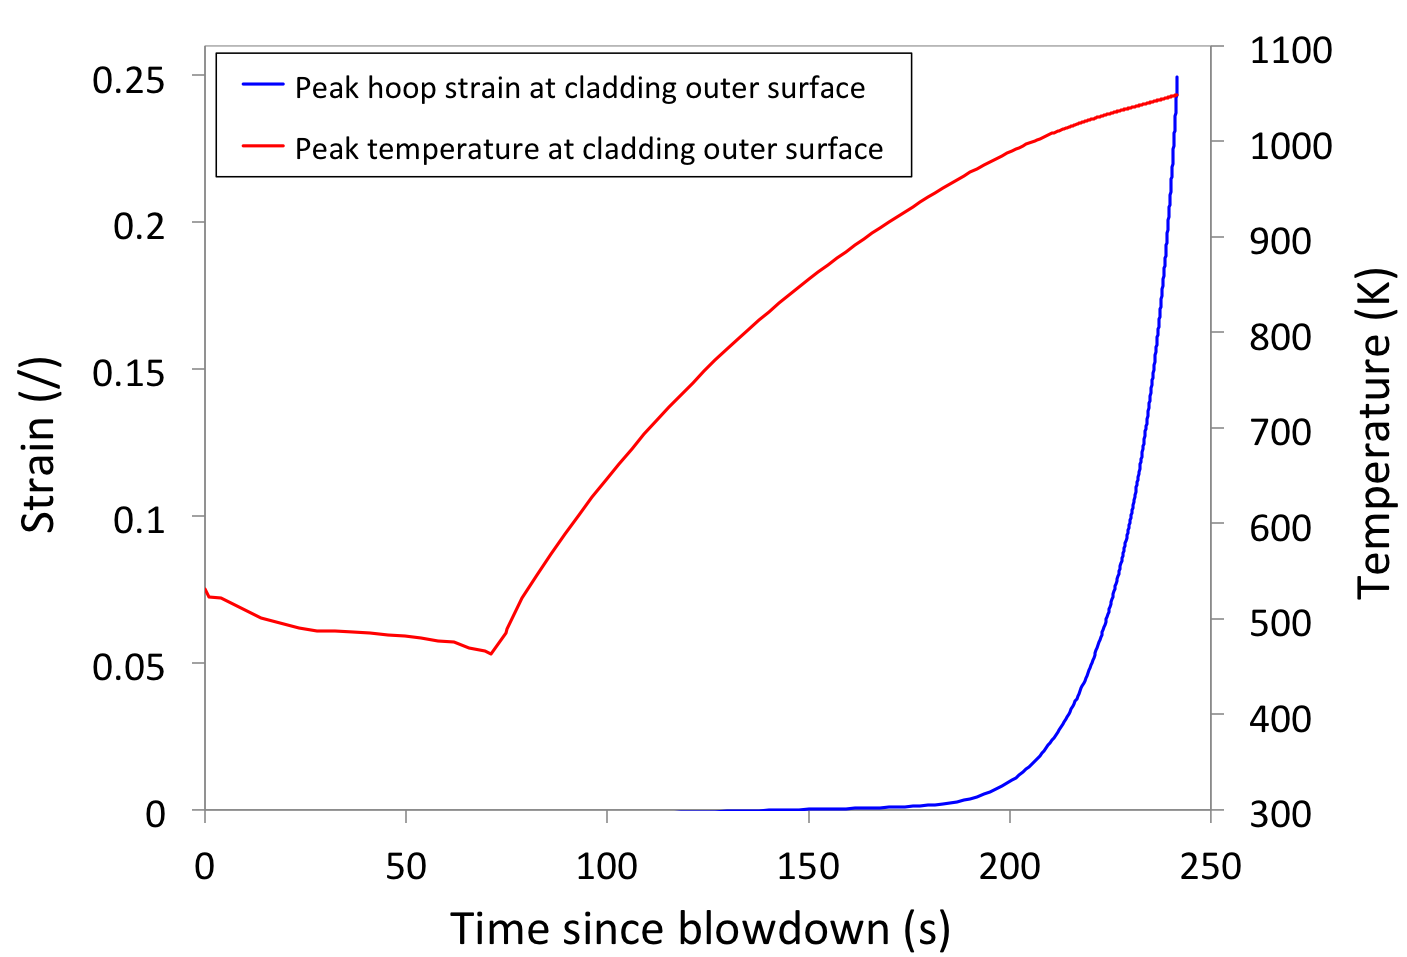
Figure 15: Calculated hoop strain and cladding temperature at peak axial position during the post-blowdown phases of IFA-650.10.
Figure 16 shows the axial profile of the cladding diameter at the end of the simulation compared with the experimental data from post-irradiation examinations.
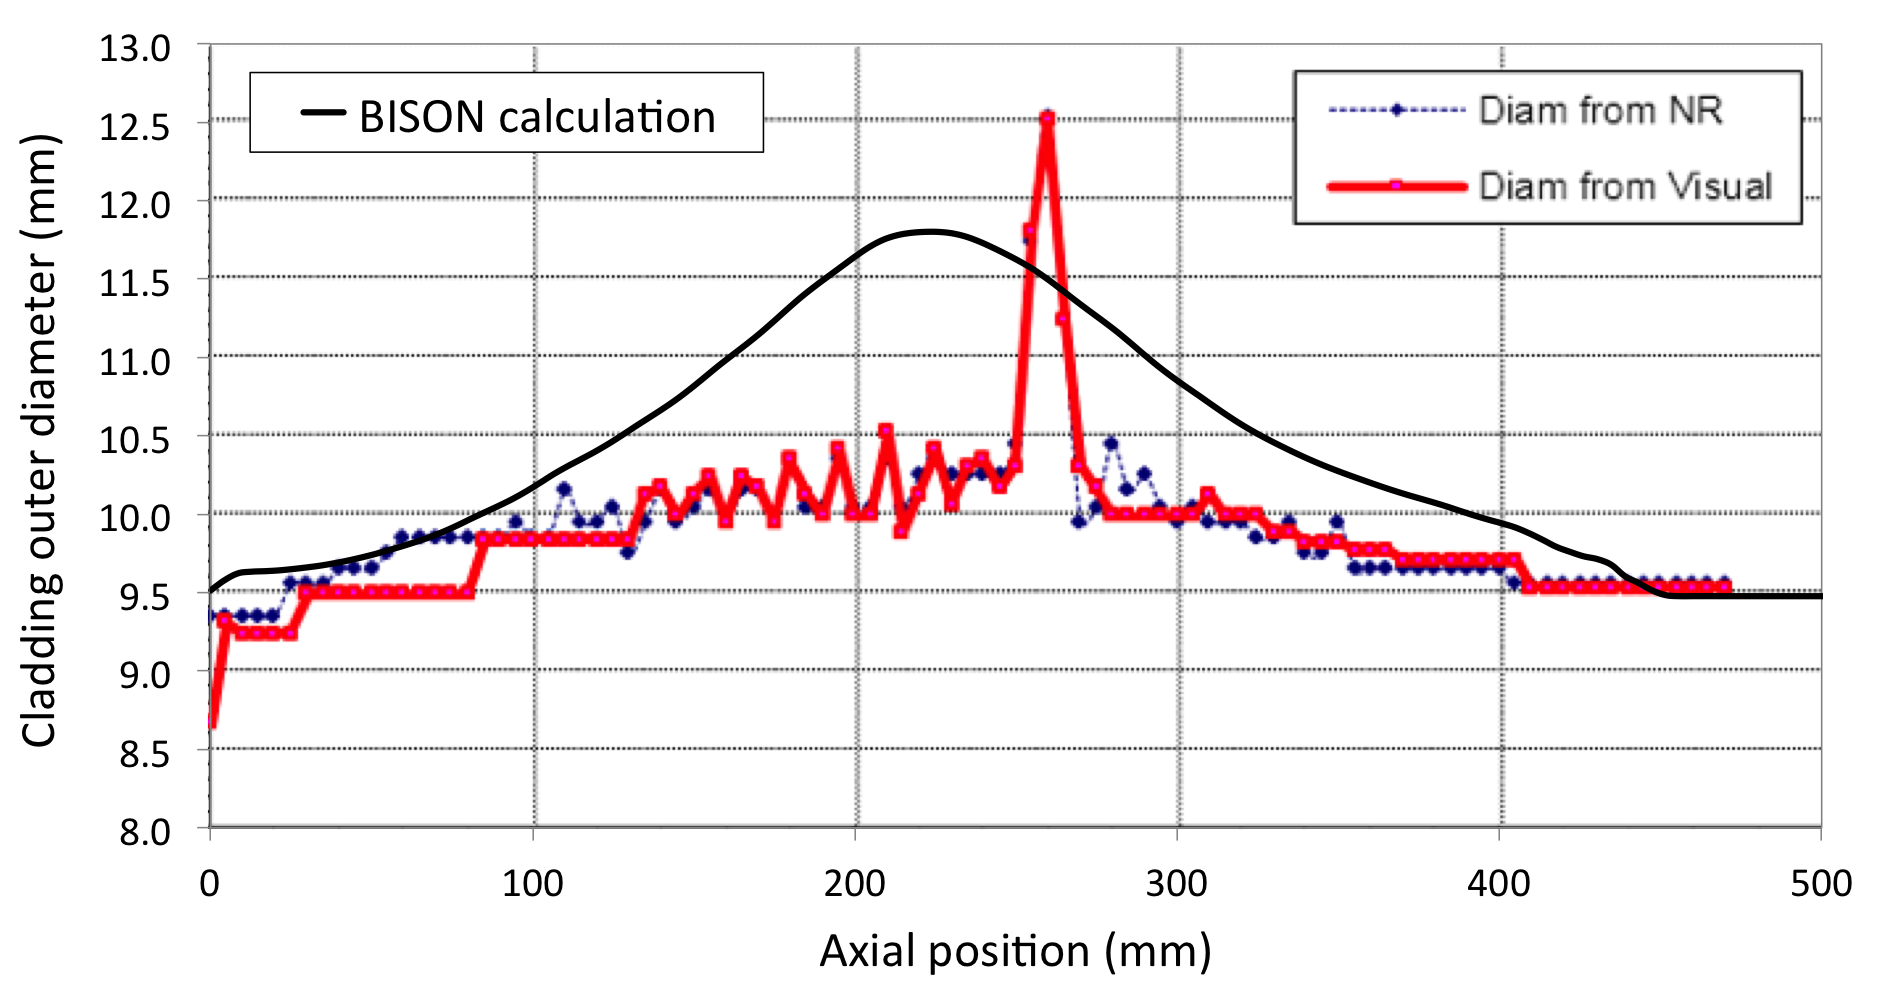
Figure 16: Calculated cladding outer diameter profile for IFA-650.10 at the end of the simulation compared to the PIE experimental data.
BISON is able to predict cladding ballooning with a physically meaningful profile and with the position of maximum strain being reasonably close to the experimental observation. However, an over-prediction of cladding outward strain along the rod is observed. Note that many variables determine the exact location of maximum strain and burst, not all of which can be accounted for in a deterministic calculation. For example, water spraying, which was active during the experiment, likely had an effect on the cladding temperature profile, hence on the location of maximum temperature and thermal creep strain. However, no quantitative information on this issue was provided by the Halden Project (Lavoil, 2010). In conclusion, the cladding diameter results are considered reasonable, in view of the involved uncertainties and complexities. Indeed it is well known that prediction of dimensional changes is a difficult area for fuel performance codes, and BISON results are in line with the state of the art (IAEA, 2008-2012) (Marcello et al., 2014). Improvements may be achieved with further developments of the cladding behavior models in BISON, in particular for cladding creep. One aspect that can be considered for future work is the anisotropic creep behavior of Zircaloy (Erbacher et al., 1982) (Neitzel and Rosinger, 1980). This will require modifications to the BISON mechanical model to allow for anisotropic behavior.
Rod inner pressure evolution
In Figure 17, the time evolution of rod inner pressure during the post-blowdown phases of the IFA-650.10 experiment is compared to the experimental (pressure transducer) data from Halden. BISON reproduces the experimental behavior with a good accuracy. A moderate over-prediction of the rod pressure during the heat-up phase is observed, which may be partly due to a discrepancy between the calculated and actual plenum temperature (which together with rod inner volume and gas content determines the plenum pressure) in consequence of the assumptions made for the estimation of the temperature boundary conditions (Development of time-dependent boundary conditions). Also, the calculated pressure as burst time is approached decreases more rapidly than experimentally observed. This is expected to be a consequence of calculated cladding outward deformation (ballooning) and the associated increase in rod inner volume being more pronounced than occurred experimentally. This circumstance is confirmed by the calculated cladding diameter profile at the end of the simulation shown in Figure 16. An improved treatment of cladding creep that allows for anisotropic behavior, and a refined calculation of the plenum temperature, may improve our results even further.
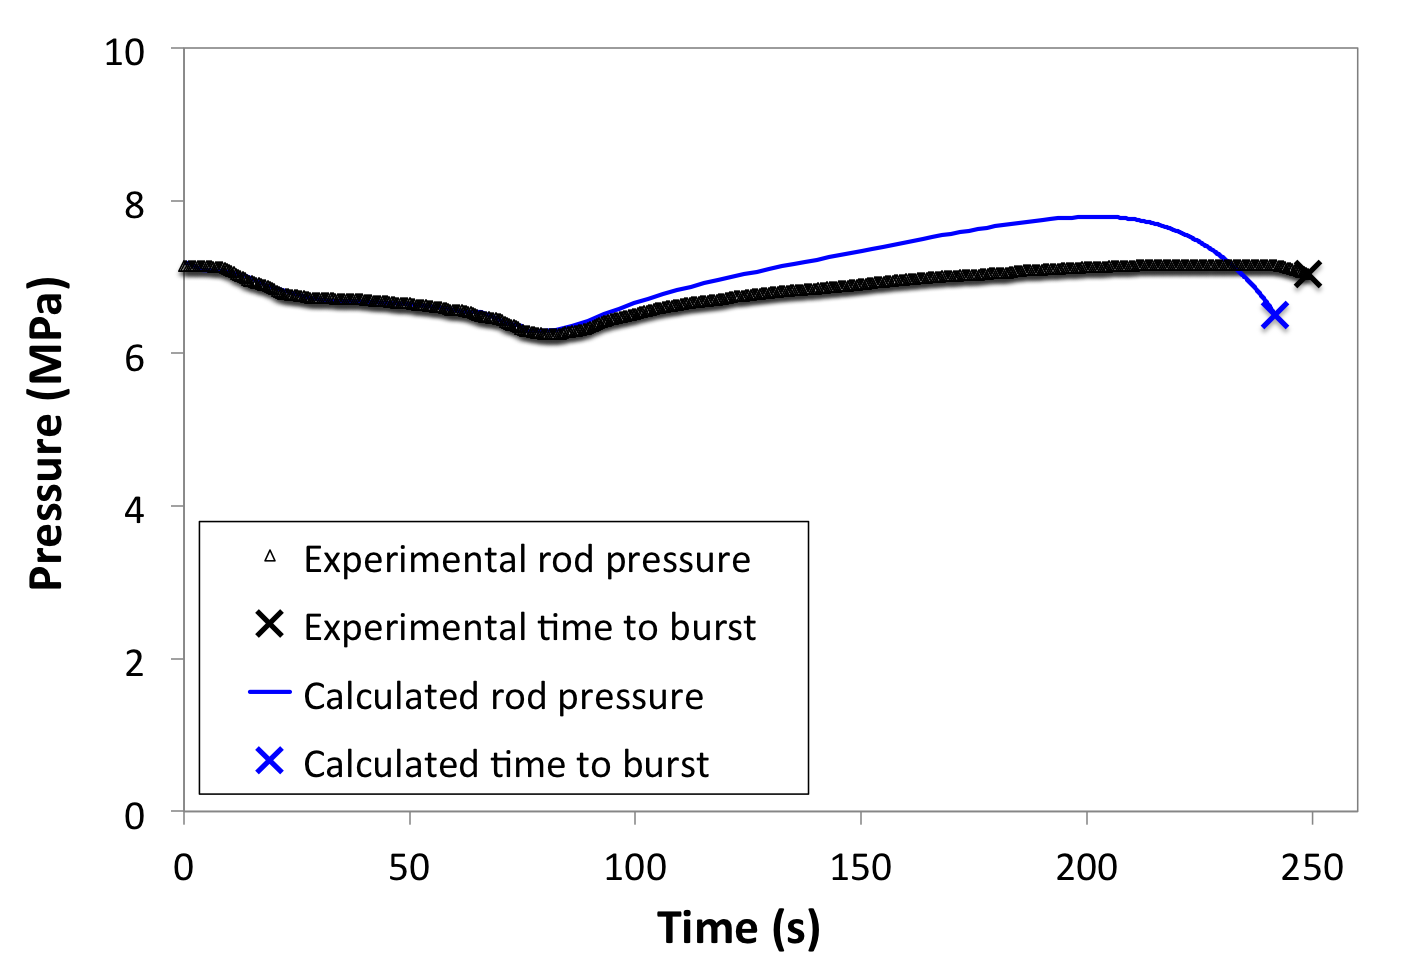
Figure 17: Rod inner pressure evolution during the post-blowdown phase of IFA-650.10 and time to cladding burst. BISON results are compared to the Halden experimental data.
As already mentioned above, the time to burst failure is predicted to be 7 seconds before experimentally observed, which is both accurate and conservative.
References
- F. J. Erbacher, H. J. Neitzel, H. Rosinger, H. Schmidt, and K. Wiehr.
Burst criterion of Zircaloy fuel claddings in a loss-of-coolant accident.
In Zirconium in the Nuclear Industry, Fifth Conference, ASTM STP 754, D.G. Franklin Ed., 271–283. American Society for Testing and Materials, 1982.[BibTeX]
- F.J. Erbacher, H.J. Neitzel, and K. Wiehr.
Technical Report KfK 4781, Kernforschungszentrum, Karlsruhe, 1990.[BibTeX]
- IAEA.
Improvement of Computer Codes Used for Fuel Behaviour Simulation (FUMEX-III): Report of a Coordinated Research Project 2008-2012.
Technical Report IAEA-TECDOC-1697, International Atomic Energy Agency, 2008-2012.[BibTeX]
- INL.
Open-source MOOSE software.
http://mooseframework.org, 2019.[BibTeX]
- L. Jernkvist.
Estimation of thermo-hydraulic boundary conditions for the Halden IFA-650 LOCA tests.
Technical Report, Quantum Technologies AB, 2016.[BibTeX]
- A. Lavoil.
LOCA Experiments IFA-650.10.
Technical Report EP-1650.10, OECD Halden Reactor Project, 2010.[BibTeX]
- A. Lavoil.
LOCA Testing at Halden; The Tenth Experiment IFA-650.10.
Technical Report HWR-974, OECD Halden Reactor Project, 2010.[BibTeX]
- S. Leistikow, G. Schanz, H. v. Berg, and A.E. Aly.
Comprehensive presentation of extended Zircaloy-4/steam oxidation results 600-1600 C.
In CSNI/IAEA specialists meeting on water reactor fuel safety and fission product release in off-normal and accident conditions. Riso Nat. Lab., Denmark, 1983.[BibTeX]
- V. Di Marcello, A. Schubert, J. van de Laar, and P. Van Uffelen.
The TRANSURANUS mechanical model for large strain analysis.
Nuclear Engineering and Design, 276:19–29, 2014.[BibTeX]
- A.R. Massih.
Transformation kinetics of zirconium alloys under non-isothermal conditions.
Journal of Nuclear Materials, 384:330–335, 2009.[BibTeX]
- Ali R Massih and Lars Olof Jernkvist.
Transformation kinetics of alloys under non-isothermal conditions.
Modelling and Simulation in Materials Science and Engineering, 17(5):055002, 2009.[BibTeX]
- H. J. Neitzel and H. Rosinger.
The development of a burst criterion for zircaloy fuel cladding under loca conditions.
Technical Report KfK 4343, Kernforschungszentrum Karlsruhe GmbH (Germany, Kernforschungszentrum Karlsruhe, Germany, 1980.[BibTeX]
- J. Stuckert.
On the thermo-physical properties of Zircaloy-4 and ZrO$_2$ at high temperature.
Technical Report FZKA 6739, Kernforschungszentrum Karlsruhe, Germany, 2002.[BibTeX]
- R. L. Williamson, K. A. Gamble, D. M. Perez, S. R. Novascone, G. Pastore, R. J. Gardner, J. D. Hales, W. Liu, and A. Mai.
Validating the \mbox BISON fuel performance code to integral \mbox LWR experiments.
Nuclear Engineering and Design, 301():232–244, 2016.[BibTeX]
- J. Zhang and M. Veshchunov.
Status Update of the IAEA FUMAC Project.
Presented at the OECD/NEA Expert Group on Reactor Fuel Performance (EGRFP), Paris, France, February 2016.[BibTeX]