RIA CABRI REP Na-2, 3, 5, 10
Overview
Over the past few decades the average fuel cycle lengths have been extended and thus the average fuel burnups have increased. Experimental data from test reactors indicate that fuel performance during reactivity-initiated accidents (RIA) decreases with higher burnups (Montgomery and Rashid, 1996). Therefore the ability to accurately predict the phenomena of interest during these types of accidents will be necessary for safe operation of reactors with fuel at higher burnup levels. To date, more than a thousand pulse irradiation tests prototypic of RIA events have been carried out on previously unirradiated (fresh) fuel. About 140 tests have been done on pre-irradiated samples, but that data is limited beyond burnup levels of 40 GWd/tU and is based on older fuel rod designs. Only a few tests have been performed on rods at extended burnup and these have been performed at the CABRI facility in France and the Nuclear Safety Research Reactor (NSRR) in Japan. The purpose of these programs was to provide data for high burnup fuels that can be used to develop safety criteria at extended burnup levels and to provide data to validate analytical codes.
The RIA tests at the CABRI reactor facility began in 1992 by the "Institut de Protection et de Sûreté Nucléaire" (IPSN which is now IRSN) in collaboration with Electricité de France (EDF), Framatome, CEA, and with participation of the US NRC. A total of twelve tests were performed within the CABRI REP sodium loop using preirradiated fuel rods having burnups ranging between 33 and 65 GWd/tU. Of the twelve, eight contained UO2 fuel and four were MOX. The cladding for all tests was Zircaloy 4 except test 11 which was M5. Following the CABRI REP program, another series of tests have been initiated under the CABRI International Program (CIP) to test high burnup fuel with advanced cladding alloys.
The CABRI test reactor is a pool-type Light Water Reactor (LWR) designed with a central area that can accept the insertion of a test device. The central area was originally designed to study fast reactor transients and contains a sodium coolant loop. During the experiment, the test rod is placed inside a test capsule which contains the in-pile instrumentation. Due to the sodium coolant loop, the test capsule temperature and pressure are different from LWR conditions, but the tests are considered appropriate to study the response of the rodlet up to the departure from nucleate boiling point. Under these conditions the effects of pellet cladding mechanical interaction (PCMI) can be tested.
The tests chosen for evaluation in this study include the CABRI REP Na-2, 3, 5, and 10 cases with UO2 fuel. Each will be discussed in detail in the following section. Details of the modelling options will then be discussed followed by a comparison of the results. For this validation study a majority of the comparisons are against results from the FALCON fuel performance code (Rashid et al., 2004) (performed by the Electric Power Research Institute (EPRI)) as access to the experimental data is limited to members of the CABRI International Program.
Test Description
An overview of the four REP Na tests chosen for the BISON simulations are shown in Table 1 (Papin et al., 2007; Papin et al., 2003; Schmitz and Papin, 1999), including as-manufactured cladding and pellet geometry. A detailed description of the rodlet history for each case will be discussed below. Details on the case geometry and base irradiation conditions were taken from FRAPTRAN-1.5 Integral Assessment (Geelhood and Luscher, 2014). During all the REP Na tests the sodium coolant is heated to 280C at the test capsule inlet and pressurized to 0.5 MPa. The sodium flows at a velocity of 4 m/s.
Table 1: Overview of REP Na cases
| Test | REP Na-2 | REP Na-3 | REP Na-5 | REP Na-10 |
|---|---|---|---|---|
| (date) | (6/94) | (10/94) | (5/95) | (7/98) |
| Fuel Type | 17x17 UO | 17x17 UO | 17x17 UO | 17x17 UO |
| Cladding Type | Std Zy-4 | Std Zy-4 | Std Zy-4 | Std Zy-4 |
| Initial enrichment (U/U %) | 6.85 | 4.5 | 4.5 | 4.5 |
| Internal gas pressure (MPa, 20C) | 0.101 | 0.31 | 0.302 | 0.301 |
| Active length (mm) | 1004.9 | 440.8 | 563.5 | 559 |
| Max. burnup (GWd/tU) | 33 | 53.8 | 64 | 63 |
| Corrosion thickness (m) | 10 | 35-60 | 15-25 | 60-100 |
| Pulse width FWHM (ms) | 9.6 | 9.5 | 8.8 | 31 |
| Energy deposit (J/g) cal/g | 865 207 | 511 122.2 | 435 104 | 453 108.3 |
| Cladding OD (mm) | 9.51 | 9.55 | 9.51 | 9.51 |
| Cladding thickness (mm) | 0.637 | 0.596 | 0.578 | 0.575 |
| Pellet OD (mm) | 8.05 | 8.19 | 8.19 | 8.19 |
| Pellet height (mm) | 11.99 | 13.69 | 13.74 | 14.25 |
| Diametral fuel-cladding gap (m) | 186 | 164 | 164 | 164 |
REP Na-2
All the test rods in the CABRI REP Na tests were short segments refabricated from 17x17 PWR-type fuel rods irradiated under nominal PWR conditions, except the Na 2 test. REP Na-2 was a 1 m long rod base irradiated to 33 GWd/tU in the BR3 reactor. The fuel rod had a uniform 10m oxide thickness after the base irradiation. The test rod was not refabricated prior to the power pulse except to replace the internal gas pressure to 0.101 MPa.
During the CABRI transient test the rodlet was pulsed with a Gaussian-type pulse with a full-width-at-half-maximum (FWHM) of 9.6 ms and a total energy deposited into the fuel of 865 J/g at 0.4 seconds after the beginning of the pulse.
REP Na-3
The REP Na-3 rodlet was obtained from a segmented FRAGEMA low-tin cladding parent rod irradiated for 4-cycles in the Gravelines reactor to 50 GWd/tU. The 440.8 mm REP Na-3 section had a local burnup of 53.8 GWd/tU. The rodlet section had oxide thickness ranging from 35-60m over the length of the rod. The rod was refabricated from the 5th span using the FABRICE procedure (Montgomery and Rashid, 1996) (Blanc and Vouillot, 1995) and backfilled with He to 0.31 MPa.
The CABRI test characteristics are similar to REP Na-2. The pulse was Gaussian-type with a FWHM pulse width of 9.5 ms depositing 511 J/g of energy into the fuel.
REP Na-5
The REP Na-5 rodlet was obtained from rod EDF1065 which was irradiated in Gravelines for 5 cycles to a rod average burnup of 62 GWd/tU. The test rod was refabricated from a fuel segment removed from the 2nd-3rd spacer grid span. The rodlet fuel length was 563.5 mm and the oxide thickness varied between 15-25m over the length of the rodlet. The FABRICE method was used to refabricate the rod and refill the plenum to 0.302 MPa. The local average burnup of the REP Na-5 sample was 64 GWd/tU.
The rod was tested with a FWHM pulse width of 8.8 ms and depositing 435 J/g of energy into the fuel.
REP Na-10
The REP Na-10 rodlet was refabricated from a 5-cycle fuel rod in Gravelines. The local burnup of the 559 mm segment was 63 GWd/tU. The rod was taken from the 5th span of the parent rod and had approximately 60-100m of oxide with some initial spalling of the oxide. The rod was refabricated with an initial plenum gas pressure of 0.301 MPa.
The REP Na-10 pulse was a much broader pulse with a FWHM of 31 ms depositing 453 J/g of energy into the fuel. Of the four cases being simulated, REP Na-10 was the only rod that experienced failure during the test. No evidence of fuel ejection was observed and no gas bubbles were detected in the sodium channel indicating a tight crack with a slow gas leak.
Model Description
Geometry and Mesh
The rod specifications and geometry in Table 1 and FRAPCON input files (Geelhood and Luscher, 2014) were used to define the geometry for the cases. The 4 cases were modeled using a two-dimensional, axisymmetric (2D-RZ) mesh with quadratic elements. The mesh consists of 15 radial elements with 11 in the fuel and 4 in the cladding. Four axial elements were used per pellet length. Element axial lengths in the cladding were slightly longer, as required for the contact algorithm. The mesh for REP Na-3, typical for the four rods considered, is shown in Figure 1 (scaled 15x in radial direction).

Figure 1: Fuel rod mesh (scaled 15x in radial direction)
Input Files
The BISON input file and all supporting files (axial power profiles and power histories) for all four CABRI REP Na cases are provided with the code distribution at bison/assessment/LWR/validation/RIA_CABRI_REP_Na/analysis.
To avoid code repetition the input files are structured as follows: A base input file contains all characteristics common to the entire assessment. Options .i and .params files containing a variety of characteristics belonging to various rods in the assessment. The base input is not designed to run on its own as it relies on information contained in subsequent .i and .params files. To run a specific rod's assessment, check the rod's respective tests file for the files to run.
Base Irradiation Material and Behavior Models
Proper initial conditions prior to the RIA transient are very important to being able to accurately predict and analyze the results from the transient correctly. A base irradiation of the fuel was performed in BISON according to the reactor operating conditions specified in FRAPCON input files (Geelhood and Luscher, 2014). The following material and model options were used for the base irradiation for all cases:
Frictionless contact model
GasGapHeatTransfer thermal contact model with a fuel and cladding roughness of 2 and 0.5 microns, respectively
CoolantChannel model for thermal hydraulic calculations with coolant pressure, temperature and mass flux specified in the respective FRAPCON input files
The following material and behavioral models for UO fuel were used:
UO2Thermal - NFIR: temperature and burnup dependent thermal properties
ComputeFiniteStrainElasticStress: elastic mechanical behavior
ComputeIsotropicElasticityTensor: Constant values are used for the Young's modulus ( Pa) and Poisson ratio ()
UO2RelocationEigenstrain: relocation strains, relocation activation threshold power set to 5 kW/m
ComputeInstantaneousThermalExpansionFunctionEigenstrain: thermal expansion with an instanteous thermal expansion coefficient that is a function of temperature from MATPRO
UO2VolumetricSwellingEigenstrain : volumetric expansion due to solid and gaseous swelling
UO2Sifgrs: fission gas release model used with the gaseous swelling model
UO2VolumetricSwellingEigenstrain(Pastore et al., 2015)
The following material and behavioral models were used for the Zircaloy-4 cladding:
ZryThermal: Thermophysical material properties of Zircaloy.
ZryCreepLOCAUpdate: Calculates the Erbacher secondary thermal creep under loss-of-coolant accident conditions, the Limback-Andersson primary thermal creep, and the Hoope irradiation creep for Zircaloy cladding
ZryPlasticityUpdate: Computes the instantaneous plasticity of Zircaly-4 and provides cladding yield strength estimations using the EPRI model (Liu, 2015) based on a modified version of MATPRO (Siefken et al., 2001)
ZryElasticityTensor: Elastic constants specific to Zircaloy
ZryThermalExpansionMATPROEigenstrain: Computes the thermal expansion of Zircaloy with the MATPRO model
ZrPhase: Calculates the relative amounts of the and material phases present in the zircaloy
ZryOxidation: Model for waterside oxidation of Zircaloy, including oxidation in high temperature steam.
Details and references for all of these models listed above can be found on the linked BISON documentation pages.
Transient Test Material and Behavior Models
All the model and material options listed above were used during the RIA with the following exceptions:
CoolantChannel model was changed to sodium coolant with 0.5 MPa and 280C pressure and temperature conditions, and a velocityof 4 m/s
UO2RelocationEigenstrain: burnup_relocation_stop was used to specify the average burnup during the base irradiation when contact was made between the fuel and cladding. This prevents more relocation during the RIA.
UO2Sifgrs: transient_option = 1 used in this study to perform an initial assessment of this model applied to the analysis of RIAs.
ZryCreepLOCAUpdate: was disabled during the RIA due to the small time scales
Results Comparison
Without membership in the CABRI International Program there is limited acces to the CABRI REP experimental data. So to the extent possible, BISON results are compared against those CABRI REP experimental data reported in the open literature (Papin et al., 2007; Papin et al., 2003; Schmitz and Papin, 1999). To provide more detailed comparisons, BISON results are also compared against FALCON calculations for the same cases, as extracted from two EPRI reports (Montgomery and Rashid, 1996) (Montgomery and Sunderland, 2003).
REP Na-2
Table 2: BISON calculations compared against FALCON calculations and experimental/reported values found in literature for REP Na-2.
| Property | BISON | FALCON | Experimental Reported Values | Difference (FALCON) | Difference (Experimental) |
|---|---|---|---|---|---|
| Energy Deposition (cal/g) | 205 | - | 207 | - | -1.0 |
| Peak Fuel Enthalpy (cal/g) | 217 | 200 | 199 | 8.7 | 9.2 |
| Max Fuel Temperature (K) | 3024 | 2948 | - | 2.6 | - |
| Max Fuel Centerline Temp. (K) | 2707 | 2775 | - | -2.5 | - |
| Clad Max Inside Temp. (K) | 1036 | 1020 | - | 1.6 | - |
| Max Hoop Strain (%) | 1.36 | 2.60 | 3.5 | -48 | -61 |
| Residual Hoop Strain (%) | 0.46 | 2.20 | - | -79 | - |
| Max Clad Radial Disp. (m) | 64 | 135 | - | -53 | - |
| Clad Radial Disp. Residual (m) | 21 | 102 | 135 | -79 | -78 |
| Fission Gas Released (%) | 7.1 | - | 5.5 | - | 29 |
| Corrosion thickness (m) | 5 | - | 4-10 | - | - |
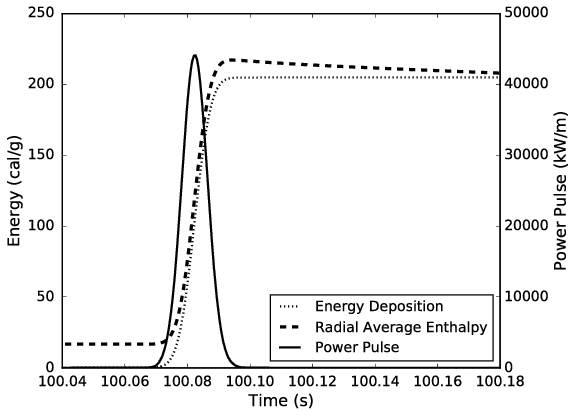
Figure 2: BISON power pulse, energy deposited and computed radial averaged fuel enthalpy at PPN for REP Na-2 case
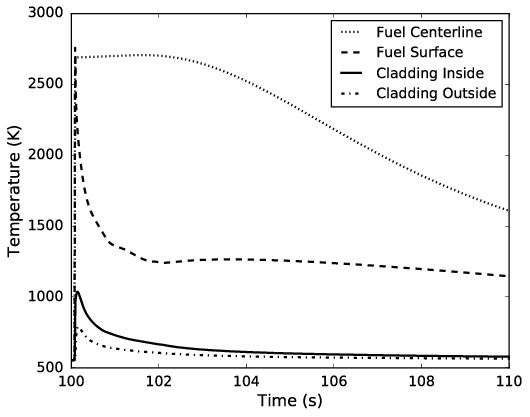
Figure 3: Fuel and cladding temperature profiles at PPN for the REP Na-2 case
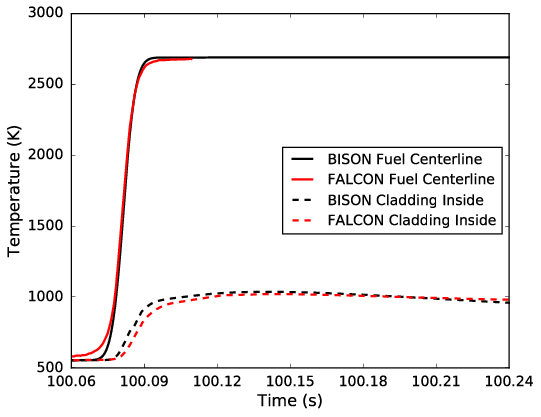
Figure 4: Fuel centerline and cladding inside temperature at PPN comparisons with FALCON
REP Na-2 was base irradiated to an average burnup of 33 GWd/tU and had an initial enrichment of 6.85% which allowed for higher energy depositions than the other cases. The energy deposited into the fuel during the RIA CABRI test was reported as 866 J/g (207 cal/g). Assuming a Gaussian-type pulse with a FWHM of 9.6 ms resulted in 205 cal/g of energy injected into the fuel at the peak power node (PPN) in BISON. The calculated maximum change in radial averaged fuel enthalpy from 20C is 217 cal/g compared to 200 cal/g calculated by FALCON and 199 cal/g reported by IRSN. The BISON power pulse, energy injected, and radial averaged enthalpy are plotted in Figure 2 (Note: unless otherwise stated all BISON data reported or plotted is at the PPN).
The fuel and cladding temperature histories are plotted in Figure 3 with comparison between FALCON results for the fuel centerline and cladding inner temperature in Figure 4. A complete list of the BISON results compared against FALCON calculations and experimental/reported values from IRSN found in literature is shown in Table 2. BISON is able to predict thermal results very well when compared against FALCON or the reported values. All temperature predictions are within 3% of values computed by FALCON and the peak fuel radial average enthalpy is within 10% of FALCON and reported values.
Although thermal behavior is well-predicted by BISON, mechanical results deviate significantly from both FALCON calculations and measured values. As shown in Table 2, BISON predicts less than half the residual cladding radial displacement and hoop strain as compared to FALCON and measured values. BISON and FALCON outer cladding surface hoop strain histories are shown in Figure 5. Post-test measurements of the cladding diameter compared against BISON calculations are shown in Figure 6 (Schmitz and Papin, 1999). The oscillations in the post-test measurements are due cladding ridging at the pellet-pellet interfaces, which are not seen in the BISON results due to the smeared fuel approximation. It should also be noted that due to the temporary frictionless contact restriction, axial elongation comparisons will not be made at this time. Without frictional contact we expect significant discrepancies to FALCON or experimental results.
There are a number of postulated reasons for the discrepancies in the mechanical results. As previously stated, the frictionless contact option greatly impacts the axial displacement predictions but it also influences the plastic hoop strain estimation in BISON. The plasticity model in BISON compares the von Mises stress against the cladding yield stress; without friction the axial stress component is negligible resulting in lower von Mises stress and less plastic strain accumulation. Another important factor that has a significant impact on the cladding stress and strain state is the initial fuel-to-clad gap width prior to the RIA (OECDNEA, 2016). BISON calculates this gap from the base-irradiation simulation used to provide the initial fuel rod state prior to the RIA, whereas FALCON and SCANAIR begin with no initial fuel-to-cladding gap.
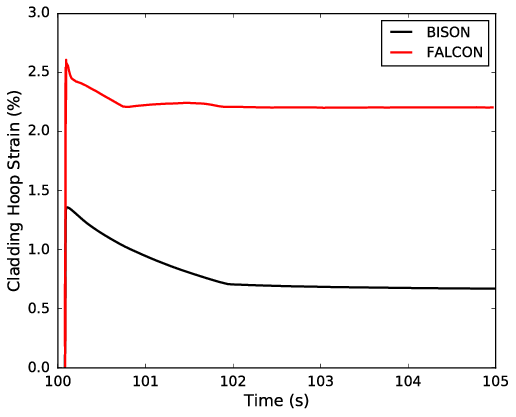
Figure 5: Cladding hoop strain evolutions at PPN for BISON and FALCON
The predictions for the fission gas release (FGR) during the transient are very promising. BISON predicted a final FGR of 7.1% compared to the measured value of 5.5%. A plot of the FGR is shown in Figure 7 along with the fuel centerline temperature plotted on the right ordinate. The inset shows the FGR and fuel temperature during the time period of the pulse. The initial large increase in FGR is highly correlated to the fast increase in fuel temperature. Fission gas release and gaseous swelling are computed by a physics-based model from Pastore et al. (Pastore et al., 2013) (Pastore et al., 2015). This model also captures the rapid FGR (burst release) during transients, which is interpreted as driven by fuel micro-cracking (Pastore et al., 2014) (Barani et al., 2017). Micro-cracking during RIA transients has been observed experimentally (e.g., (Nakamura et al., 1996)) and may account for the majority of FGR during a RIA, where the high FGR observed (5-20%, approximately) cannot be interpreted as diffusion-based in view of the short time scale of the event. Note that traditional FGR models typically only account for diffusion-based FGR and will thus tend to strongly underpredict FGR during the short duration of a RIA event. This is demonstrated by comparison with the results from a purely diffusion based model that differs from the complete BISON model only in that the specific transient (micro-cracking) capability is deactivated. This is shown in Figure 7 with no burst release due to micro-cracking. In this case the FGR still increases due to diffusion-based FGR because of the very high temperatures in the fuel reaching between 2700-3000 K. Hence, the recently developed transient release capability of the BISON model may represent an important step towards better capturing FGR during RIAs.
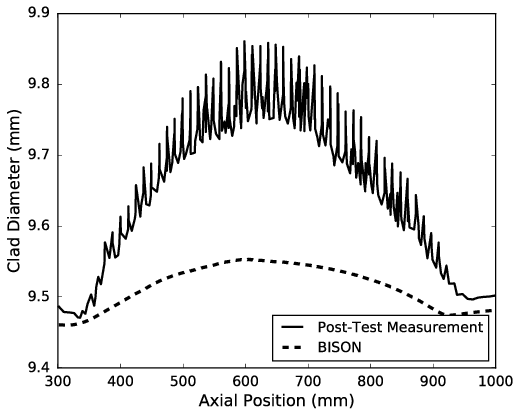
Figure 6: Residual outer cladding diameter calculations from BISON compared against Post-Test measurements.
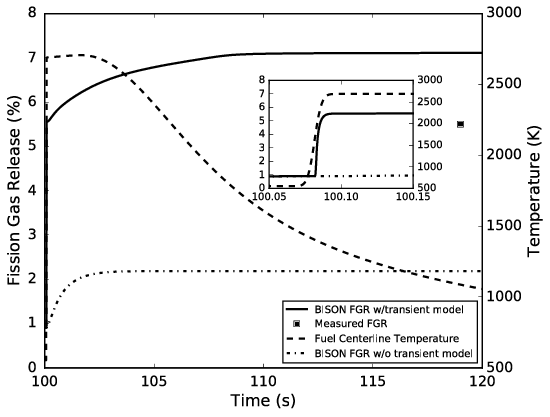
Figure 7: Fission gas release plotted with the measured post-test value at 5.5% for REP Na-2. The Inset shows a shorter time scale of the FGR plotted with the fuel centerline temperature (K) showing the high fission gas release rate correlates to the fast increase in temperature.
REP Na-3
Table 3: BISON calculations at PPN compared against FALCON calculations and experimental/reported values found in literature for REP Na-3.
| Property | BISON | FALCON | Experimental Reported Values | Difference (FALCON) | Difference (Experimental) |
|---|---|---|---|---|---|
| Energy Deposition (cal/g) | 117 | - | 122 | - | -4 |
| Peak Fuel Enthalpy (cal/g) | 144 | 118 | 124 | 22 | 16 |
| Max Fuel Temperature (K) | 2527 | 2480 | - | 1.9 | - |
| Max Fuel Centerline Temp. (K) | 1963 | 1960 | - | .2 | - |
| Clad Max Inside Temp. (K) | 1011 | 935 | - | 8.1 | - |
| Max Hoop Strain (%) | 1.19 | 1.5 | 2.2 | -21 | -46 |
| Residual Hoop Strain (%) | 0.40 | 1.10 | - | -64 | - |
| Max Clad Radial Disp. (m) | 56 | 81 | - | -31 | - |
| Clad Radial Disp. Residual (m) | 19 | 51 | 55 | -63 | -65 |
| Fission Gas Released (%) | 10.4 | - | 13.7 | - | -24 |
| Corrosion thickness (m) | 53 | - | 35-60 | - | - |
The REP Na-3 test rod was base irradiated to a burnup of 53 GWd/tU and tested in CABRI with 9.5 ms FWHM pulse targeting 490 J/g (117 cal/g). The maximum change in fuel radial averaged enthalpy at the PPN in BISON was 144 cal/g compared to 118 cal/g calculated in FALCON and 124 cal/g reported by IRSN. The Gaussian-type power pulse with the energy injected and radially averaged enthalpy are plotted in Figure 8 with all the results from literature tabulated in Table 3. BISON over estimates the radial averaged enthalpy by 10-15% in this case compared to the reported values and FALCON.
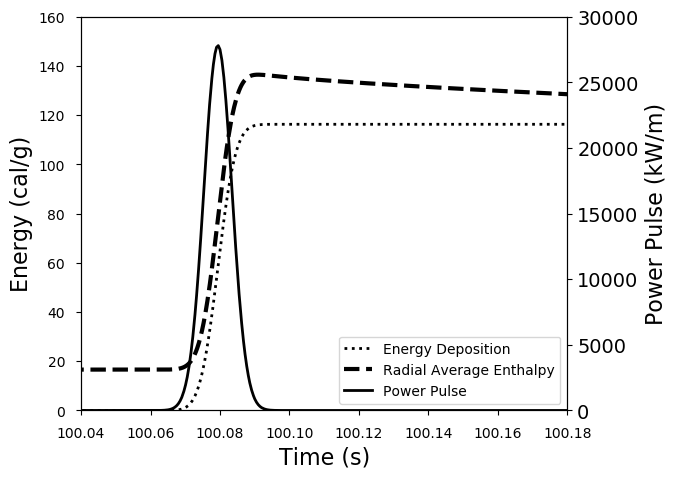
Figure 8: Power pulse, energy deposition and radial averaged fuel enthalpy at PPN for REP Na-3 case
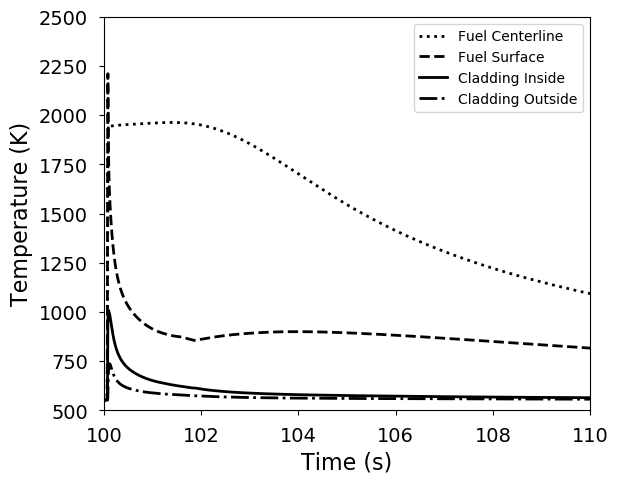
Figure 9: Fuel and cladding temperature histories at PPN for the REP Na-3 case
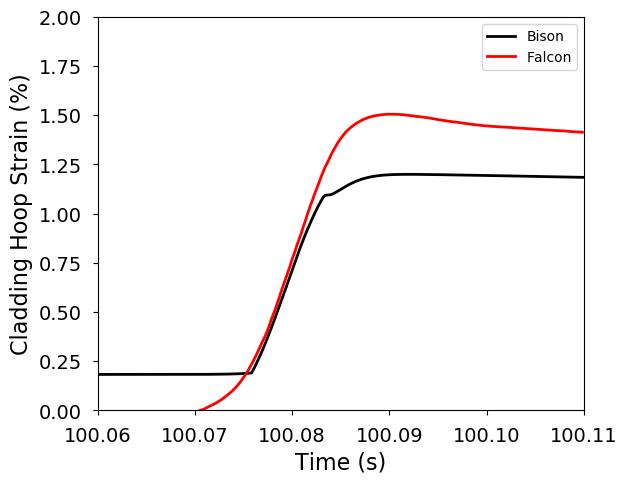
Figure 10: BISON and FALCON calculated cladding hoop strain evolutions at PPN
The computed fuel centerline, fuel surface, cladding inside, and cladding outer surface temperature histories are plotted in Figure 9. The fuel centerline reaches a maximum temperature of just above 1900 K and the maximum temperature in the fuel reaches 2500 K which occurs a few microns in from the fuel surface due to the high burnup rim effect. The pellet surface achieves a maximum temperature of 2211 K. The temperature calculations by BISON agree very well, within 8% of the FALCON calculations.
BISON has again shown to do very well in predicting the temperatures in the fuel and the cladding for this case. The fuel enthalpy BISON calculated was 22% higher than calculated by FALCON even though the fuel centerline temperature differed by less. The higher radial averaged fuel enthalpy calculation in BISON is likely due to a different fuel radial power profile in BISON resulting in more energy deposited into the rim region and thus higher fuel temperatures.
The cladding hoop strain calculations by BISON are again under-predicted compared to the results from FALCON and experimental data reported by IRSN. The cladding hoop strain evolution compared against FALCON is plotted in Figure 10. The maximum values are approximately 21% less than FALCON and almost half the measured values. The residual hoop strain calculation in BISON is less than half the FALCON calculation which means BISON is not estimating the amount of plastic deformation correctly. The residual cladding displacement is plotted with the FALCON results and the post-test measurements in Figure 11.
The fission gas release progression with and without the transient model is plotted in Figure 12 with the fuel centerline temperature. BISON calculated a final fission gas release of 10.4% compared to the measured 13.7%. Figure 12 shows the influence of the burst release component in the BISON fission gas release model for the transient. During the initial temperature increase in the fuel, the fission gas release increases from just under 2% (the end result from the base irradiation) to 5.5% in approximately 10 ms. The fission gas release continues to increase over the next 4 seconds likely due to a combination of increased diffusion from the elevated fuel temperatures and the transient burst release model. In contrast, the FGR without the transient model shows very small increase throughout the simulation. The diffusion-based contribution is much smaller in this case than in Figure 7 because the fuel temperatures are much lower during this transient.

Figure 11: Residual cladding displacement calculations for BISON and FALCON against post-test measurement.
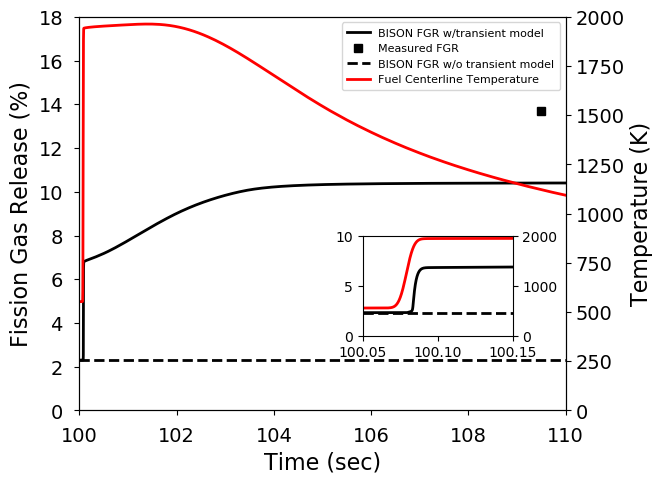
Figure 12: Fission gas release plotted with fuel centerline temperature and measured post-test result for REP Na-3
REP Na-5
Table 4: BISON calculations compared against FALCON calculations and experimental/reported values found in literature for REP Na-5.
| Property | BISON | FALCON | Experimental Reported Values | Difference (FALCON) | Difference (Experimental) |
|---|---|---|---|---|---|
| Energy Deposition (cal/g) | 99.4 | 112 | 104 | -11 | -5 |
| Peak Fuel Enthalpy (cal/g) | 124 | 115 | 108 | 7.8 | 14.8 |
| Max Fuel Temperature (K) | 2294 | 2387 | - | 3.9 | - |
| Max Fuel Centerline Temp. (K) | 1768 | 1757 | - | -.6 | - |
| Clad Max Inside Temp. (K) | 1073 | 1020 | - | 5.2 | - |
| Max Hoop Strain (%) | 1.35 | 1.21 | 1.1 | 11.6 | 23 |
| Residual Hoop Strain (%) | 0.38 | 0.85 | - | -55 | - |
| Peak Cladding Hoop Stress (MPa) | 638 | 867 | - | -26 | - |
| Fission Gas Released (%) | 6.5 | - | 15.1 | - | -57 |
| Corrosion thickness (m) | 20 | - | 15-25 | - | - |
REP Na-5 was base irradiated during 5 cycles to a local rodlet burnup of 64 GWd/tU. The CABRI test targeted an energy deposition of 415 J/g (99.4 cal/g) during an 8.8 ms FWHM pulse. Even with the high burnup of the REP Na-5 rodlet the oxidation thickness only varied between 15-25 microns because it was taken from between the 2nd and 3rd spacers from the parent rod. The energy deposited into the rodlet was reported as 104 cal/g from the IRSN and 112 cal/g at 1.2 seconds for FALCON. FALCON also reported that the energy deposition was 105 cal/g up through 0.4 seconds. The resulting max increase in radial averaged enthalpy calculated in BISON was 124 cal/g compared to 115 cal/g from FALCON and 108 cal/g reported from IRSN. These results are plotted in Figure 13 and tabulated in Table 4.
A more detailed comparison with FALCON shows the time progression of the injected energy and radial average enthalpy in Figure 14. The data available from the FALCON results is limited out to 120 ms after the start of the transient but up to that time the results between BISON and FALCON show very good agreement.
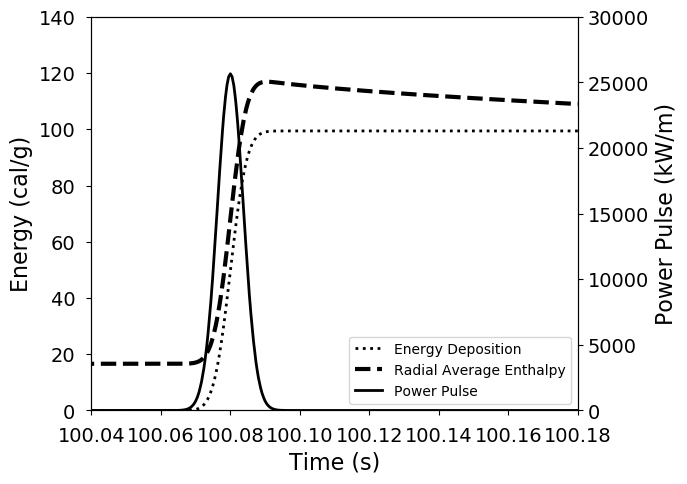
Figure 13: Power pulse, energy deposited and radial averaged fuel enthalpy at PPN for REP Na-5 case
Figure 14: Injected energy and radial averaged enthalpy at PPN comparisons between BISON and Falcon for REP Na-5
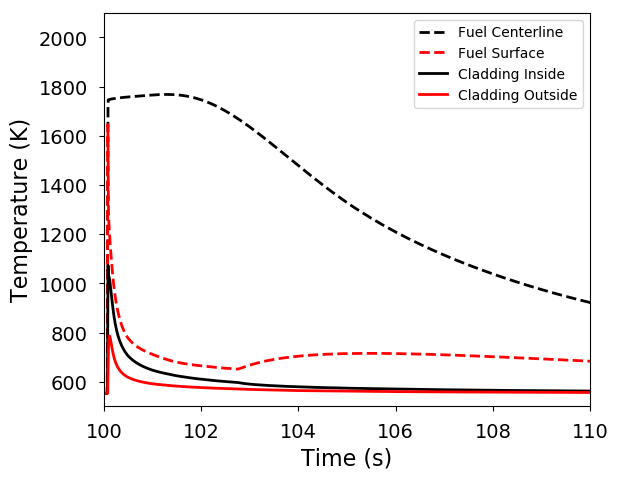
Figure 15: Fuel and cladding temperature histories at PPN for REP Na-5
The temperature histories for the fuel and cladding are plotted in Figure 15 with the maximum reported values for the fuel and cladding shown in Table 4. The cladding inside and outside temperatures for BISON and FALCON are plotted in Figure 16. The results here again show very good agreement between the two codes for temperature predictions.
The cladding outer surface hoop strain is shown in Figure 17. BISON shows a very good agreement with FALCON on the total hoop strain during the transient, 1.35% compared to 1.21%. Even though the total amount of hoop strain predicted by BISON is much closer to FALCON for this case, the residual hoop strain is still under predicted. FALCON calculates a residual cladding hoop strain of 0.85% compared to BISON with a prediction of 0.38% at the PPN.
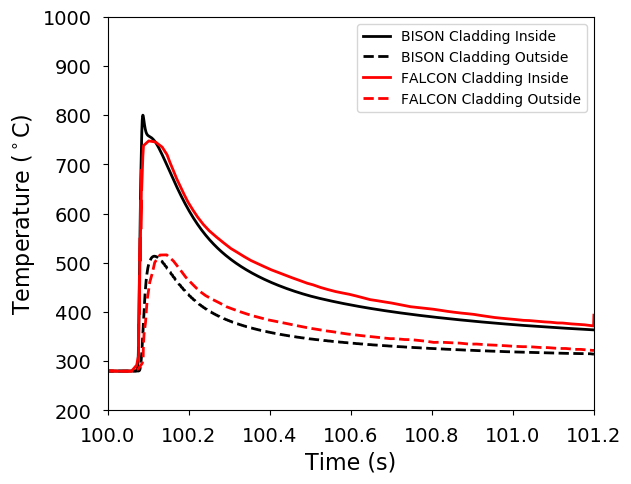
Figure 16: Cladding temperature at PPN comparisons between BISON and FALCON for REP Na-5

Figure 17: Cladding hoop strain at PPN comparisons between BISON and FALCON for REP Na-5
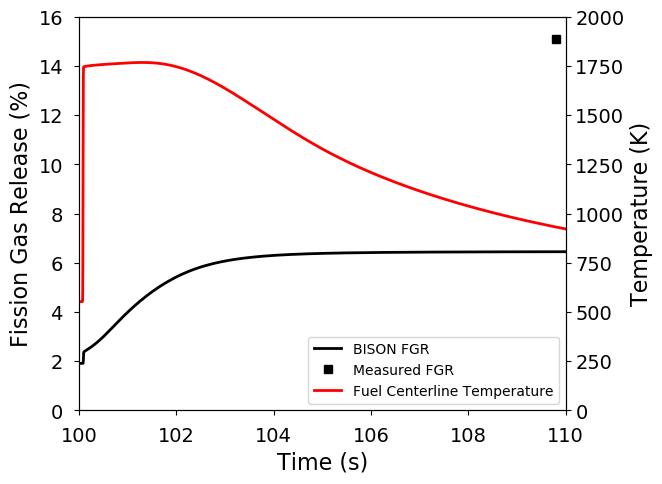
Figure 18: Fission gas release plotted with fuel centerline temperature and the measured post-test result for REP Na-5
The fission gas release prediction for BISON was 6.5% at the conclusion of the test compared to the measured 15.1% post-test measurement. During this test the initial burst release was much less than the previous two cases, from 1.6% to 1.9% during the initial temperature rise in the fuel (Figure 18). The majority of the fission gas was released when the fuel centerline temperature was around its maximum of approximately 1750 K.
REP Na-10
The REP Na-10 rodlet was irradiated to 63 GWd/tU with an oxide thickness ranging from 60-100 m. The CABRI test targeted 453 J/g (108.3 cal/g) of energy deposited into the fuel in a 31 ms FWHM pulse. During the test the microphones in the test capsule detected a strong signal indicating that cladding failure had occurred. The microphones detected that the failure originated at an axial location 255 mm from the bottom of the fuel column. The injected energy at time of failure was 75 cal/g at the PPN and 74 cal/g at the location of failure. There was no indication of fuel ejection during the remaining 30 cal/g of energy injection.
BISON does not currently have a failure model for RIA type accidents so the results presented are assuming no failure in the rodlet and as a result there are no comparisons to experimental measurements for this test. The BISON simulation resulted in 109 cal/g of energy deposited into the rodlet compared to 103 cal/g in FALCON and 108 cal/g reported by IRSN. The resulting calculated maximum increase in radial average fuel enthalpy was 118 cal/g in BISON, 109 cal/g in FALCON and a reported value of 98 cal/g by IRSN. These values result in an 8% difference between BISON and FALCON and a 20% difference from the reported value. All these values are shown in the table below. A more detailed comparison of the injected energy and radial average enthalpy between BISON and FALCON is shown in Figure 20. The profiles are very similar with the BISON results predicting slightly higher results than FALCON. These results would be much closer if the energy injected was the same. The pulse in BISON was targeted to deposit 108 cal/g of energy into the fuel at the PPN. If this value was scaled back to match the 103 cal/g in FALCON the results would be closer.
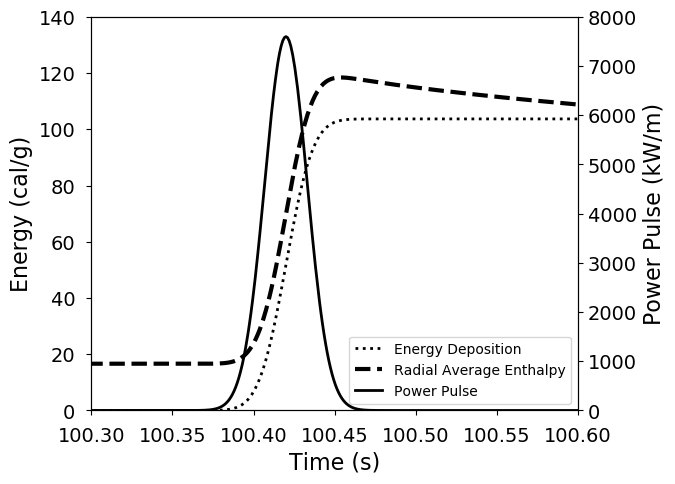
Figure 19: Power pulse, energy deposited and radial averaged fuel enthalpy at PPN for REP Na-10 case
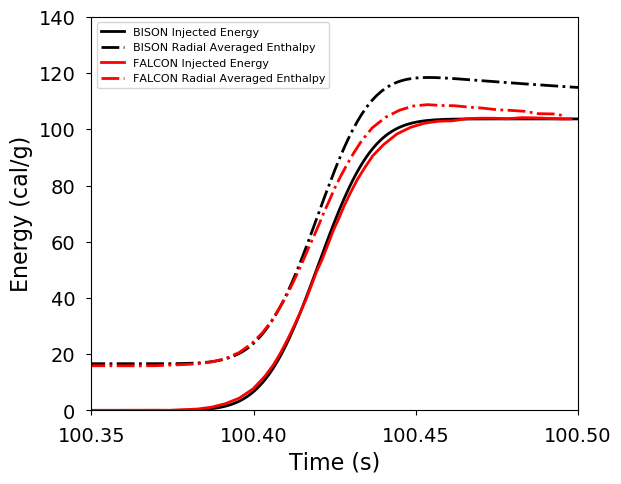
Figure 20: Injected energy and radial averaged enthalpy at PPN comparisons between BISON and Falcon for REP Na-10
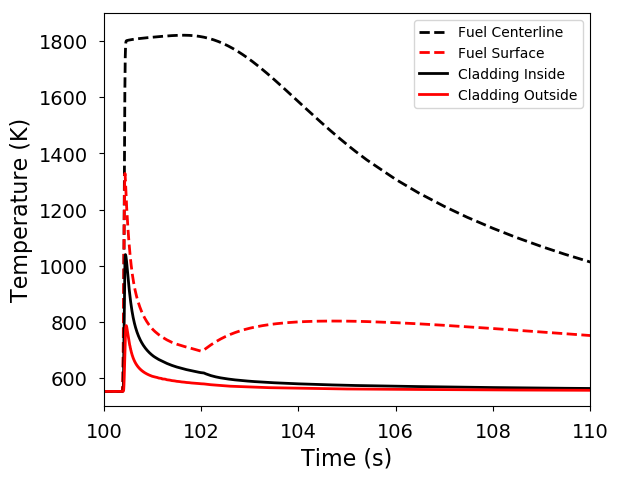
Figure 21: Fuel and cladding temperature evolutions at PPN for REP Na-10
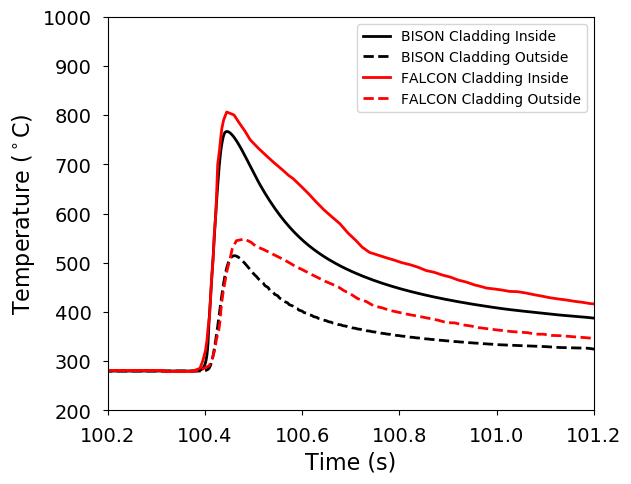
Figure 22: Cladding temperature at PPN comparisons between BISON and FALCON for REP Na-10
The fuel and cladding temperature profiles are plotted together in Figure 21. An interesting observation comparing Figure 21 and Figure 15 is the much lower fuel surface temperature in the REP Na-10 case. The maximum fuel temperature is still greater than the fuel centerline temperature and that happens just inside the fuel surface, but due to the much longer pulse in REP Na-10 the fuel surface temperature does not exceed the centerline temperature. Figure 22 shows a more detailed comparison of the cladding temperature histories between BISON and FALCON with good agreements between the two codes.
There are no measured mechanical results available, but for this case BISON again predicts a higher cladding hoop strain than FALCON, 1.19% compared to 1.0%. The residual hoop strains are under predicted indicating a slight difference in the calculated plastic strain between the two codes. The two codes show good agreement on the maximum cladding hoop stress calculated. BISON predicts 656 MPa versus 773 MPa for FALCON, only 15% difference.
Since the fuel rod failed there is no experimental results for fission gas release to compare to, but BISON predicted a 6.6% fission gas release at the end of the transient. The fission gas release looked very similar to REP Na-5 (Figure 18) with a very small increase during the initial fuel temperature increase.
Table 5: BISON calculations compared against FALCON calculations and experimental/reported values found in literature for REP Na-10.
| Property | BISON | FALCON | Experimental Reported Values | Difference (FALCON) | Difference (Experimental) |
|---|---|---|---|---|---|
| Energy Deposition (cal/g) | 104 | 103 | 108 | 1 | -3.7 |
| Peak Fuel Enthalpy (cal/g) | 126 | 109 | 98 | 16 | 29 |
| Max Fuel Temperature (K) | 2100 | 2046 | - | 2.6 | - |
| Max Fuel Centerline Temp. (K) | 1820 | 1662 | - | 9.5 | - |
| Clad Max Inside Temp. (K) | 1040 | 1080 | - | -3.7 | - |
| Max Hoop Strain (%) | 1.17 | 1.00 | - | 17 | - |
| Residual Hoop Strain (%) | 0.41 | 0.73 | - | -44 | - |
| Peak Cladding Hoop Stress (MPa) | 625 | 773 | - | -19 | - |
| Fission Gas Released (%) | 6.6 | - | Rod burst | - | - |
| Corrosion thickness (m) | 89 | - | 60-100 | - | - |
Discussion
There are several observations that can be made on the results presented above for the CABRI REP Na cases for RIA validation.
BISON tends to slightly over predict the estimated fuel radial average enthalpy compared to FALCON and the reported values (predicted using SCANAIR). The results typically compare within 10% of FALCON and reported values, with slightly higher differences for REP Na-3 FALCON and REP Na-10 SCANAIR results.
BISON agrees very well with FALCON on the temperature predictions. The maximum fuel temperature (located in the high burnup rim region) and the maximum temperatures calculated for the fuel centerline and cladding inside temperatures were all within 10% of FALCON, with many of the results well within 5%.
In general the mechanical results do not show similar close agreement with FALCON or measured values. BISON generally under predicts the max hoop strain in the cladding outer surface. The max hoop strain results look reasonable for REP Na-5 and 10, but generally the strains reported are referenced from cold zero power conditions prior to the transient. This removes any accumulated plastic or creep strain from the base irradiation. The results presented for BISON are the absolute strains and this can be seen in Figure 10 and Figure 17 where the BISON results do not start from zero as the FALCON results do. Referencing these results from zero would result in an even greater under-prediction, but these results show the absolute strain because it was not explicitly stated whether the FALCON or measured results are referenced to a pre-RIA condition.
Similar to the total hoop strain in the cladding the plastic strain accumulation is also under predicted. This is evident in Figures Figure 6 and Figure 11 showing the residual displacement or clad diameter and in Table 2 through the table above.
The fission gas release calculations show good agreement with measured values, with only REP Na-5 showing a sizable difference.
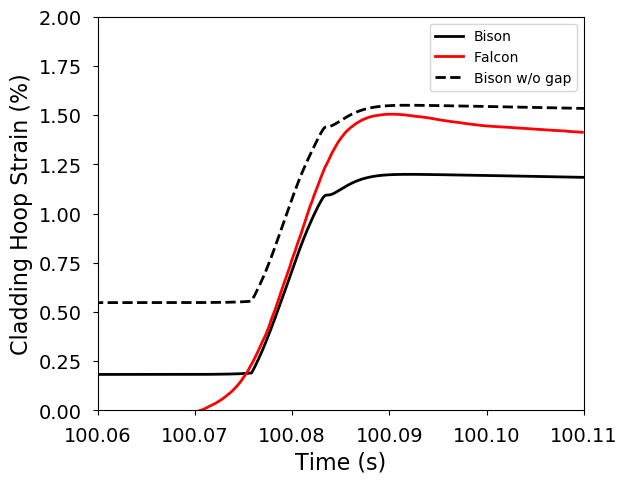
Figure 23: BISON and FALCON calculated cladding hoop strain evolutions at PPN with the estimated BISON results assuming no initial fuel-to-cladding gap
Based on the results presented so far for the CABRI REP Na RIA cases the results show promise with the thermal predictions but improvements can be made in regards to the mechanical results. There are a lot of important details concerning the FALCON modeling procedure and results that are not known and many assumptions are made during the comparison. For example the FALCON and reported values for fuel radial averaged enthalpy do not specify if these are results at the peak power node or rod averaged. It is assumed the results are for the PPN; the BISON results are at the PPN.
The post base-irradiation conditions have a significant impact on the mechanical results. One of the most significant initial conditions prior to the RIA test is the fuel-to-clad gap distance. In all cases the BISON base-irradiation calculation predicted fuel-to-clad gaps of 14.9-17.5 m at CZP conditions after the base irradiation. Those gaps were reduced to between 9.6-14 m at HZP conditions prior to the transient. All these cases were for high-burnup fuel (excluding REP Na-2) which should result in a closed or very small gap after the base-irradiation. In a recent study benchmarking BISON and SCANAIR calculations against the CIP0-1 rodlet RIA test, a micrograph of a high-burnup fuel rod clearly shows fuel-zirconia bonding (Figure 3 in (Georgenthum et al., 2017)). In that study the SCANAIR simulation assumed a closed gap, as the micrograph indicated, prior to the RIA pulse while the BISON simulation began with a 14 m gap. The resulting under-estimated strains are similar to those observed in this study. As a thought project, assuming no initial gap on REP Na-3, hand calculations were performed on the results from the cladding hoop strain (Figure 10) to add the 16.4 m gap to the displacement thus estimating the resulting total hoop strain. The results are shown in Figure 23 and the magnitude of the results compare much better to the FALCON results.
Recommended Future Work
There is a lot of work to be improved upon with regards to the RIA validation modeling. Some of the improvements include:
Frictional contact will improve axial displacement predictions that can be compared against experimental results and FALCON calculations. Frictional contact will also improve plastic strain predictions in the cladding.
Discrete pellet mesh will provide more prototypic results and better comparisons to measured data such as in Figure 6
Including fuel creep and cracking during the base irradiation
Fuel-clad bonding occurs with high-burnup cases and results in a much different estimation of the fuel-to-cladding gap after the base irradiation. During cold zero power conditions this could likely result in a closed gap between the fuel outer surface and the cladding inner surface with gaps opening up inside the fuel cracks. Understanding and accounting for this could likely have a big impact on the estimation of pellet-clad-mechanical-interactions during RIAs and other transient events.
Implement a failure model for RIA applications to predict when failure occurs during fast transients such as RIAs
References
- T. Barani, E. Bruschi, D. Pizzocri, G. Pastore, P. Van Uffelen, R.L. Williamson, and L. Luzzi.
Analysis of transient fission gas behaviour in oxide fuel using \mbox BISON and \mbox TRANSURANUS.
Journal of Nuclear Materials, 486:96–110, 2017.[BibTeX]
- J. Y. Blanc and M. Vouillot.
Presentation of the fabrice process and refabrication experience up to 1994.
Technical Report IAEA-TECDOC-822, International Atomic Energy Agency, 1995.[BibTeX]
- K. J. Geelhood and W. Luscher.
FRAPTRAN-1.5: integral Assessment.
Technical Report NUREG/CR-7023 Vol.2, Rev.1, U.S. Nuclear Regulatory Commission, 2014.[BibTeX]
- V. Georgenthum, C. Folsom, A. Moal, O. Marchand, R. Williamson, H. Ban, and D. Wachs.
SCANAIR-BISON benchmark on CIP0-1 RIA test.
In to be published in 2017 Water Reactor Fuel Performance Meeting. Jeju Island, Korea, September 10–14, 2017.[BibTeX]
- W. Liu.
Zirconium alloy clad yield stress model in bison-casl code.
Technical Report ANA-P1400138-TN02 Rev.1, ANATECH Corp., December 2015.[BibTeX]
- R. Montgomery and D. Sunderland.
Analysis of reactivity initiated accident-simulation tests conducted at the CABRI and NSRR facilities in france and japan.
Technical Report 1002863, Electric Power Research Institute, December 2003.[BibTeX]
- R. O. Montgomery and Y. R. Rashid.
Evaluation of irradiated fuel during RIA simulation tests.
Technical Report TR-106387, Electric Power Research Institute, August 1996.[BibTeX]
- T. Nakamura, H. Sasajima, T. Fuketa, and K. Ishijima.
Fission gas induced cladding deformation of lwr fuel rods under reactivity initiated accident conditions.
Journal of Nuclear Science and Technology, 33(12):924–935, 1996.
doi:10.1080/18811248.1996.9732034.[BibTeX]
- OECDNEA.
Reactivity Initiated Accident (RIA) Fuel Codes Benchmark Phase-II Report-Volume 1: Simplified Cases Results, Summary and Analysis.
Technical Report NEA/CSNI/R(2016)6, OECD/NEA, 2016.[BibTeX]
- J. Papin, B. Cazalis, J. Frizonnet, J. Desquines, F. Lemoine, V. Georgenthum, F. Lamare, and M. Petit.
Summary and interpretation of the CABRI REP-Na program.
Nuclear Technology, 157(3):230–250, 2007.
doi:10.13182/NT07-A3815.[BibTeX]
- J. Papin, B. Cazalis, J. Frizonnet, E. Federici, and F. Lemoine.
Synthesis of CABRI-RIA tests interpretation.
In Eurosafe Meeting 2003. Paris, France, 2003.[BibTeX]
- G. Pastore, L. Luzzi, V. Di Marcello, and P. Van Uffelen.
Physics-based modelling of fission gas swelling and release in UO$_2$ applied to integral fuel rod analysis.
Nuclear Engineering and Design, 256:75–86, 2013.[BibTeX]
- G. Pastore, D. Pizzocri, J. D. Hales, S. R. Novascone, D. M. Perez, B. W. Spencer, R. L. Williamson, P. Van Uffelen, and L. Luzzi.
Modeling of transient fission gas behavior in oxide fuel and application to the BISON code.
In Enlarged Halden Programme Group Meeting. Røros, Norway, September 7–12, 2014.[BibTeX]
- G. Pastore, L.P. Swiler, J.D. Hales, S.R. Novascone, D.M. Perez, B.W. Spencer, L. Luzzi, P. Van Uffelen, and R.L. Williamson.
Uncertainty and sensitivity analysis of fission gas behavior in engineering-scale fuel modeling.
Journal of Nuclear Materials, 465:398–408, 2015.[BibTeX]
- Y Rashid, R Dunham, and R Montgomery.
Fuel Analysis and Licensing Code: FALCON MOD01.
Technical Report, Electric Power Research Institute, December 2004.[BibTeX]
- Franz Schmitz and Joelle Papin.
High burnup effects on fuel behaviour under accident conditions: the tests CABRI REP-Na.
Journal of Nuclear Materials, 270(1):55–64, 1999.
doi:10.1016/S0022-3115(98)00895-2.[BibTeX]
- LJ Siefken, EW Coryell, EA Harvego, and JK Hohorst.
SCDAP/RELAP5/MOD3.3 Code Manual: MATPRO-A Library of Materials Properties for Light-Water-Reactor Accident Analysis.
Technical Report NUREG/CR-6150, Vol.4, Rev.2, U.S. Nuclear Regulatory Commission, 2001.[BibTeX]