LOCA IFA-650.2
Overview
LOCA tests at Halden (IFA-650 series) are integral in-pile single rod tests. The second trial test run IFA-650.2 (Ek, 2005) was performed in May 2004.
Test Description
Rod Design Specifications
The test was carried out using a fresh, pressurized PWR rod and low fission power to achieve the desired temperature conditions. The rod plenum volume was made relatively large to be able to maintain stable pressure conditions during ballooning. The fabrication characteristics of the IFA-650.2 fuel rod are reported in Table 1.
Table 1: Design data of IFA-650.2 fuel rod (Ek, 2005)
| Fuel material | UO | |
| Fuel density | 95.0 | %TD |
| U enrichment | 2.0 | wt% |
| Active stack length | 500 | mm |
| Pellet OD | 8.29 | mm |
| Pellet ID | 0 | mm |
| Cladding material | Zy-4 | |
| Cladding ID | 8.36 | mm |
| Cladding OD | 9.50 | mm |
| Diametral gap | 70 | m |
| Free volume | 17.4 | cm |
| Fill gas | He | |
| Fill gas pressure | 4.0 | MPa |
Operating Conditions and Irradiation History
The fuel rod was located in a standard high-pressure flask in the IFA-650 test rig in the Halden reactor. A heater surrounding the rod was used to simulate the heat from adjacent rods. The flask was connected to a high-pressure heavy water loop and a blowdown system. During normal operation prior to the LOCA test, the rig was connected to the loop and forced circulation flow conditions existed. Then, the rig was disconnected. A natural convection phase began, with water flowing up between the fuel rod and flow separator (with heater) and down between flow separator and flask wall. Full pressure still existed in the rig. LOCA was initiated by opening the valves leading to the blowdown tank (blowdown phase). The initial pressure in the loop was 7 MPa and the counterpressure in the blowdown tank was 0.2 MPa. The channel pressure decreased to 3-4 bars, and the rig was practically emptied of water within 30-40 seconds. Stagnant superheated steam surrounding the rod provided inadequate cooling and the cladding temperature increased quickly (heat-up phase). A low fission power of 2.3 kW/m was used to simulate decay heat and achieve the desired temperature conditions. Cladding ballooning and rupture occurred during the heat up phase (burst at 800C). Spray injection was started when the cladding temperature reached approximately 870C, with the purpose to ensure enough steam for the oxidation process of the cladding. The target cladding temperature of 1050C was reached and held for 264 seconds. The test was ended by a reactor scram.
The Halden IFA-650.2 test was selected for comparative fuel performance modelling in the IAEA FUMEX-III Project (IAEA, 2008-2012) and is being considered also within the IAEA FUMAC Project on Fuel Modelling under Accident Conditions (Zhang and Veshchunov, 2016).
Model Description
Geometry and Mesh
The rod geometry was modeled following the design specifications from (Ek, 2005) (Table 1). The enriched fuel pellet column was represeted with a smeared fuel column. Natural UO pellets at the top and bottom of the fuel stack were also included. A single rod upper plenum was considered, whose volume is the sum of the various plenum volumes in the more complex real geometry (Ek, 2005). A 2-dimensional axi-symmetric quadratic (Quad8 elements) finite element mesh was used. The enriched fuel column mesh consisted of 6 radial elements and 62 axial elements. Each natural UO pellet mesh consisted of 6 radial elements and 1 axial element. The cladding mesh consisted of 256 axial elements and 3 radial elements. Figure 1 shows the finite element mesh used for the BISON anaysis of the IFA-650.2 fuel rod.
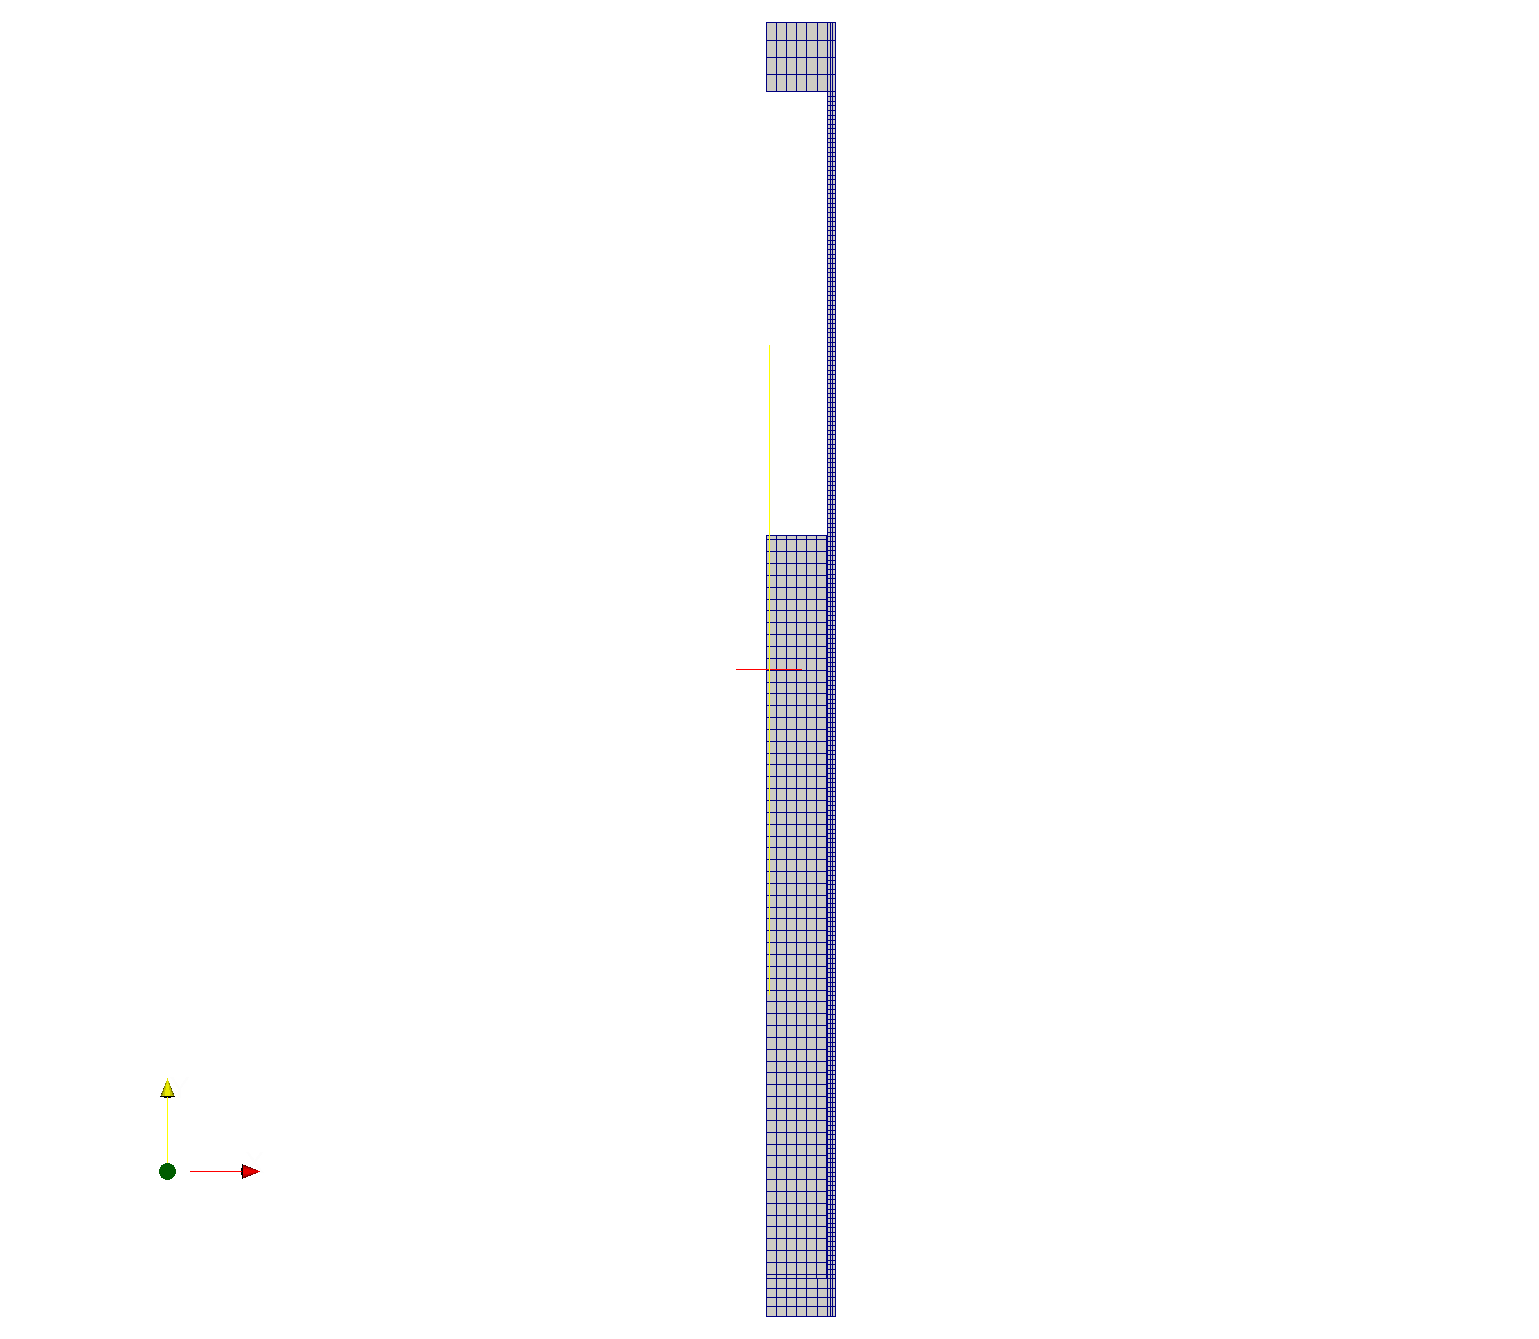
Figure 1: Finite element mesh for the IFA-650.2 fuel rod. The figure is scaled 10 times in the radial direction for visualization.
Material and Behavioral Models
The following material and behavioral models were used for the UO fuel:
UO2Thermal - NFIR: temperature and burnup dependent thermal properties
ComputeFiniteStrainElasticStress and UO2ElasticityTensor: elastic mechanical behavior
UO2RelocationEigenstrain: relocation strains, relocation activation threshold power set to 5 kW/m
ComputeThermalExpansionEigenstrain: thermal expansion with a constant instantaneous thermal expansion coefficient
UO2VolumetricSwellingEigenstrain: volumetric expansion due to solid and gaseous swelling
UO2Sifgrs: fission gas release model with the combined gaseous swelling model.
The following models were used for the Zircaloy-4 cladding that allow for representing ballooning and burst under LOCA conditions:
ZryCreepLOCAUpdate: High-temperature creep model based on the correlations from (Neitzel and Rosinger, 1980) (Erbacher et al., 1982). This allows for outward creep deformation of the cladding tube under the effect of internal pressurization and high temperature leading to cladding ballooning. The model accounts for the effect of crystallographic phase transition.
ComputeIsotropicElasticityTensor: elastic properties of the cladding
ZryIrradiationGrowthEigenstrain: ESCORE model for volumetric swelling due to irradiation exposure
ZryThermalExpansionMATPROEigenstrain: MATPRO model for thermal expansion in zirconium alloy
ZryOxidation: High-temperature cladding oxidation calculated using the correlations of Leistikow (Leistikow et al., 1983) (in ZryOxidation model).
ZRPhase: Crystallographic phase transition model which computes the volume fraction of phase for Zr-based cladding materials as a function of time and temperature. The model is based on (Massih, 2009) (Massih and Jernkvist, 2009).
ZryCladdingFailure: Evaluates the onset of cladding burst due to combined overstress and plastic instability (Erbacher et al., 1982) (Marcello et al., 2014), and takes into account the effect of Zirconium phase transition and oxidation.
Boundary and Operating Conditions
The boundary conditions (BCs) in terms of linear heat rate and rig pressure were provided by IFE-Halden.
Temperature BCs at the cladding outer surface were evaluated based on cladding outer temperatures which were measured at two axial positions during the experiment, and were also part of the Halden data. In particular, axial temperature profiles at the clad outer surface were obtained using some simplifying assumptions and imposing coincidence with the measured temperatures at measurement axial locations. The obtained profiles were used as outer cladding temperature BCs in absence of detailed thermal-hydraulics calculations. Details of the procedure and assumptions adopted for the calculation of the temperature BCs used for the BISON simulations of IFA-650.2 are given hereinafter.
Determination of the temperature boundary conditions
Clad outer temperature axial profiles are obtained based on the following assumptions:
The effect of radiation is lumped into an ’effective’ heat transfer coefficient. This is based on linearizing the radiative heat transfer law, , into , where is the heat flux and and has units of a heat transfer coefficient. The linearized equation is accurate if and are close enough. Under this assumption, the axial clad temperature profile can be written in a form as if heat transfer was purely convective
(1)
Where is the axial coordinate, is the coolant temperature, and is the 'effective' heat transfer coefficient (convection+radiation).
The coolant temperature is approximated as the heater temperature at the axial position z. This is estimated based on the Halden data of measured heater temperature at two axial location and a linear interpolation.
The heat flux is proportional to the local linear heat rate, i.e., . This is reasonable provided that the coolant channel conditions are reasonably uniform along the rod and that no axial fuel relocation takes place during the test. From this assumption and Eq. (1), it follows:
(2)
Where and is a constant. The local linear heat rate, , is obtained from the Halden data.
is determined based on the measured cladding temperatures. For this purpose, is assumed to vary linearly along z The two equations needed to determine the coefficients A and B are the conditions of (Eq. (2)) being equal to the measured temperatures at the two measurement locations (thermocouples at clad outer wall).
The strongest simplification in the above approach is taking a linear fit of the heat transfer coefficient along the axial direction. When radiation is dominant, approximately , which likely has a maximum at peak power position. However, the above approach based on measured temperatures may be accurate enough in view of the uncertainties involved in determining thermal-hydraulic boundary conditions.
Figure 2 to Figure 5 show examples of estimated clad outer temperature profiles at selected instants during different phases of the experiment. Using the measured temperatures and an axially varying heat transfer coefficient, actually, allows one to capture effects such as the higher temperature in the lower part of the rod during the blowdown phase, which are difficult to explain (Ek, 2005) or reproduce through thermal-hydraulics calculations.

Figure 2: Estimated axial temperature profile at cladding outer surface at an instant during the forced circulation phase of the IFA-650.2 experiment. The measured temperatures at the thermocouple locations and the linear heat rate (LHR) profile interpolated from Halden data are also shown.

Figure 3: Estimated axial temperature profile at cladding outer surface at an instant during the natural circulation phase of the IFA-650.2 experiment. The measured temperatures at the thermocouple locations and the linear heat rate (LHR) profile interpolated from Halden data are also shown.

Figure 4: Estimated axial temperature profile at cladding outer surface at an instant during the blowdown phase of the IFA-650.2 experiment. The measured temperatures at the thermocouple locations and the linear heat rate (LHR) profile interpolated from Halden data are also shown.

Figure 5: Estimated axial temperature profile at cladding outer surface at the time of cladding burst for the IFA-650.2 experiment. The measured temperatures at the thermocouple locations and the linear heat rate (LHR) profile interpolated from Halden data are also shown.
Input files
The BISON input and all supporting files (power histories, axial power profile, fast neutron flux history, etc.) for this case are provided with the code distribution at bison/assessment/LWR/validation/LOCA_IFA_650/analysis/IFA_650_2.
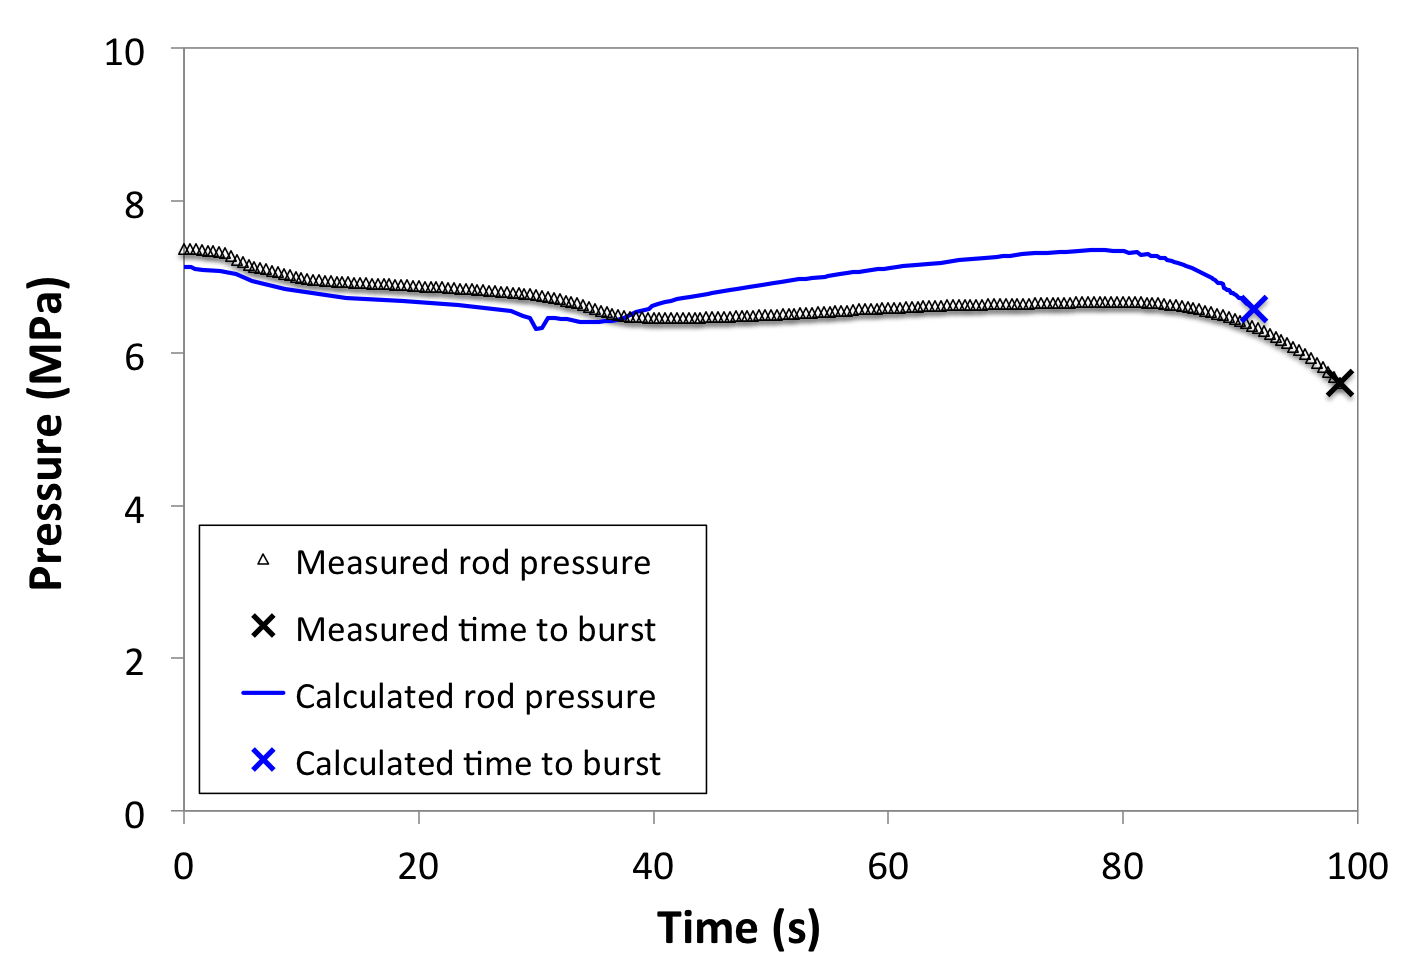
Figure 6: Comparison between measured and calculated fuel rod inner pressure and time to cladding bust for the Halden IFA-650.2 test. Time zero corresponds to the beginning of the blowdown phase.
Results
We present comparison between calculated and experimental inner pin pressure and time to burst for the IFA-650.2 test. In Figure 6, calculated inner pin pressure is compared to the on-line experimental measurement, with predicted and experimental time to burst being also illustrated. The comparison points out that both quantities are reasonably well predicted by BISON. Rod pressure is slightly over-predicted during the heat-up phase of the test, which may be ascribed to discrepancies in the calculated plenum temperature and/or evolution of fuel rod inner volume during ballooning. Fission gas release is very low due to the test being performed with a fresh fuel rod and is not expected to affect rod pressure significantly.
Calculated time to burst is within 7 seconds of the experimental one.
References
- M. Ek.
LOCA Testing at Halden; The Second Experiment IFA-650.2.
Technical Report HWR-813, OECD Halden Reactor Project, 2005.[BibTeX]
- F. J. Erbacher, H. J. Neitzel, H. Rosinger, H. Schmidt, and K. Wiehr.
Burst criterion of Zircaloy fuel claddings in a loss-of-coolant accident.
In Zirconium in the Nuclear Industry, Fifth Conference, ASTM STP 754, D.G. Franklin Ed., 271–283. American Society for Testing and Materials, 1982.[BibTeX]
- IAEA.
Improvement of Computer Codes Used for Fuel Behaviour Simulation (FUMEX-III): Report of a Coordinated Research Project 2008-2012.
Technical Report IAEA-TECDOC-1697, International Atomic Energy Agency, 2008-2012.[BibTeX]
- S. Leistikow, G. Schanz, H. v. Berg, and A.E. Aly.
Comprehensive presentation of extended Zircaloy-4/steam oxidation results 600-1600 C.
In CSNI/IAEA specialists meeting on water reactor fuel safety and fission product release in off-normal and accident conditions. Riso Nat. Lab., Denmark, 1983.[BibTeX]
- V. Di Marcello, A. Schubert, J. van de Laar, and P. Van Uffelen.
The TRANSURANUS mechanical model for large strain analysis.
Nuclear Engineering and Design, 276:19–29, 2014.[BibTeX]
- A.R. Massih.
Transformation kinetics of zirconium alloys under non-isothermal conditions.
Journal of Nuclear Materials, 384:330–335, 2009.[BibTeX]
- Ali R Massih and Lars Olof Jernkvist.
Transformation kinetics of alloys under non-isothermal conditions.
Modelling and Simulation in Materials Science and Engineering, 17(5):055002, 2009.[BibTeX]
- H. J. Neitzel and H. Rosinger.
The development of a burst criterion for zircaloy fuel cladding under loca conditions.
Technical Report KfK 4343, Kernforschungszentrum Karlsruhe GmbH (Germany, Kernforschungszentrum Karlsruhe, Germany, 1980.[BibTeX]
- J. Zhang and M. Veshchunov.
Status Update of the IAEA FUMAC Project.
Presented at the OECD/NEA Expert Group on Reactor Fuel Performance (EGRFP), Paris, France, February 2016.[BibTeX]