Super Ramp
Overview
The Studsvik Super-Ramp project (Djurle, 1984) investigated the behaviour of typical LWR test fuel rods when subjected to power ramps, after base irradiations to medium burnups. The Project consists of 28 fuel rods for the PWR subprogram and 16 for the BWR subprogram. In the following, only the PWR subprogram will be considered.
BISON time domain results on this page have not been updated to reflect the latest modeling and simulation formulations.
Test Description
The Super-Ramp PWR subprogram
The PWR test fuel rods (UO pellets with Ziracaloy-4 claddings) were tested using high ramp rates. Tha main goal of the PWR Super-Ramp subprogram was to establish the damage threshold of the standard design PWR rods, with ramp tests performed at burnups above 30 GWdt.
The irradiation experiments have been performed over 6 groups of PWR fuel rods, with different design specifications and different characteristics of both the fuel and the cladding materials. The rods have been base irradiated in the KWO (Obrigheim, Germany) and BR-3 (Mol, Belgium) commercial reactors, with linear heat rates between 9 and 27 kW m and burnups between 28 and 45 GWdt. Subsequently, the test rods underwent ramp tests in the R2 experimental reactor (Studsvik, Sweden).
The PWR subprogram includes 28 test rods, which can be subdivided in 6 groups according to specific design specifications. The rods analysed below belong to three different groups, as detailed in Table 1.
Table 1: Summary of the Super-Ramp PWR experiment rods. Burnup and linear heat rate refer to radial average values at axial peak position.
| Rod group | Burnup (MWd/kgU) | Linear heat rate (kW m) |
|---|---|---|
| PK1 | 33-36 | 19-26 |
| PK2 | 41-45 | 17-25 |
| PK6 | 34-37 | 20-27 |
| Large grain |
Rod Design Specifications
In the following, the main design specifications of the analyzed fuel rods are reported. The rods were tested without undergoing a refabrication process between base irradiation and ramp test, hence the specifications in Table 2 correspond to the initial specifications.
Table 2: Analysed Super-Ramp PWR rods specifications
| Rod group | PK1 | PK2 | PK6 | units |
|---|---|---|---|---|
| Overall length | 0.388 | 0.390 | 0.390 | m |
| Fuel stack height | 0.312 | 0.318 | 0.314 | m |
| Nominal plenum height | 0.032 | 0.032 | 0.033 | m |
| Fill gas composition | He | He | He | |
| Fill gas pressure | 2.25 | 2.25 | 2.25 | MPa |
| Fuel | ||||
| Material | UO2 | UO2 | UO2 | |
| Enrichment | 3.2 | 3.21 | 2.99 | wt. |
| Density | 94.6 | 94.3 | 95.1 | TD |
| Outer diameter | 9.11 | 9.14 | 9.14 | mm |
| Grain diameter (3D) | 9.36 | 8.58 | 34.3 | m |
| Cladding | ||||
| Material | Zr4 | Zr4 | Zr4 | |
| Outer diameter | 10.76 | 10.75 | 10.74 | mm |
| Inner diameter | 9.31 | 9.28 | 9.29 | mm |
Operating Conditions and Irradiation History
A typical power history for the base irradiation of the Super-Ramp PWR subprogram is reported in Figure 1 and a typical power history for the ramp test is reported in Figure 2. The rod axial power profile, clad surface temperature, coolant pressure and fast flux during experiments have been prescribed coherently with the data available in the International Fuel Performance Experiments database (Sartori et al., ) and in the Super-Ramp final report (Djurle, 1984).
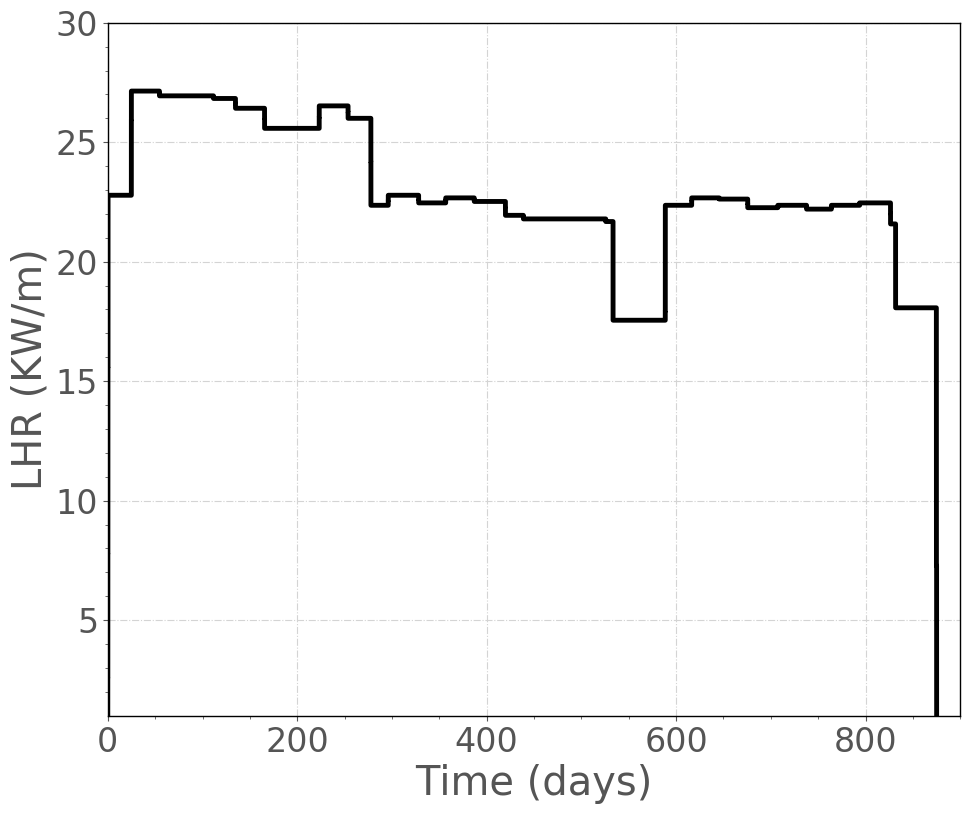
Figure 1: Typical base irradiation history for fuel rods from the Super-Ramp PWR subprogram.
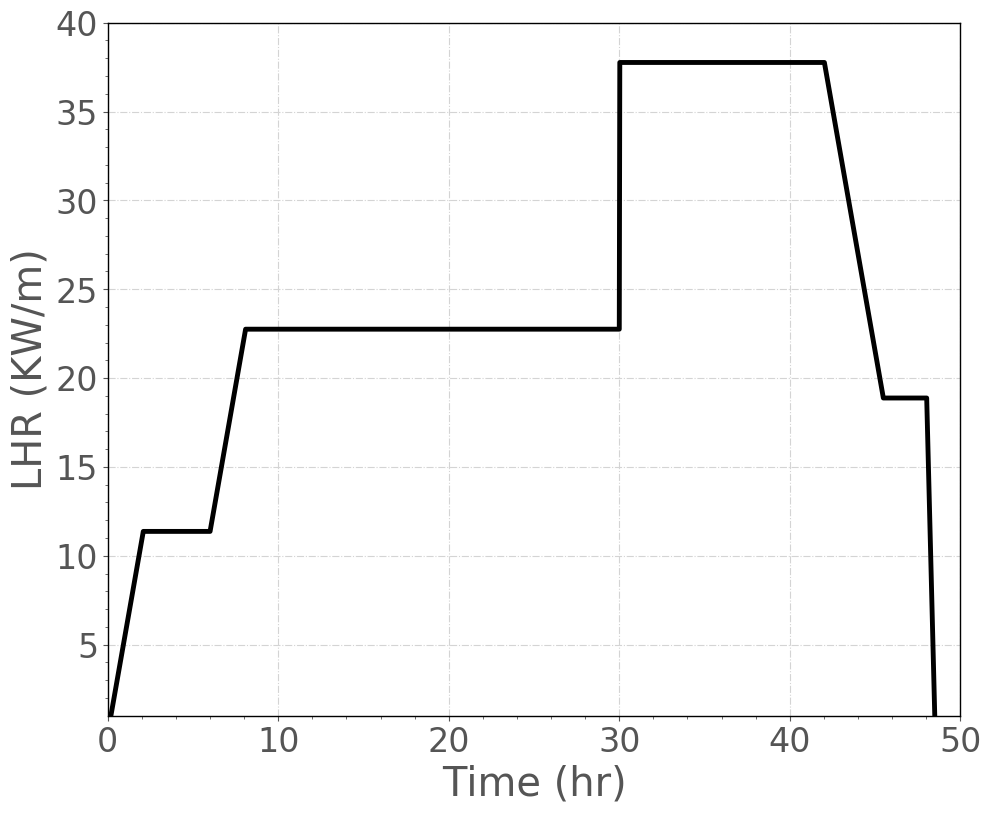
Figure 2: Typical ramp test (in terms of rod average linear heat rate) for fuel rods from the Super-Ramp PWR subprogram.
Model Description
Geometry and Mesh
The considered rods were modeled considering a smeared column of flat ended pellets (chamfering and dishing not considered in the geometry). The insulator pellets, placed in the experiments at both the ends of the fuel column, were neglected.
A 2-dimensional axisymmetric quadratic (Quad8 elements) mesh was used to model the geometry of the considered rods from the Super-Ramp PWR subprogram. The mesh script files employed to generate the meshes of the considered rods are included in each rod subfolder.
Material and Behavioral Models
The following material and behavioral models were used for the UO fuel:
UO2Thermal - NFIR: temperature and burnup dependent thermal properties.
UO2RelocationEigenstrain: relocation strains and recovery, relocation activation threshold power set to 5 kWm.
UO2Sifgrs: fission gas release model with coupled gaseous swelling. The transient capability is considered, and the effective diffusion coefficient is calculated according to Turnbull et al. (Turnbull et al., 1982).
UO2CreepUpdate: Calculates the secondary thermal and irradiation creep for UO2 LWR fuel.
ComputeSmearedCrackingStress: This class implements a fixed smeared cracking model, which represents cracking as a softening stress-strain law at the material points as opposed to introducing topographic changes to the mesh, as would be the case with a discrete cracking model.
ExponentialSoftening: Softening model with an exponential softening response upon cracking.
For the clad material, a constant thermal conductivity of 16 Wm K was used, and both thermal and irradiation creep were considered. Thermal expansion modeling utilized the CTHEXP sub-code with its correlations for Zircaloy (MacDonald and Thompson, 1976).
Boundary and Operating Conditions
The power history considered comprehends the base irradiation, shown in Figure 1, and the subsequent ramp test, reported in Figure 2. The temperature boundary conditions as a function of time was prescribed according to the files available in the IFPE databae (Sartori et al., ). The fast neutron flux in the clad during the base irradiation is available in (Djurle, 1984), whereas during the ramp test was considered to be equal the last irradiation cycle during the base irradiation.
Input files
The BISON input and all supporting files for these cases are provided with the code distribution at bison/assessment/LWR/validation/Super_Ramp/analysis.
To avoid code duplication, the input files are built as follows: A base input file contains characteristics common to the entire assessment case. Specific model, numerical, and configuration parameters are listed in .params files, as well as locations to irradiation history data. PK1X.params, PK2X.params, and PK6X.params list parameters shared by the PK1, PK2, and PK6 groups, respectively. PKXX.params list the information specific to each rod. The base input file requires the information contained in the .params files and cannot run on its own. To run a specific assessment case, the input file can be created by listing the input file and the desired parameters, such as, for PK11: PK11.params PK1X.params Super_Ramp_Base.i
Results
The considered fuel rod experiments from the Super-Ramp PWR subprogram are:
PK1 series: rods PK1-1, PK1-2, PK1-3, PK1-4.
PK2 series: rods PK2-1, PK2-2, PK2-3, PK2-4.
PK6 series: rods PK6-2, PK6-3, PK6-S.
The results considered regard the integral fission gas release (FGR) calculated at the end of the tests. For the Super-Ramp PWR subprogram, the final, integral FGR measurement is available from the IFPE database.
Fission Gas Release
The calculated integral fission gas release at the end of the irradiation for all considered cases is compared to the experimental data in Figure 3. The distance from the 45 line is a measure of the accuracy of the predictions. BISON results show a good agreement with the experimental data, in line with the intrinsic modelling uncertainties (Pastore et al., 2015).
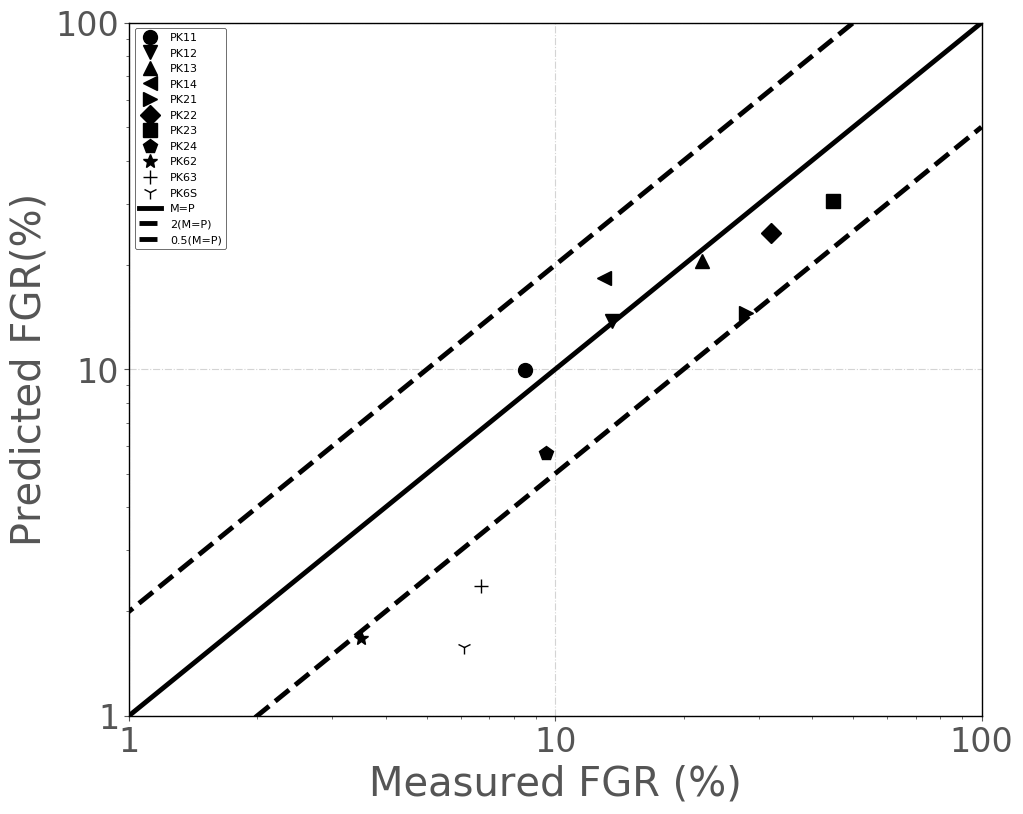
Figure 3: Comparison between the FGR calculated with BISON and the experimental data for all considered cases. The distance from the 45 line is a measure of the accuracy. Each point represents an irradiation experiment from the Super-Ramp PWR database. Acceptable bands are calculated with a factor of 2 (Pastore et al., 2015).]
Moreover, detailed results of FGR as a function of the time for the simulation of PK1-1 and PK1-2 during the ramp tests are reported in Figure 4 and Figure 5, respectively.
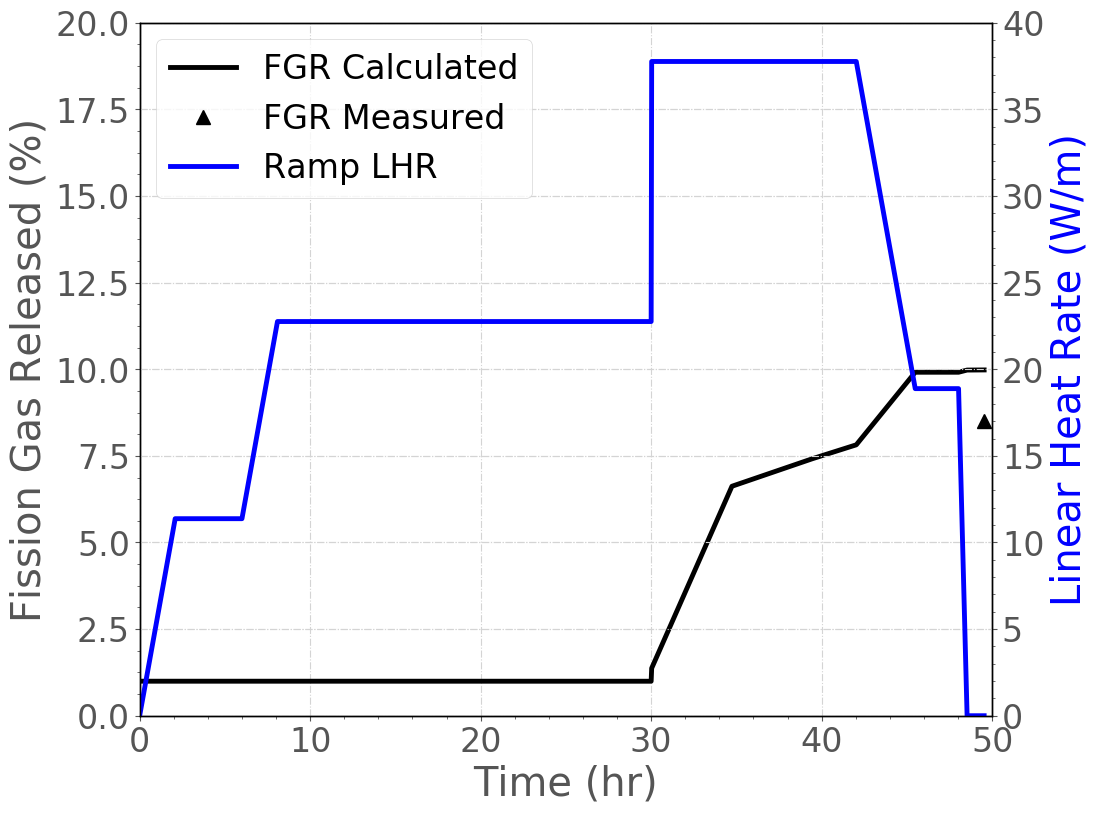
Figure 4: BISON calculated fission gas release during the ramp test (blue line) of the PK1-1 fuel rod experiment compared to the experimental data (green marker). The rod average linear heat rate is reported for completeness.
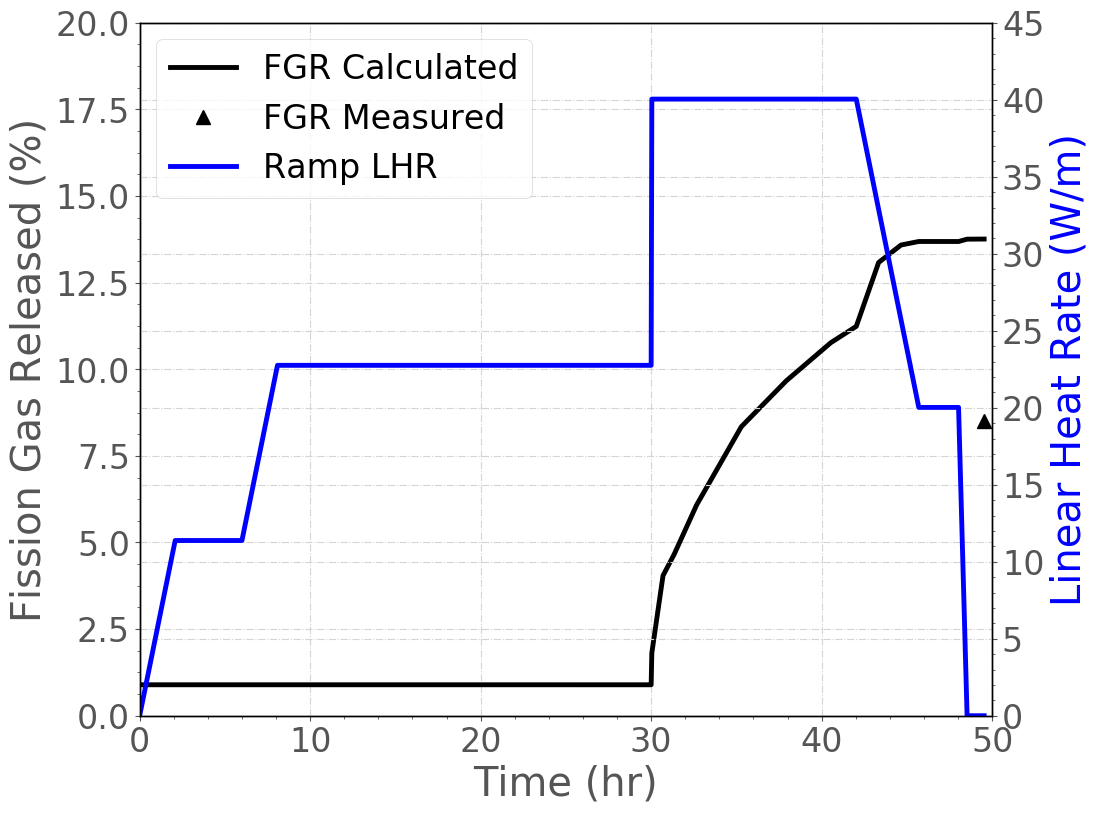
Figure 5: BISON calculated fission gas release during the ramp test (blue line) of the PK1-2 fuel rod experiment compared to the experimental data (green marker). The rod average linear heat rate is reported for completeness.
References
- Seved Djurle.
Final Report of the Super-Ramp Project.
Technical Report STSR-32, Studsvik Energiteknik, AB, 1984.[BibTeX]
- PE MacDonald and LB Thompson.
Matpro-9 a handbook of materials properties for use in the analysis of light water reactor fuel behaviour.
Technical Report TREE-NUREG-1005, SEE CODE-9502158 EG and G Idaho, Inc., Idaho Falls (USA). Idaho National Engineering Lab., 1976.[BibTeX]
- Giovanni Pastore, L.P. Swiler, J.D. Hales, S.R. Novascone, D.M. Perez, B.W. Spencer, L. Luzzi, P. Van Uffelen, and R.L. Williamson.
Uncertainty and sensitivity analysis of fission gas behavior in engineering-scale fuel modeling.
Journal of Nuclear Materials, 456:398–408, 2015.
doi:10.1016/j.jnucmat.2014.09.077.[BibTeX]
- E. Sartori, J. Killeen, and J. A. Turnbull.
International Fuel Performance Experiments (IFPE) Database.
OECD-NEA, 2010, available at http://www.oecd-nea.org/science/fuel/ifpelst.html.[BibTeX]
- J. A. Turnbull, C. A. Friskney, J. R. Findlay, F. A. Johnson, and A. J. Walter.
The diffusion coefficients of gaseous and volatile species during the irradiation of uranium dioxide.
Journal of Nuclear Materials, 107:168–184, 1982.[BibTeX]