LOCA ORNL Burst Tests
Overview
BISON simulations were carried out of the experimental burst tests performed at Oak Ridge National Laboratory (ORNL) on Zircaloy-2 and Zircaloy-4 cladding tubes pressurized internally with helium and subject to temperature transients that mimic LOCA conditions (Massey et al., 2016). These simulations allowed us to validate the LOCA cladding modeling capabilities in BISON to separate-effects tests with well defined experimental conditions.
Description of the Tests
Cladding burst tests were carried out at ORNL's Severe Accident Test Station, inside the integral LOCA furnace module (Massey et al., 2016). Figure 1 shows a schematic of the experimental apparatus. The experimental setup utilized an 8 kW infrared furnace to rapidly heat a 30 cm long, 9.5 mm diameter, internally pressurized tube. The test configuration consisted of 8.2 mm diameter, 15 mm long zirconia pellets inside a thin-walled cladding tube of the material of interest. The loaded tube was centered inside a quartz furnace tube and had at least three Type-S thermocouples attached to its surface. The rod was internally pressurized with He while steam was continuously flowing (30 cm/s) at 0.1 MPa on the outside of the cladding. At the top, away from the heated zone, a miniature pressure transducer was attached to the rod to continuously monitor the pressure inside the rod. The burst test sequence consisted of ramping at 5 C/s from 300 to 1200 C, holding at 1200 C for 3 min, ramping down to 800 C, and finally, quenching with room-temperature water.
Table 1: Cladding geometry for the ORNL burst tests (Massey et al., 2016).
| Cladding material | Inner diameter (mm) | Outer diameter (mm) | Thickness (m) |
|---|---|---|---|
| Zircaloy-4 | 8.35 | 9.50 | 575 |
| Zircaloy-2 | 9.75 | 11.16 | 705 |
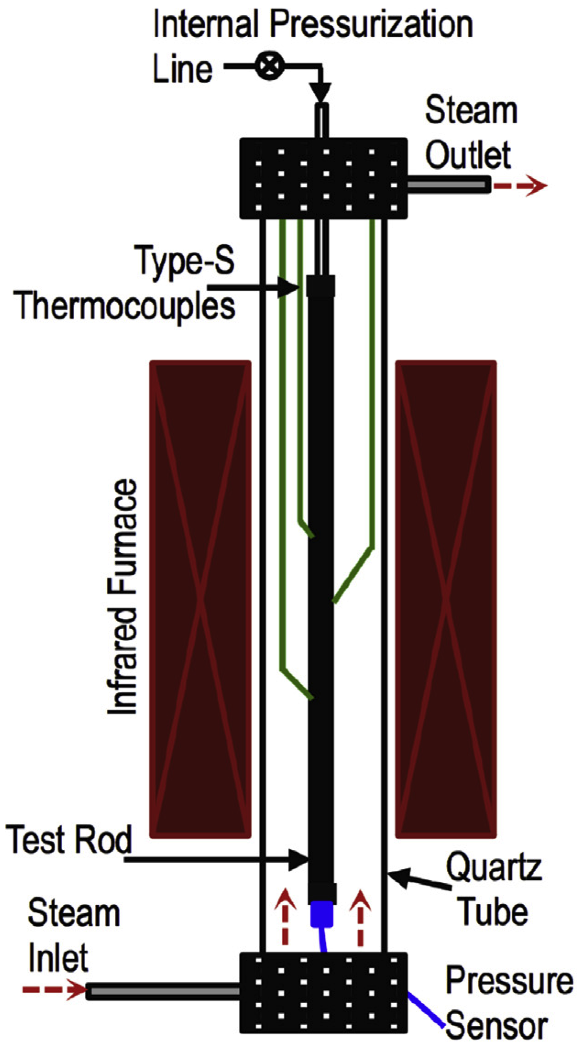
Figure 1: Schematic of the integral LOCA test module at ORNL's SevereA ccident Test Station (Massey et al., 2016).
Tests were performed for various cladding materials but in this work, we focus on the Zircaloy cases. The geometry of the cladding tubes examined in this study is reported in Table 1.
Modeling
BISON simulations were performed for one Zircaloy-4 test and two Zircaloy-2 tests. These represent the totality of the Zircaloy tests performed at ORNL with the exception of one Zircaloy-4 test which has been left out pending further investigation on the recorded temperature-pressure data.
Geometrical Representation and Boundary Conditions
2D axisymmetric BISON models of the cladding tubes tested during the ORNL cladding burst tests were built. Taking advantage of the symmetry of the problem, only the lower half of the heated cladding length was modeled.
The time-dependent temperatures and inner pressures for the cladding tubes were simulated by Dirichlet boundary conditions, whose time-dependent values were derived from thermocouples and pressure transducer data received from ORNL. In order to construct suitable noise-free boundary conditions for the BISON inputs, linear fits were made of the temperature and pressure signals. As an example, Figure 2 shows the tube inner pressure and temperatures for the Zircaloy-4 case (referred to as test Zy4-1). Both raw signals and data fits used as BISON inputs are illustrated. A separate fit was made for each of the test phases, which have approximately linear temperature/pressure evolutions, with continuity being imposed for the overall curves. For the temperature data, raw data from various thermocouples are given which differ significantly from each other, and the exact positions for the thermocouples are unknown. Differences in the signals from different thermocouples indicate that a significant axial temperature profile existed in the sample. An axial temperature profile with a peak near the mid-plane of the tube is also consistent with the cladding strain during the experiment showing an axial peak and burst occurring near the mid-plane (Massey et al., 2016). In order to develop the temperature boundary conditions for the present simulations including a meaningful axial profile, the following approach was adopted. The fit of the maximum temperature data signal (arguably the one from the mid-plane thermocouple) was used as the maximum, mid-plane temperature boundary condition ('peak' in Figure 2). A linear axial profile was considered along the axial direction with the lower value being estimated based on the lower recorded temperature signals from the other thermocouples ('min' in Figure 2). Note that, as long as an axial profile exists, we do not expect the temperature variation to affect the results in terms of maximum cladding stress, strain, and burst time significantly, based on previous experience and also as verified in the current work. The lower temperature was imposed at the boundary of the heated length, that is, 5 inches above the mid-plane (Terrani, 2016). The unheated length is kept at ambient temperature.
For the BISON boundary condition of cladding inner pressure, the linear fit for the pressure evolution during the heating transient was extrapolated beyond the time of rod burst, when the pressure in the experiment drops because of the burst opening. For a meaningful simulation the pressure follows a realistic trend for an intact rod during the transient until the simulated time to burst, which may occur later than in the experiment. The outer pressure boundary condition is constant at ambient pressure throughout the simulation, consistent with the experimental conditions.
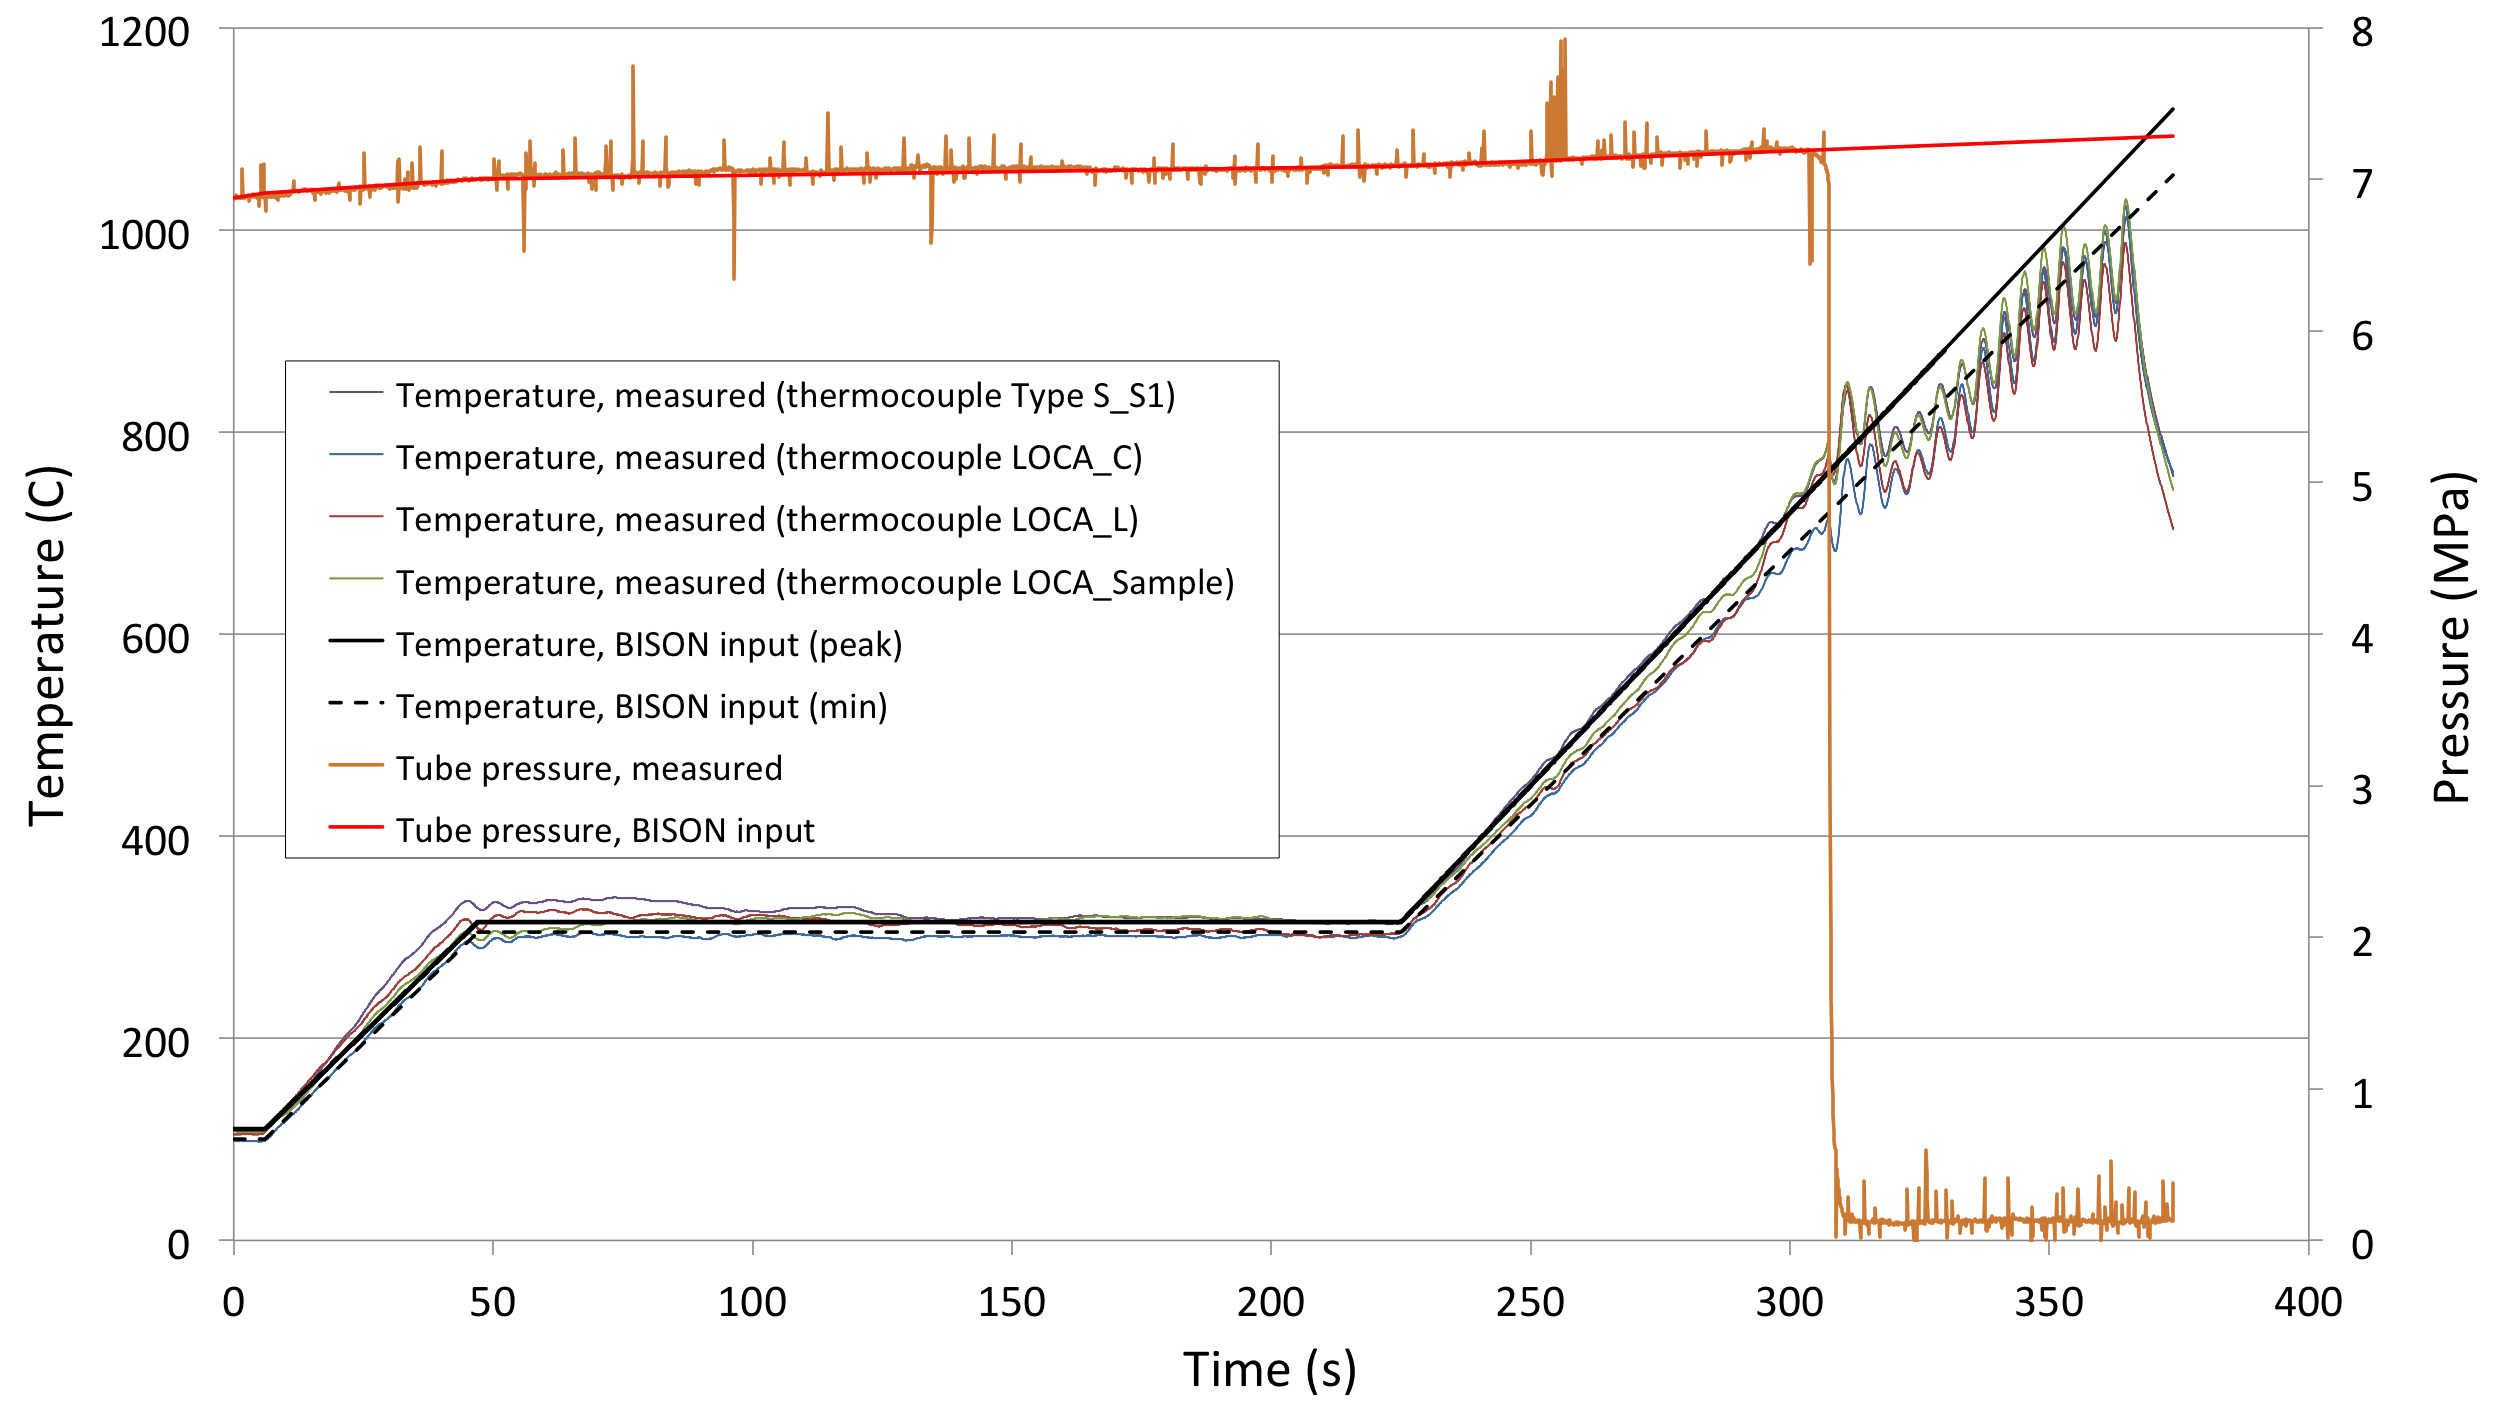
Figure 2: Raw data of cladding temperatures and inner pressure and developed BISON inputs for the Zy4-1 test simulation.
Raw data of cladding inner pressure and temperature evolution, and the corresponding developed BISON boundary conditions, for the Zircaloy-2 cases (Zy2-1 and Zy2-2) are shown in Figure 3 and Figure 4, respectively.
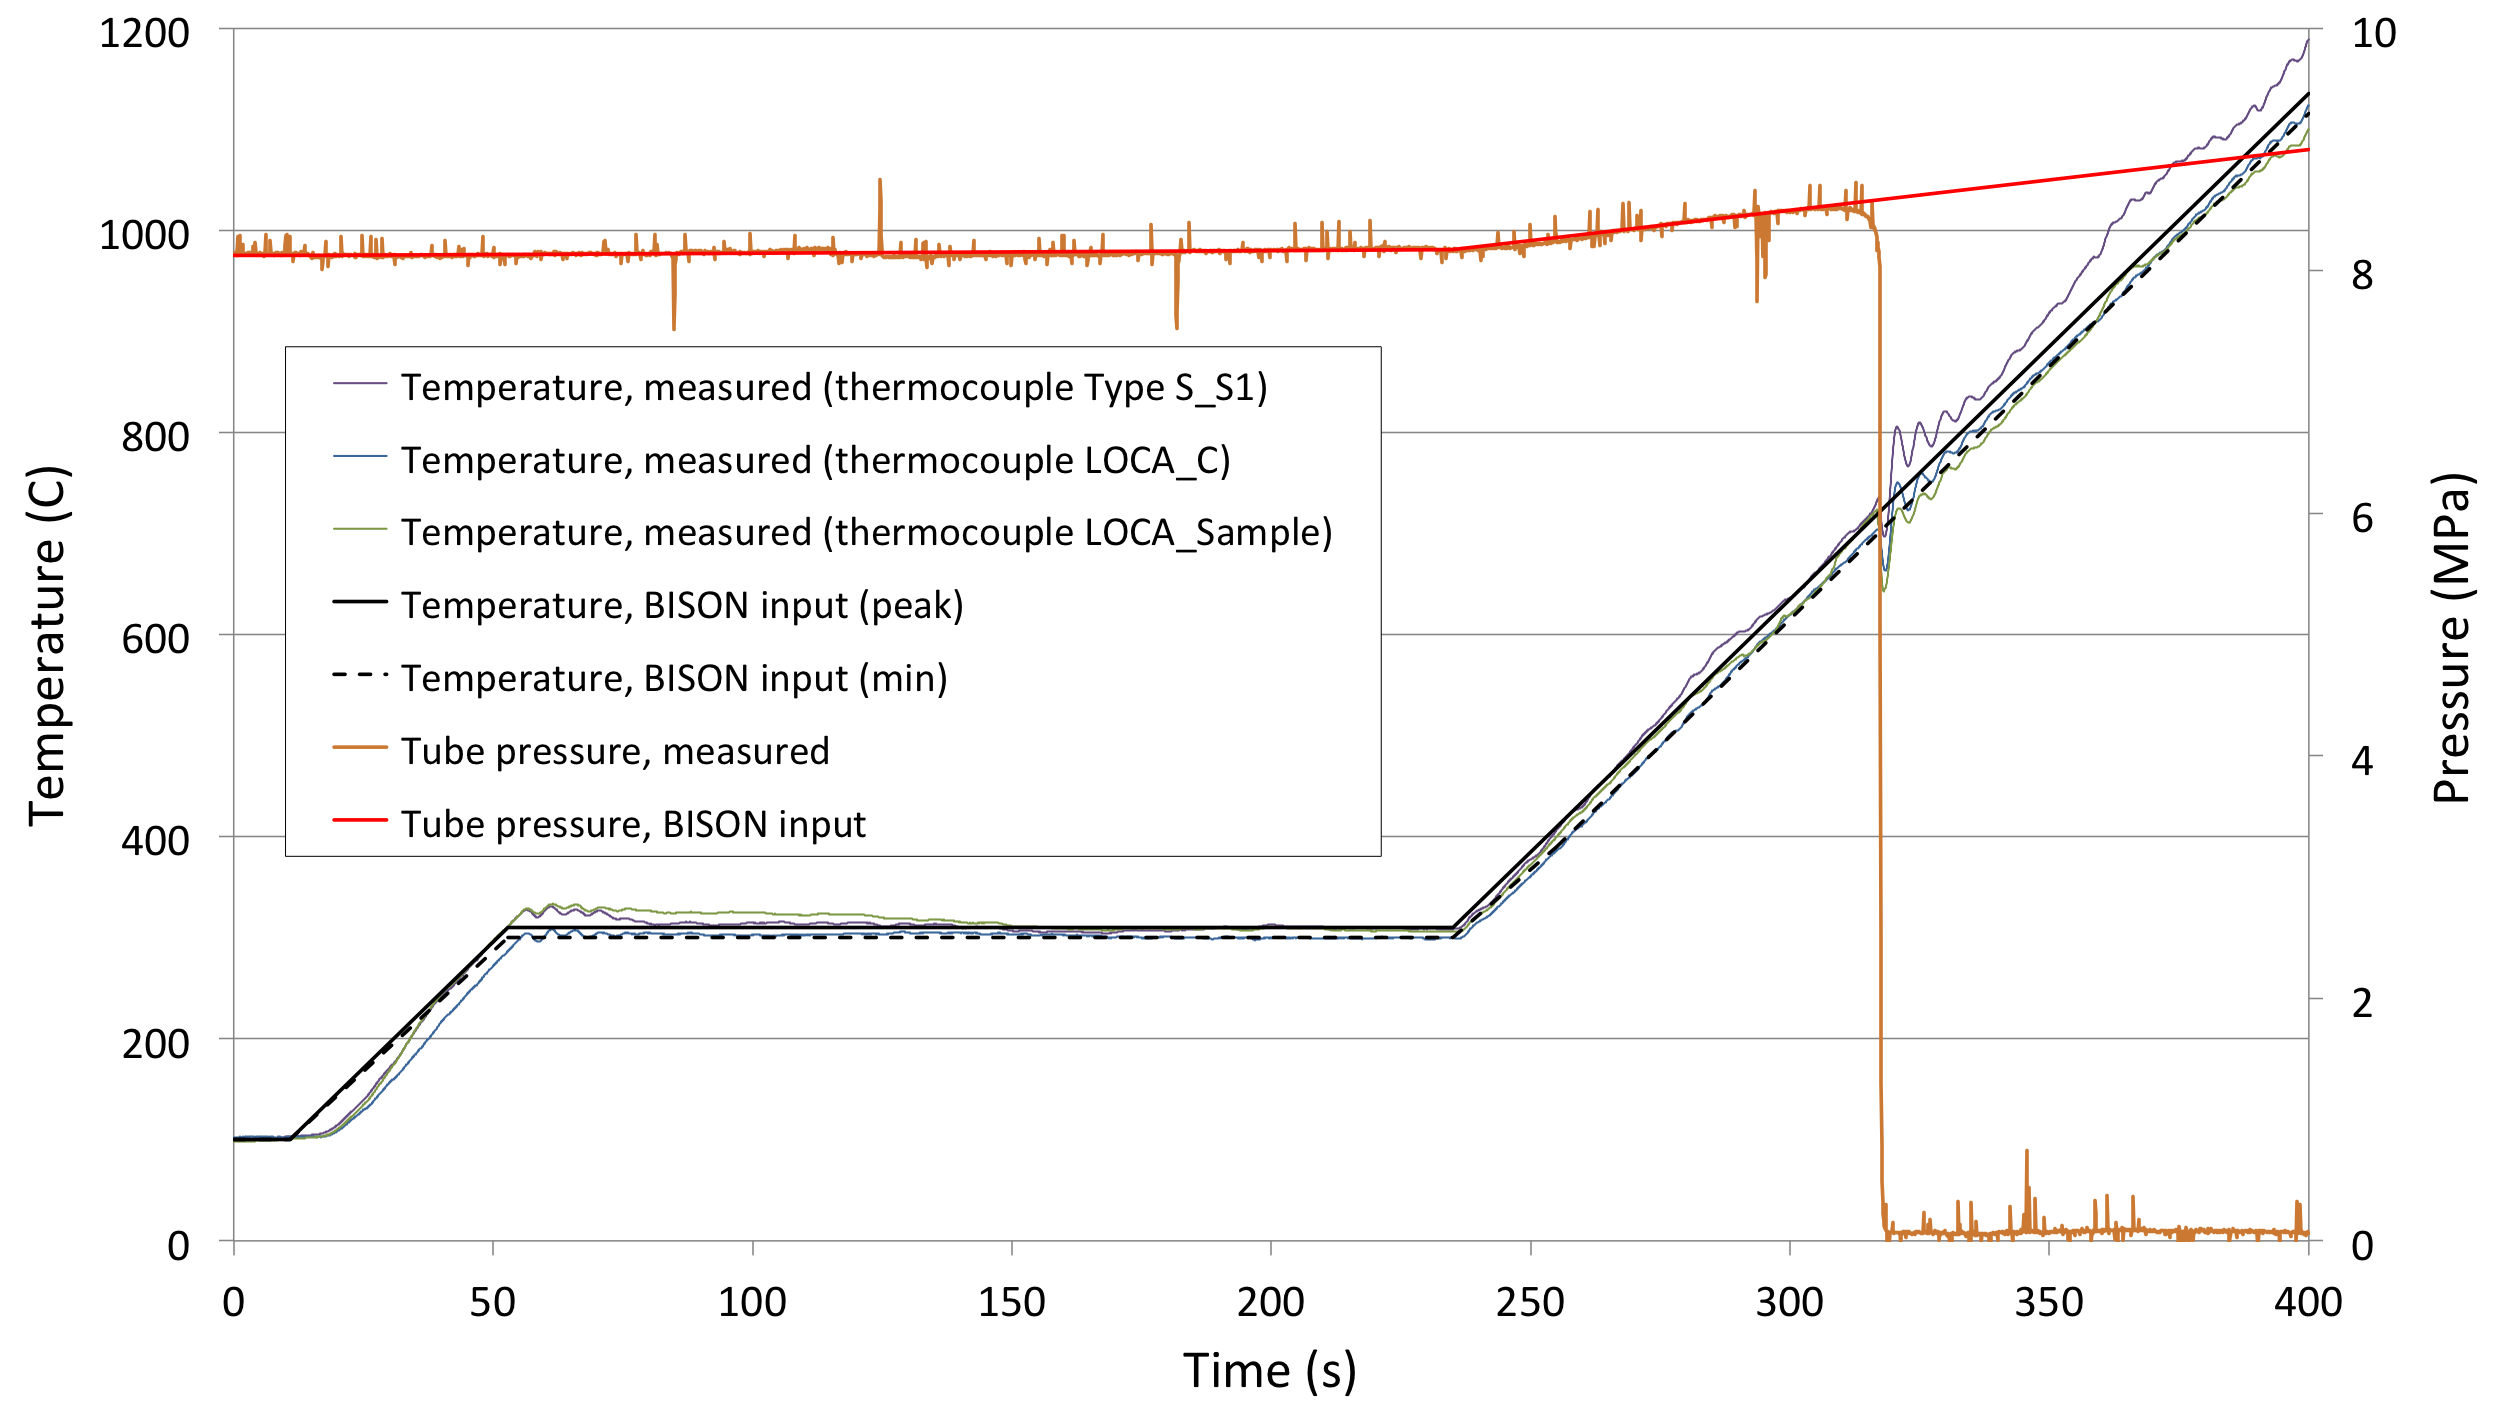
Figure 3: Raw data of cladding temperatures and inner pressure and developed BISON inputs for the Zy2-1 test simulation.
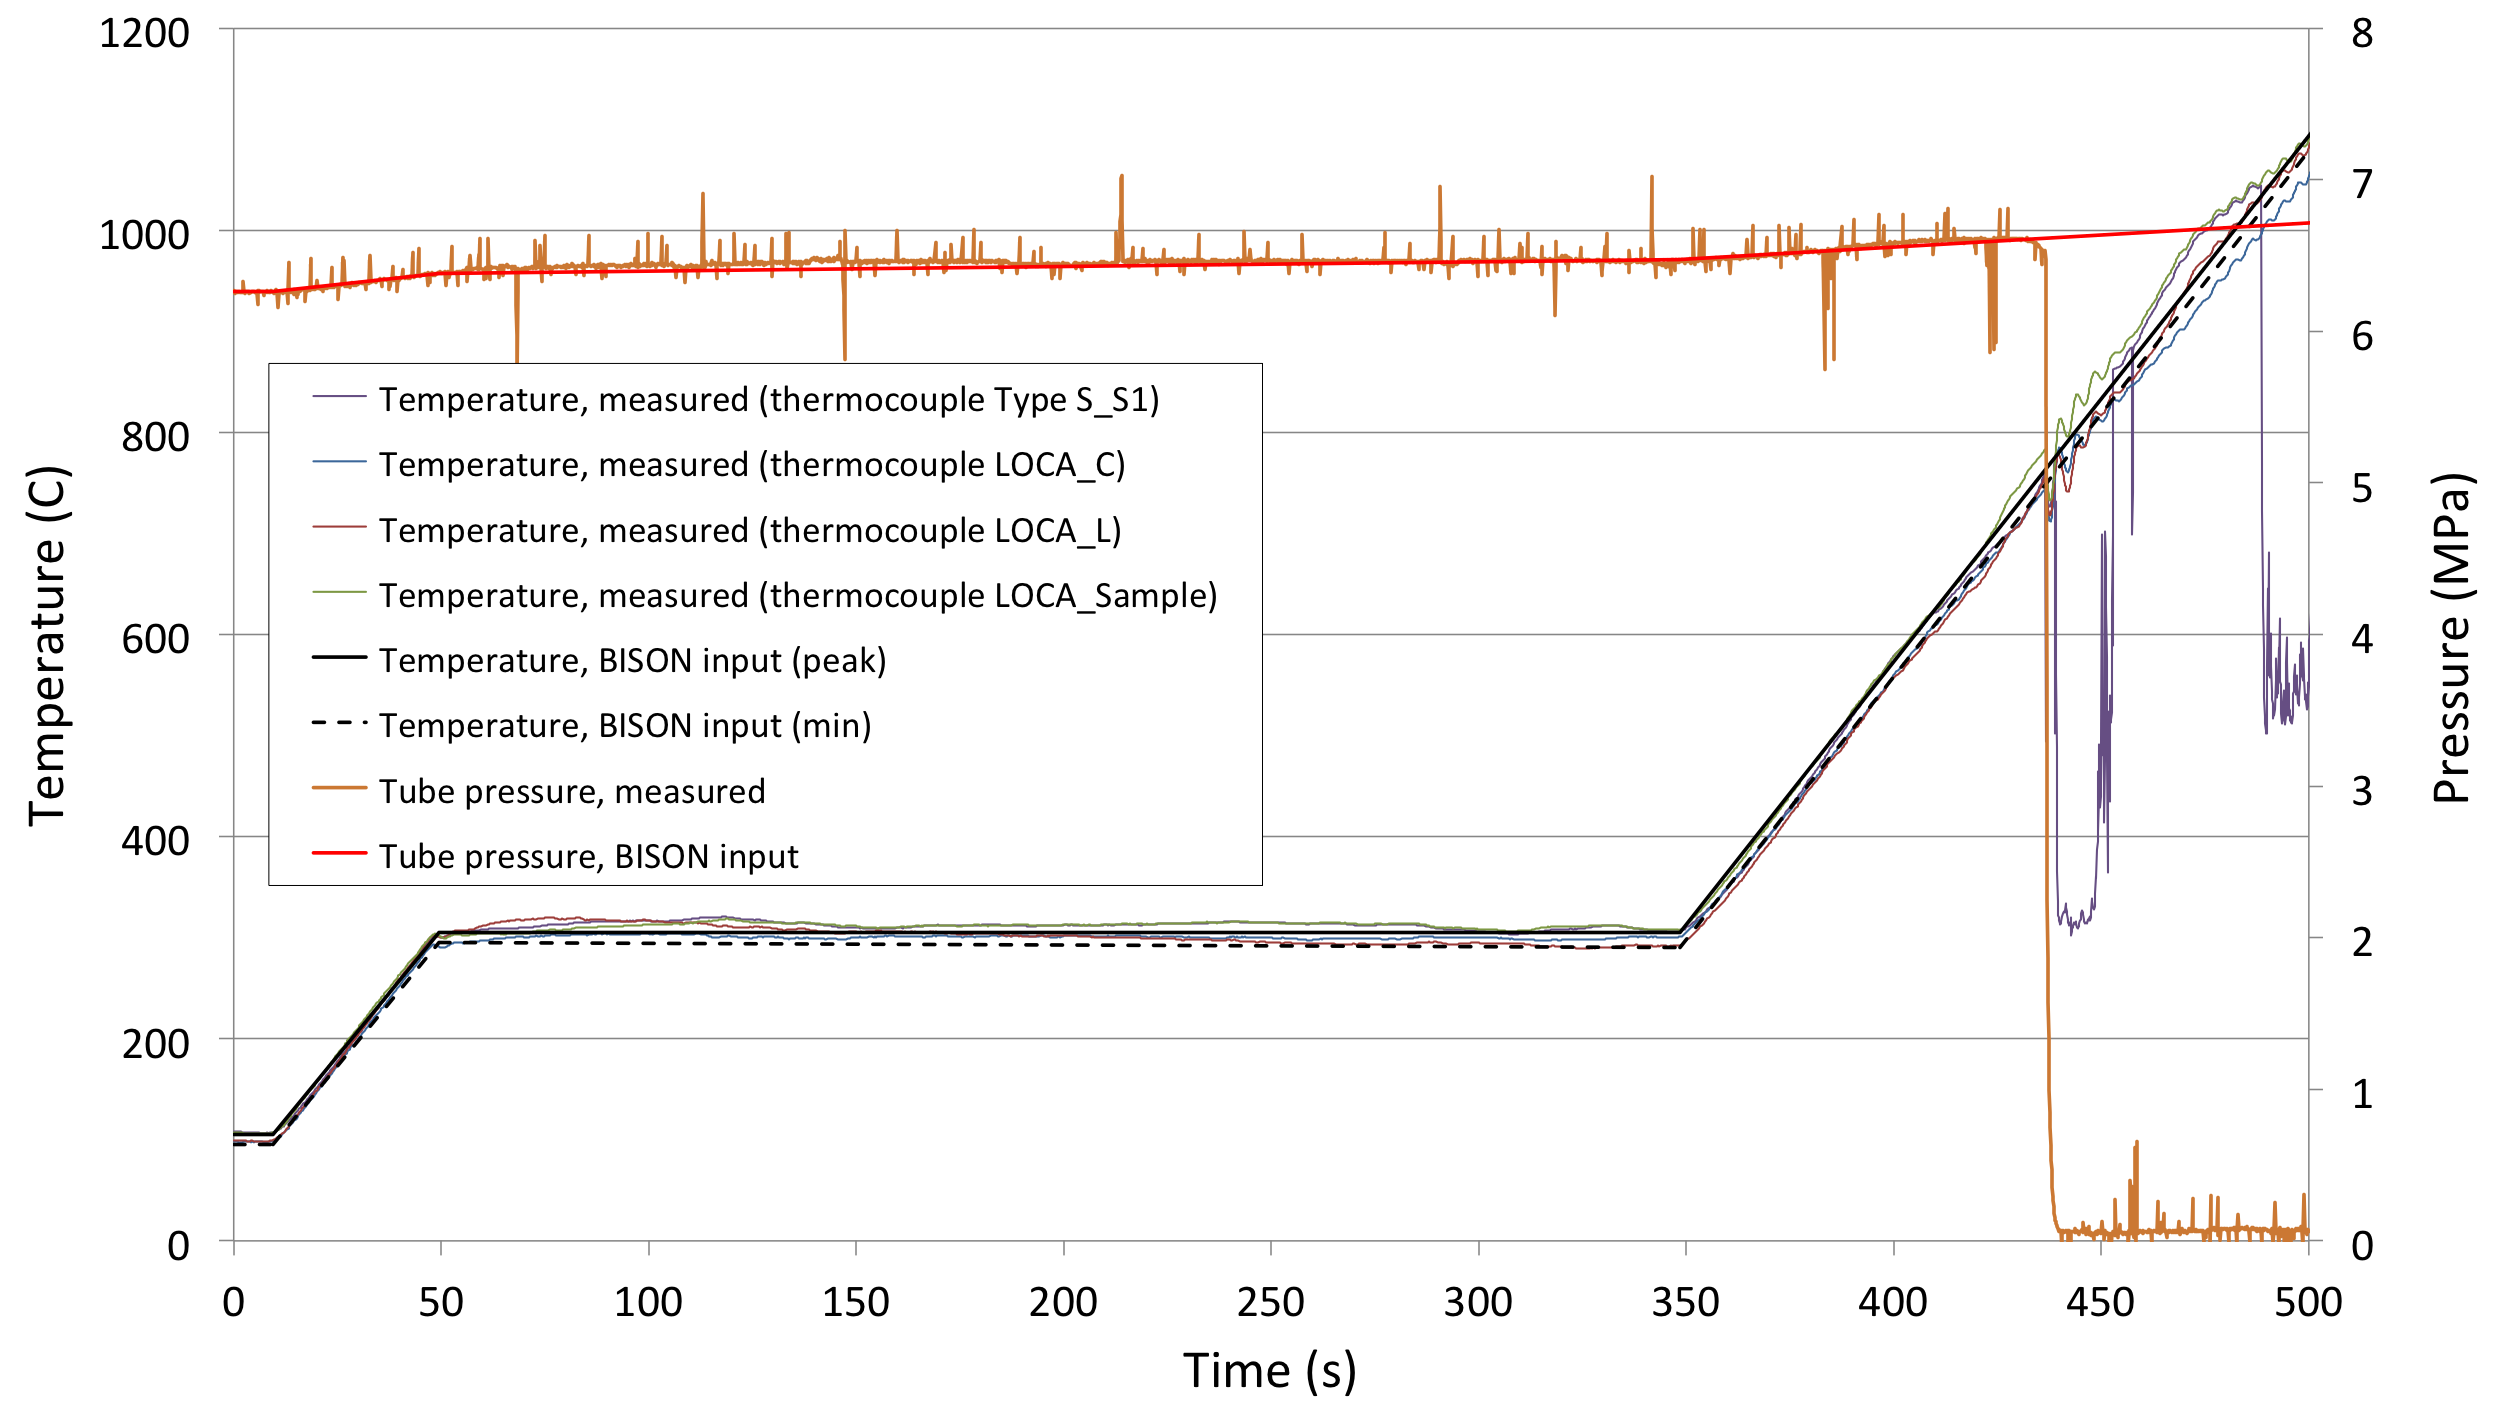
Figure 4: Raw data of cladding temperatures and inner pressure and developed BISON inputs for the Zy2-2 test simulation.
Input files
The BISON input and all supporting files for these cases are provided with the code distribution at bison/assessment/LWR/validation/LOCA_ORNL_cladding_burst_tests/analysis.
Material and Behavioral Models
The following material and behavioral models were used for the Zircaloy-4 cladding:
ZryThermal: Thermophysical material properties of Zircaloy.
ZryCreepLOCAUpdate and ZryElasticityTensor: Calculates the Erbacher secondary thermal creep under loss-of-coolant accident conditions, the Limback-Andersson primary thermal creep, and the Hoope irradiation creep for Zircaloy cladding
ZryThermalExpansionMATPROEigenstrain: Computes the thermal expansion of Zircaloy with the MATPRO model
ZrPhase: Calculates the relative amounts of the and material phases present in the zircaloy
ZryOxidation: Model for waterside oxidation of Zircaloy, including oxidation in high temperature steam.
ZryCladdingFailure: Criterion for cladding failure due to burst, based on the calculated hoop stress and creep strain rate.
Details and references for all of these models listed above can be found on the linked BISON documentation pages.
Results
Table 2: Experimental and calculated time to burst for the tests simulated in this work.
| Test label | Experimental time to burst (s) | Calculated time to burst (s) |
|---|---|---|
| Zy4-1 | 307 | 312 |
| Zy2-1 | 317 | 328 |
| Zy2-2 | 437 | 448 |
Figure 5 shows the time evolution of the calculated hoop stress and hoop strain at the cladding outer surface at the mid-plane (peak temperature position). The cladding deforms outwards due to thermal creep under the tensile stress caused by the inner pressure and with the increasing temperature during the simulated test. Because of the exponential dependence of the thermal creep rate on temperature, the strain rate increases rapidly as burst failure is approached. Correspondingly, the stress increases as the cladding wall progressively thins as the cladding deforms due to creep.
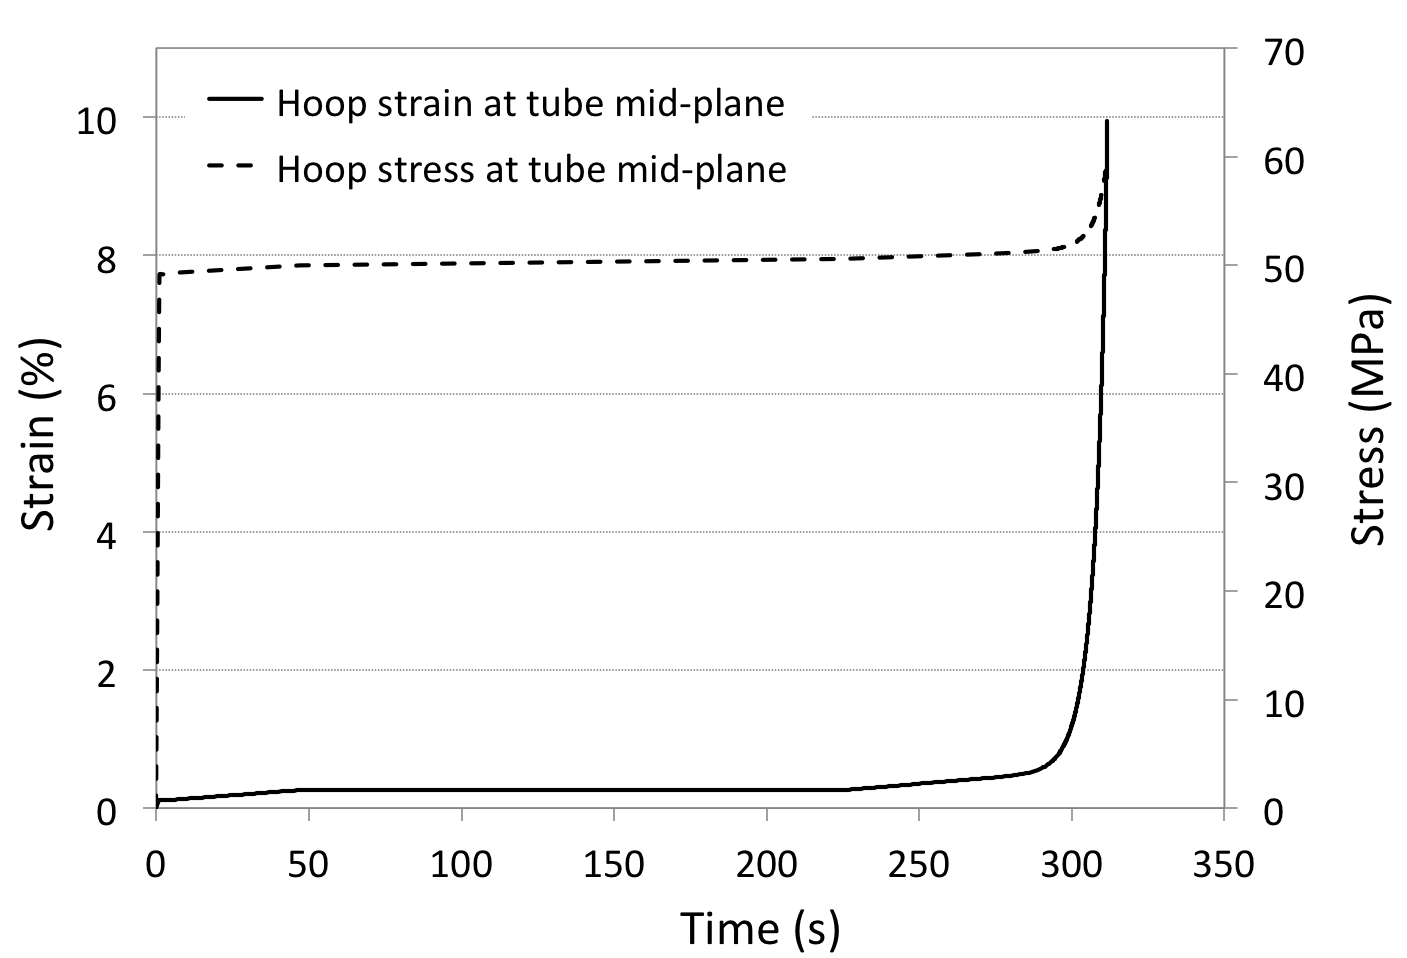
Figure 5: Time evolution of hoop stress and hoop strain at the cladding outer surface at mid-plane for the Zy4-1 test simulation.
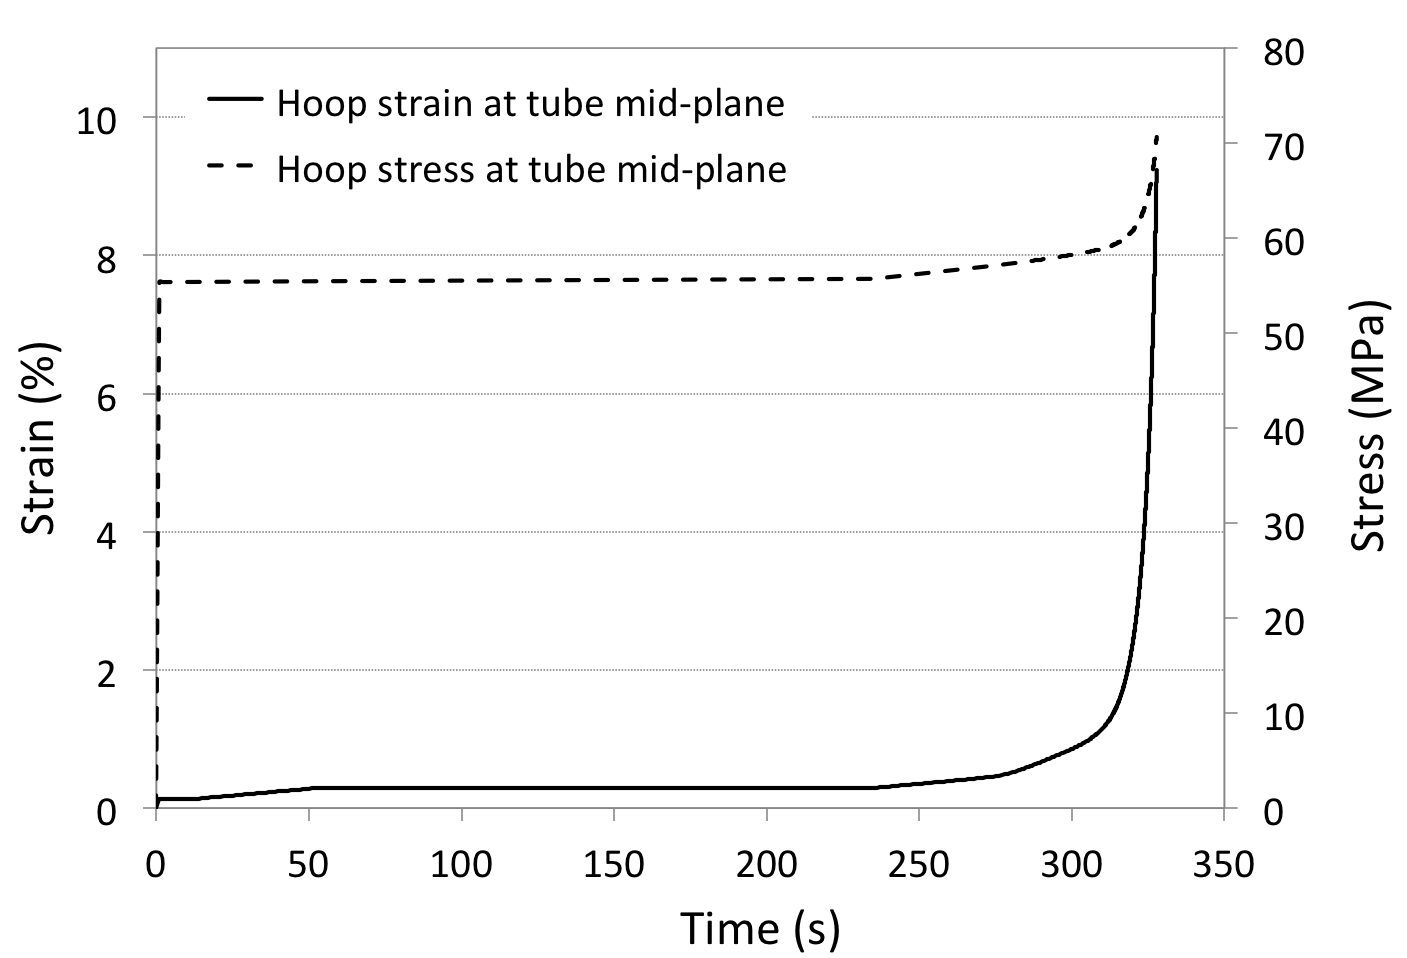
Figure 6: Time evolution of hoop stress and hoop strain at the cladding outer surface at mid-plane for the Zy2-1 test simulation.
The calculated time to burst is 312 seconds, compared to an experimental value of approximately 307 seconds. This is an accurate prediction considering the uncertainties and approximations in state-of-the-art modeling for LOCA conditions, as demonstrated by a recent international benchmark of fuel performance codes that was focused on LOCA analysis (IAEA, 2018) (Pastore and Kulacsy, 2018).

Figure 7: Time evolution of hoop stress and hoop strain at the cladding outer surface at mid-plane for the Zy2-2 test simulation.
The calculated time evolution of stress and strain at the mid-plane for the simulation of the first Zircaloy-2 test (Zy2-1) are plotted in Figure 6. For this case, the calculated time to burst is 328 seconds, compared to an experimental value of approximately 317 seconds. This prediction is still encouraging, although less accurate than the one for the Zircaloy-4 case presented above. Note that some of the LOCA models in BISON, in particular the high-temperature thermal creep and burst failure models, are based on data for Zircaloy-4 (Erbacher et al., 1982), which may explain the lower accuracy of predictions for the Zy2-1 case compared to Zy4-1.
Figure 7 illustrates the stress-strain results for the simulation of the other Zircaloy-2 burst test (Zy2-2). For this case, the calculated time to burst is 448 seconds, compared to an experimental value of approximately 437 seconds. Such an accuracy is again encouraging and appears consistent with the prediction for the other Zircaloy-2 case, Zy2-1.
Table 2 summarizes calculated and experimental values of time to burst for the ORNL burst tests simulated in this work.
References
- F. J. Erbacher, H. J. Neitzel, H. Rosinger, H. Schmidt, and K. Wiehr.
Burst criterion of Zircaloy fuel claddings in a loss-of-coolant accident.
In Zirconium in the Nuclear Industry, Fifth Conference, ASTM STP 754, D.G. Franklin Ed., 271–283. American Society for Testing and Materials, 1982.[BibTeX]
- IAEA.
Fuel Modelling in Accident Conditions (FUMAC): Report of a Coordinated Research Project (CRP T12028) 2014-2018.
Technical Report, International Atomic Energy Agency, 2018.
In preparation.[BibTeX]
- Caleb P. Massey, Kurt A. Terrani, Sebastien N. Dryepondt, and Bruce A. Pint.
Cladding burst behavior of Fe-based alloys under LOCA.
Journal of Nuclear Materials, 470():128–138, 2016.
URL: http://www.sciencedirect.com/science/article/pii/S0022311515303871, doi:http://dx.doi.org/10.1016/j.jnucmat.2015.12.018.[BibTeX]
- G. Pastore and K. Kulacsy.
IAEA FUMAC benchmark of fuel performance codes based on LOCA separate-effects cladding tests.
In Reactor Fuel Performance Meeting - Top Fuel, Prague, Czech Republic, September 30 - October 4, volume. 2018.[BibTeX]
- K. A. Terrani.
Private communication, October 2016, 2016.[BibTeX]