LOCA MT4 and MT6A
Overview
Loss-of-coolant accidents (LOCA) typically occur from full power conditions in pressurized water reactors (PWR). A series of thermal-hydraulic and cladding mechanical deformation tests were conducted in the National Research Universal (NRU) reactor at Chalk River National Laboratory in Canada by Pacific Northwest Laboratory (PNL) under the LOCA Simulation Program sponsored by the US Nuclear Regulatory Commission (NRC). The major objectives of this program was to perform simulated LOCA experiments using full-length light-water reactor fuel rods to study mechanical deformation, flow blockage, and coolability. The test conditions were designed to simulate the adiabatic heatup, reflood and quench phases of a large-break LOCA using nuclear fissioning to simulate low-level decay heat. During the adiabatic heatup phase up to 1200 K, the Zircaloy-4 cladding begins to expand leading to rupture at high temperatures from 1035 to 1200 K. The cladding inner surface and outer surface temperatures were measured, in addition to coolant temperatures using thermocouples. However, only cladding inner surface temperatures were generally presented in the reports on the tests. After the experiments, the test train was dismantled and cladding rupture sites were determined and fuel rod profilometry was performed in the spent fuel pool. Only limited destructive post-irradiation examination was performed on these tests. Two material tests (MT), MT-4 and MT-6A, were selected for the assessment of BISON. The MT-4 and MT-6A tests consist of 12 and 21 pressurized test rods, respectively. These two tests were considered to be well characterized for the purposes of setting up computer simulation and comparison with measured data. The measured data, operating conditions and fuel rod design parameters are provided in the NUREG-3272(PNL-4669) (C. L. Wilson, 1983) and PNL-8829 (C. L. Wilson, 1993) reports.
Test Description
Fuel Rod Design Specifications
The fuel rod design parameters for material tests MT-4 and MT-6A are summarized in Table 1. The MT-4 and MT-6A tests consist of 12 and 21 full-length PWR rods subjected to adiabatic heatup followed by reflood cooling, respectively. The primary objectives of the MT tests were to provide sufficient time in the alpha-Zircaloy ballooning window of 1033 to 1200 K for MT-4 and 1050 to 1140 K for MT-6A to allow the pressurized test fuel rods to rupture before reflood cooling was introduced and to obtained rod internal pressure and fuel rod deformation data.
Table 1: Fuel Rod Characterization Data
| Design Parameter | MT-4 | MT-6A |
|---|---|---|
| Cladding Type | Zry-4 | Zry-4 |
| Cladding OD (mm) | 9.63 | 9.63 |
| Cladding ID (mm) | 8.41 | 8.41 |
| Fuel OD (mm) | 8.26 | 8.26 |
| Fuel Length (mm) | 3660 | 3660 |
| Total Rod Length (mm) | 3880 | 3880 |
| Fill Gas (MPa) | 4.62 at 296 K | 6.03 at 295 K |
| Internal Gas Pressure Prior to Transient (MPa) | 9.3 | 9.15 |
| Fuel Enrichment (% U-235) | 2.93 | 2.93 |
| Fuel Density (%TD) | 95 | 95 |
| Fuel Pellet Height (mm) | 9.5 | 9.5 |
| Fuel Grain Size (microns) | 10 | 10 |
| Fuel Roughness (microns) | 2 | 2 |
| Cladding Roughness (microns) | 1 | 1 |
| Cladding Cold Work | 0.5 | 0.5 |
| Plenum Length (mm) | 200 | 200 |
| Plenum Spring Wire Diameter (mm) | 1.3 | 1.3 |
| Plenum Spring Diameter (mm) | 7.9 | 7.9 |
| Plenum Spring Number of Coils | 60 | 60 |
Operating Conditions
The test rods for the LOCA cases were irradiated in flowing steam in the NRU reactor prior to the transient, stagnant steam during the transient and prior to reflood, and then reflood conditions to complete the transient. The NRU reactor is a heterogeneous, thermal, tank-type research reactor. It has a power level of 135 MWth and is heavy-water moderated and cooled.
The operating conditions for Tests MT-4 and MT-6A are summarized in Table 2. For both MT-4 and MT-6A test cases, a power history of 1.1 kW/m was used for these simulations instead of 1.2 kW/m due to convergence issues. Even with a constant power history of 1.1 kW/m, convergence issues still exist after cladding failure occurred. The convergence issues are speculated to be cause by the high cladding creep rate at high temperature and localized power and temperature effect on the cladding strain behavior during adiabatic heatup. The large deformation due to high cladding creep rate at high temperature and pressure during adiabatic heatup may cause the code to have difficulty converging. An axial power profile used for the MT-4 and MT-6A test cases is shown in Figure 1.
Since it's not possible to input more than one reflood rate in BISON at the moment, an average reflood rate of 5 in/s (0.127 m/s) and 2.33 in/s (0.059182 m/s) was used for the simulation of MT-4 and MT-6A test cases, respectively. Reflood was initiated 57 seconds after the start of the transient (after steam flow was shutoff) for MT-4 test and 60 seconds after the start of the transient(after steam flow was shutoff) for MT-6A test. The pretransient axial temperature profile for MT-4 and MT-6A test cases is summarized in Figure 2. This was input as the initial temperature at the start of the transient by using a polynomial best fit equation shown in the Figure 2.
Table 2: Summary of Operating Conditions for Tests MT-4 and MT-6A
| Parameter | MT-4 | MT-6A |
|---|---|---|
| Power Level (kW/m) | 1.2 | 1.2 |
| Pre-Transient Cladding Temperature (K) | 640 | 675-700 |
| Steam Pressure (MPa) | 0.28 | 1.72 |
| Delay Time Before Reflood (s) | 57 | 60 |
| Reflood Rate (in/s) | 8 in/s for 6 s | 8 in/s for 3 s |
| 4 in/s for 6 s | 7 in/s for 3 s | |
| 1 in/s for 3 s | 2 in/s for balance | |
| Reflood Temperature (K) | 311 | 310 |
| Test Duration (min) | 18.7 | 5 |
Table 3: Adjusted Fuel Rod Length and Plenum Height
| Rod Serial | Adjusted Rod | Adjusted Plenum | ||
| Number | Length(m) | Height (m) | ||
| MT-4 | 3.85315 | 0.18867 | ||
| MT-6A | 3.85315 | 0.18867 |
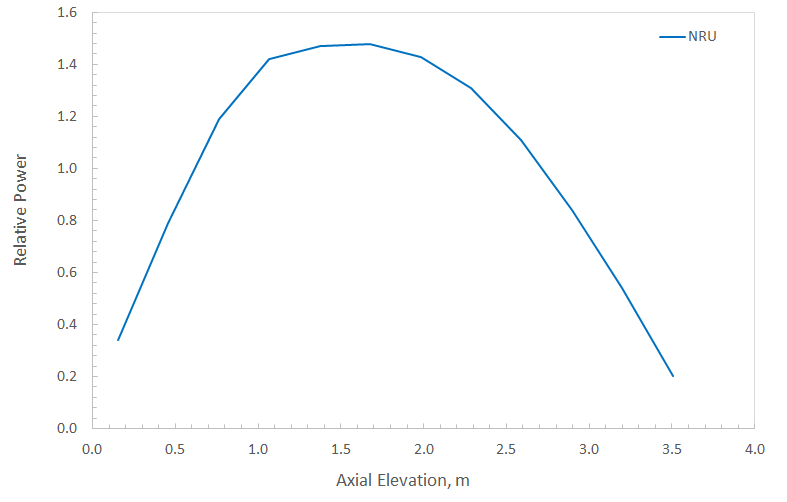
Figure 1: Axial Power Profile for MT-4 and MT-6A LOCA Test Cases
Figure 2: Pretransient Axial Temperature Profile for MT-4 and MT-6A test cases
Model Description
Geometry and Mesh
The rod specifications in Table 1 were used to define the geometry for these simulations. The two selected rods were modeled as a two-dimensional, axi-symmetric mesh with quadratic elements. The fuel mesh for the two test rods consisted of 12 radial elements and the cladding mesh consisted of 4 radial elements to form a cladding thickness of 0.61 mm. In order to accurately model the fuel rod initial free volume, the overall fuel rod length and upper plenum height were adjusted during mesh generation to account for the volume of the plenum spring which is not explicitly modeled. The adjusted fuel rod lengths and plenum heights for the two test cases are shown in Table 3. The mesh for MT-4 and MT-6A test rods is shown in Figure 3.
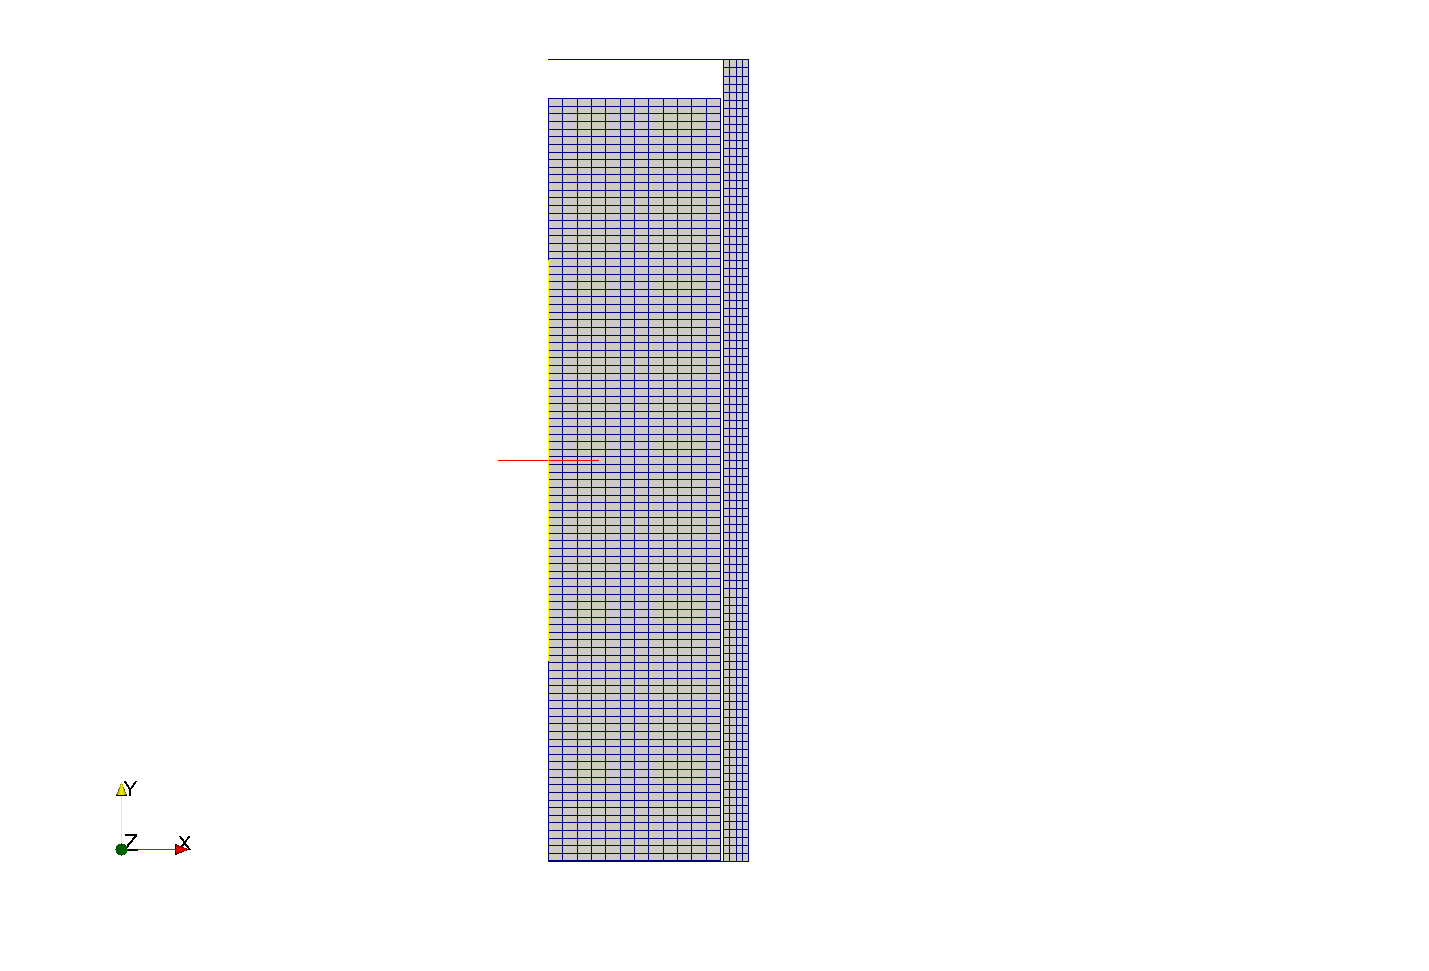
Figure 3: MT-4 and MT-6A LOCA Test Cases mesh (not to scale)
Material and Behavioral Models
The following material and behavioral models were used for the UO fuel:
UO2Thermal - NFIR: temperature and burnup dependent thermal properties.
UO2Sifgrs: fission gas release model.
ComputeFiniteStrainElasticStress and UO2ElasticityTensor: elastic mechanical behavior
UO2RelocationEigenstrain: relocation strains, relocation activation threshold power set to 5 kW/m
ComputeThermalExpansionEigenstrain: thermal expansion with a constant instantaneous thermal expansion coefficient
UO2VolumetricSwellingEigenstrain : volumetric expansion due to solid and gaseous swelling
For the cladding material, a constant thermal conductivity of 16 W/m-K was used and both thermal and irradiation creep were considered using the Limback model (Limbäck and Andersson, 1996). The following material and thermal behavior models were used for the Zircaloy-4 cladding:
HeatConductionMaterial: Thermophysical material properties
ZryCreepLOCAUpdate and ZryElasticityTensor: mechanical creep under LOCA conditions and elastic deformation behavior for Zircaloy-4
ComputeThermalExpansionEigenstrain: thermal expansion with a constant instantaneous thermal expansion coefficient
Input files
The BISON input and all supporting files (axial power profiles, etc.) for the MT-4 and MT-6A test rods are provided with the code distribution at bison/assessment/LWR/validation/LOCA_MT4_MT6A/analysis.
Execution Summary
Table 4: Execution summary
| Machine | Operating System | Code Version |
|---|---|---|
| SISD-LIN02 | LINUX | git commit 02c3169 on 2017-02-28 |
Results Comparison
Data from the LOCA experiment program in the NRU reactor was used to assess the code's capability to model cladding ballooning, flow blockage, and reflood cooling. The measured cladding inner surface temperature, rod internal pressure, and cladding hoop strain data were used in assessing the performance of BISON. A summary of the experimental and BISON results for both MT-4 and MT-6A tests at power level of 1.2 kW/m is provided in Table 5. To determine the failure/rupture time, the cladding failure model was used with the combined overstress and plastic instability as the failure criterion. Cladding rupture occurs slightly before reflood cooling for MT-4 test case and 2.47 seconds after reflood cooling for MT-6A test case. BISON predicts the rupture time and average rupture temperature reasonably well compared to the measured data. While the reported peak cladding temperature for MT-4 test is 1459 K, the measured data that was provided show a peak cladding temperature of 1150.29 K at elevation of 243.84 cm. The peak cladding temperature of 1150.29 K was used for comparison to BISON prediction instead of 1459 K. No post-irradiation examination data were available for Test MT-6A.
Table 5: Summary of Experimental Results for MT-4 and MT-6A
| Results | MT-4 | MT-6A | |
|---|---|---|---|
| Number of Ruptured Rods | 12 of 12 | 21 of 21 | |
| Peak Cladding Temperature (K) | |||
| Experimental | 1150.29 | 1175 | |
| BISON | 1073.83 (at 185.31 cm) | 1116.73 (at 183.39 cm) | |
| Average Rupture Temperature (K) | |||
| Experimental | 1077-1114 | 1050-1140 | |
| BISON | 1073.68 | 1116.59 | |
| Time to Rod Rupture (s) | |||
| Experimental | 52 to 58 | 58 to 64 | |
| BISON | 53.9006 | 59.1861 | |
| Rupture Elevation (mm) | |||
| Experimental | 2680 | Not Measured | |
| BISON | 1853.07 | 1853.32 | |
| Average Maximum Rupture | |||
| Hoop Strain (%) | Experimental | 72 | Not Measured |
| BISON | 12.94 | 15.51 | |
| Maximum Rupture | |||
| Hoop Strain (%) | Experimental | 99 | Not Measured |
| BISON | 12.94 | 15.51 | |
| Rod Pressure at Rupture (MPa) | |||
| Experimental | 5.58 to 6.48 | 6.07 to 7.93 | |
| BISON | 7.16 | 6.997 |
Cladding Inner Surface Temperature
The only cladding inner surface temperature data available for this experiment is from the use of thermocouples during the test. The cladding inner surface temperature data used for comparisons was an averaged temperature for different test rods at each elevation in each MT test to provide a representative cladding inner surface temperature histories. Figure 4 and Figure 5 show BISON's comparisons with measurement in the current evaluation for the MT-4 and MT-6A test at elevations of 182.88 cm and 187.96 cm, respectively. The MT4 test case did not run to completion at power level of 1.2 kW/m but did run to completion at power level of 1.1 kW/m. The MT-6A test case did not run to completion at both power level of 1.1 kW/m and 1.2 kW/m due large deformation in the cladding. The BISON results in Figure 4 and Figure 5 include the temperature comparison at both power level of 1.1 kW/m and 1.2 kW/m. The BISON results are shifted by 10 seconds so that it corresponds with the measured data of when the transient the start. The measured data show that the transient starts at 10 seconds. The BISON simulations start the transient at 0 second. BISON predicts the cladding inner surface temperature reasonably well compared to the measured data for elevation below 200 cm for both MT-4 and MT-6A tests. However, BISON underpredicts the measured results by a significant margin for elevation above 200 cm.
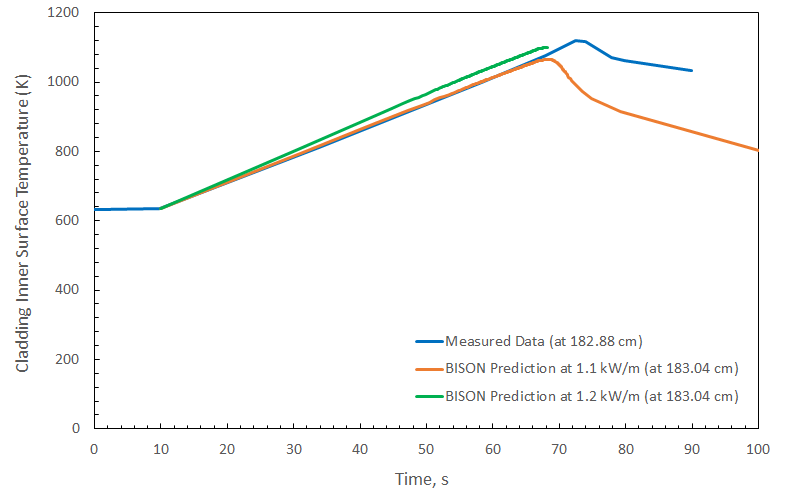
Figure 4: Cladding inner surface temperature comparisons for MT-4 test at elevation of 182.88 cm
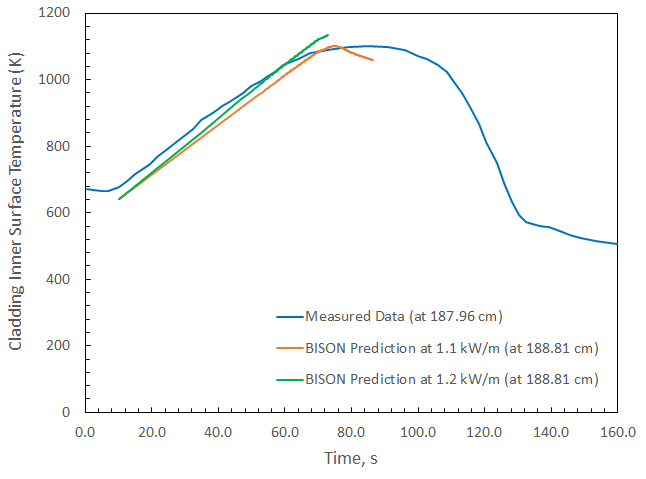
Figure 5: Cladding inner surface temperature comparisons for MT-6A test at elevation of 187.96 cm
Rod Internal Gas Pressure
The only rod internal gas pressure data available for this experiment is from the use of pressure transducers or pressure switches during the test. Prior to the transient, the plenum gas pressure were about 9.3 MPa and 9.15 MPa for MT-4 and MT-6A test, respectively. Figure 6 to Figure 7 show BISON's comparisons with measurement data for the MT-4 and MT-6A test rods. The BISON results are shifted by 10 seconds so that it correspond with the measured data of when the transient starts. BISON predicts the rod internal pressure reasonably well compared to the measured result for both test rods. At the time of rod failure, the MT-4 and MT-6A measured rod gas pressures were 5.6 to 6.5 MPa (peak values of 8.9 to 9.3 MPa) and 6.1 to 7.9 MPa (peak values of 8.9 to 9.3 MPa), respectively. The BISON predicted values of peak pressure are 10.06 MPa and 10.08 MPa with a failure pressure of 7.16 MPa and 6.997 MPa for MT-4 and MT-6A test cases, respectively.
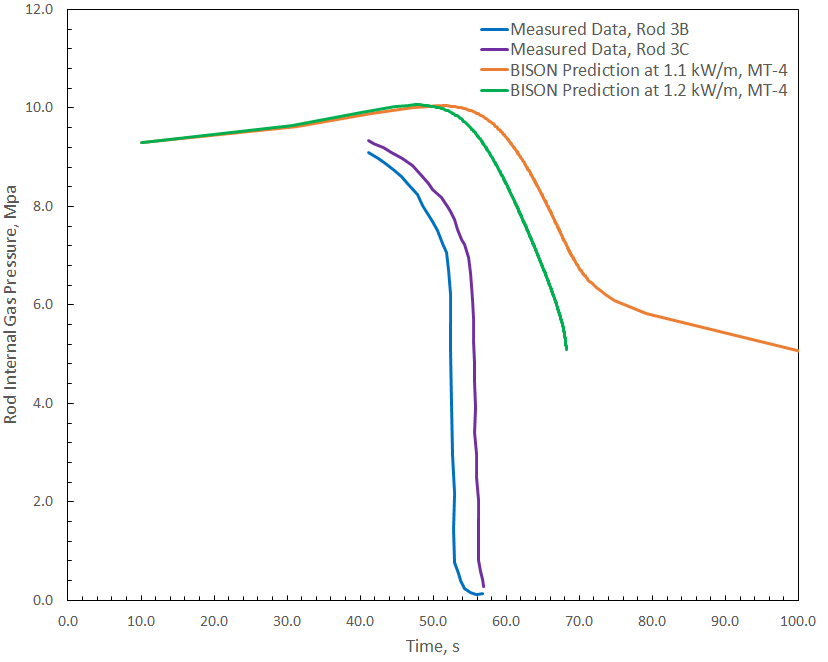
Figure 6: Rod internal pressure comparisons for MT-4
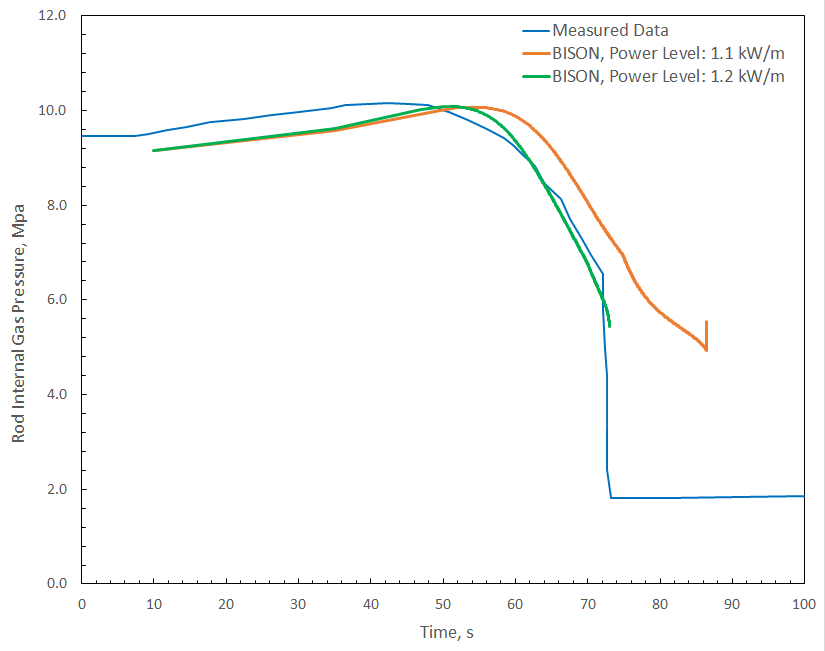
Figure 7: Rod internal pressure comparisons for MT-6A
Cladding Creep Strain
The calculated cladding hoop strain as a function of axial position is compared to measured data. Figure 8 show BISON's comparisons to the measured cladding hoop strain data for MT-4 test rod. The measured data showed the region of maximum ballooning for the MT-4 rods to be at elevation of approximately 2.54 m while BISON predicted maximum ballooning at about 1.85 m. BISON underpredicts the cladding hoop strain for MT-4 test rod. No cladding hoop strain data were available for MT-6A test.
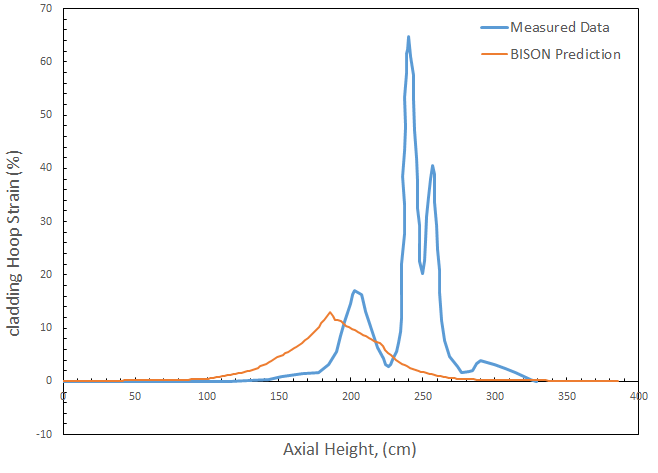
Figure 8: Cladding hoop strain comparisons for MT-4 test
Discussion
Based on the data presented above, several observations can be made regarding the results obtained from BISON analyses of the MT-4 and MT-6A test rods.
BISON consistently underpredicts the cladding inner surface temperature at elevation above 200 cm for both MT-4 and MT-6A test cases.
BISON predicts the rod internal pressure reasonably well for both MT-4 and MT-6A test cases.
BISON underpredicts the cladding hoop strain for the MT-4 test case.
The large deformation due to high cladding creep rate at high temperature and pressure during adiabatic heatup may cause the code to have difficulty converging. The timestep size for convergence was as small as 0.0000534 seconds.
Based on the evaluation of the MT-4 and MT-6A test cases, further evaluations of the cladding creep model at high temperature and pressure are needed to extend the code's simulation of LOCA.
References
- et al. C. L. Wilson.
Loca simulation in nru program: data report for the fourth materials experiment (mt-4).
Technical Report NUREG/CR-3272 (PNL-4669), Pacific Northwest Laboratory, July 1983.[BibTeX]
- et al. C. L. Wilson.
Large-break loca, in-reactor fuel bundle materials test mt-6a.
Technical Report PNL-8829, Pacific Northwest Laboratory, September 1993.[BibTeX]
- M. Limbäck and T. Andersson.
A model for analysis of the effect of final annealing on the in- and out-of-reactor creep behavior of zircaloy cladding.
In Zirconium in the Nuclear Industry: Eleventh International Symposium, ASTM STP 1295, 448–468. 1996.[BibTeX]