Fission Gas Behavior Separate Effects Experiments
Overview
Two separate experimental programs are used to evaluate the predictions of components of the fission gas behavior model, known as Simple Integrated Fission Gas Release and Swelling (SIFGRS), available in BISON (See UO2Sifgrs). These programs from White (White et al., 2006) and Baker (Baker, 1977) have been used in validation of fission gas models by several other research groups including Pastore et al. (2013), Pizzocri et al. (2018), and Barani et al. (2020).
Baker Experimental Database
Test Description
The data from Baker (1977) consists of measurements of the average bubble size and bubble number density from transmission electron microscropy (TEM) images of fuel samples irradiated to 23 MWd/kgU at different isothermal temperatures ranging from 1273 to 2073 K.
Model Description
The simulations performed in this work follow that of Pizzocri et al. (2018) where a small fuel sample is subject to a representative fission rate density of 110 m s for 5500 hours. An initial grain radius of 5 m was assumed for all cases. Grain growth was modeled using the GrainRadiusAux.
Geometry and Mesh
The fuel sample is taken as a 0.010.010.01 m and is modeled with a single HEX8 element.
Material and Behavioral Models
HeatConductionMaterial: constant or temperature dependent thermal properties
UO2Sifgrs: fission gas behavioral model
The options selected in SIFGRS are shown below:
[Materials<<<{"href": "../../../../syntax/Materials/index.html"}>>>]
  [fission_gas_behavior]
    type = UO2Sifgrs<<<{"description": "Recommended fission gas model to account for generation of fission gasses in nuclear fuel", "href": "../../../../source/materials/UO2Sifgrs.html"}>>>
    block<<<{"description": "The list of blocks (ids or names) that this object will be applied"}>>> = 0
    temperature<<<{"description": "Coupled temperature"}>>> = temperature
    fission_rate<<<{"description": "Coupled fission rate variable (fiss/m^3/s)"}>>> = fission_rate
    gbs_model<<<{"description": "Activates the grain-boundary sweeping model"}>>> = true
    grain_radius<<<{"description": "Coupled grain Radius"}>>> = grain_radius
    ig_bubble_model<<<{"description": "Select bubble evolution model"}>>> = NUCLEATION_RESOLUTION
    res_param_option<<<{"description": "Select resolution parameter"}>>> = HETEROGENEOUS_WHITE
    diff_coeff_option<<<{"description": "Select diffusion coefficient"}>>> = TURNBULL_D1_4D2_D3
    initial_porosity<<<{"description": "initial fuel porosity (/)"}>>> = 0.0
    output_properties<<<{"description": "List of material properties, from this material, to output (outputs must also be defined to an output type)"}>>> = 'bubble_concentration_intra bubble_radius_intra gas_concentration_bubble_intra'
    outputs<<<{"description": "Vector of output names where you would like to restrict the output of variables(s) associated with this object"}>>> = all
  []
[]Input Files
The BISON inputs for the Baker separate effects experiments are provided within the code repository at bison/assessment/LWR/validation/Separate_effects_FGB/analysis/Baker_TEM.
Results Comparison
Figure 1 and Figure 2 presents the calculated versus measured plots for bubble number density and bubble radius, respectively. Error bars correspond to 30% for bubble number density and to 50% for bubble radius, respectively Baker (1977).
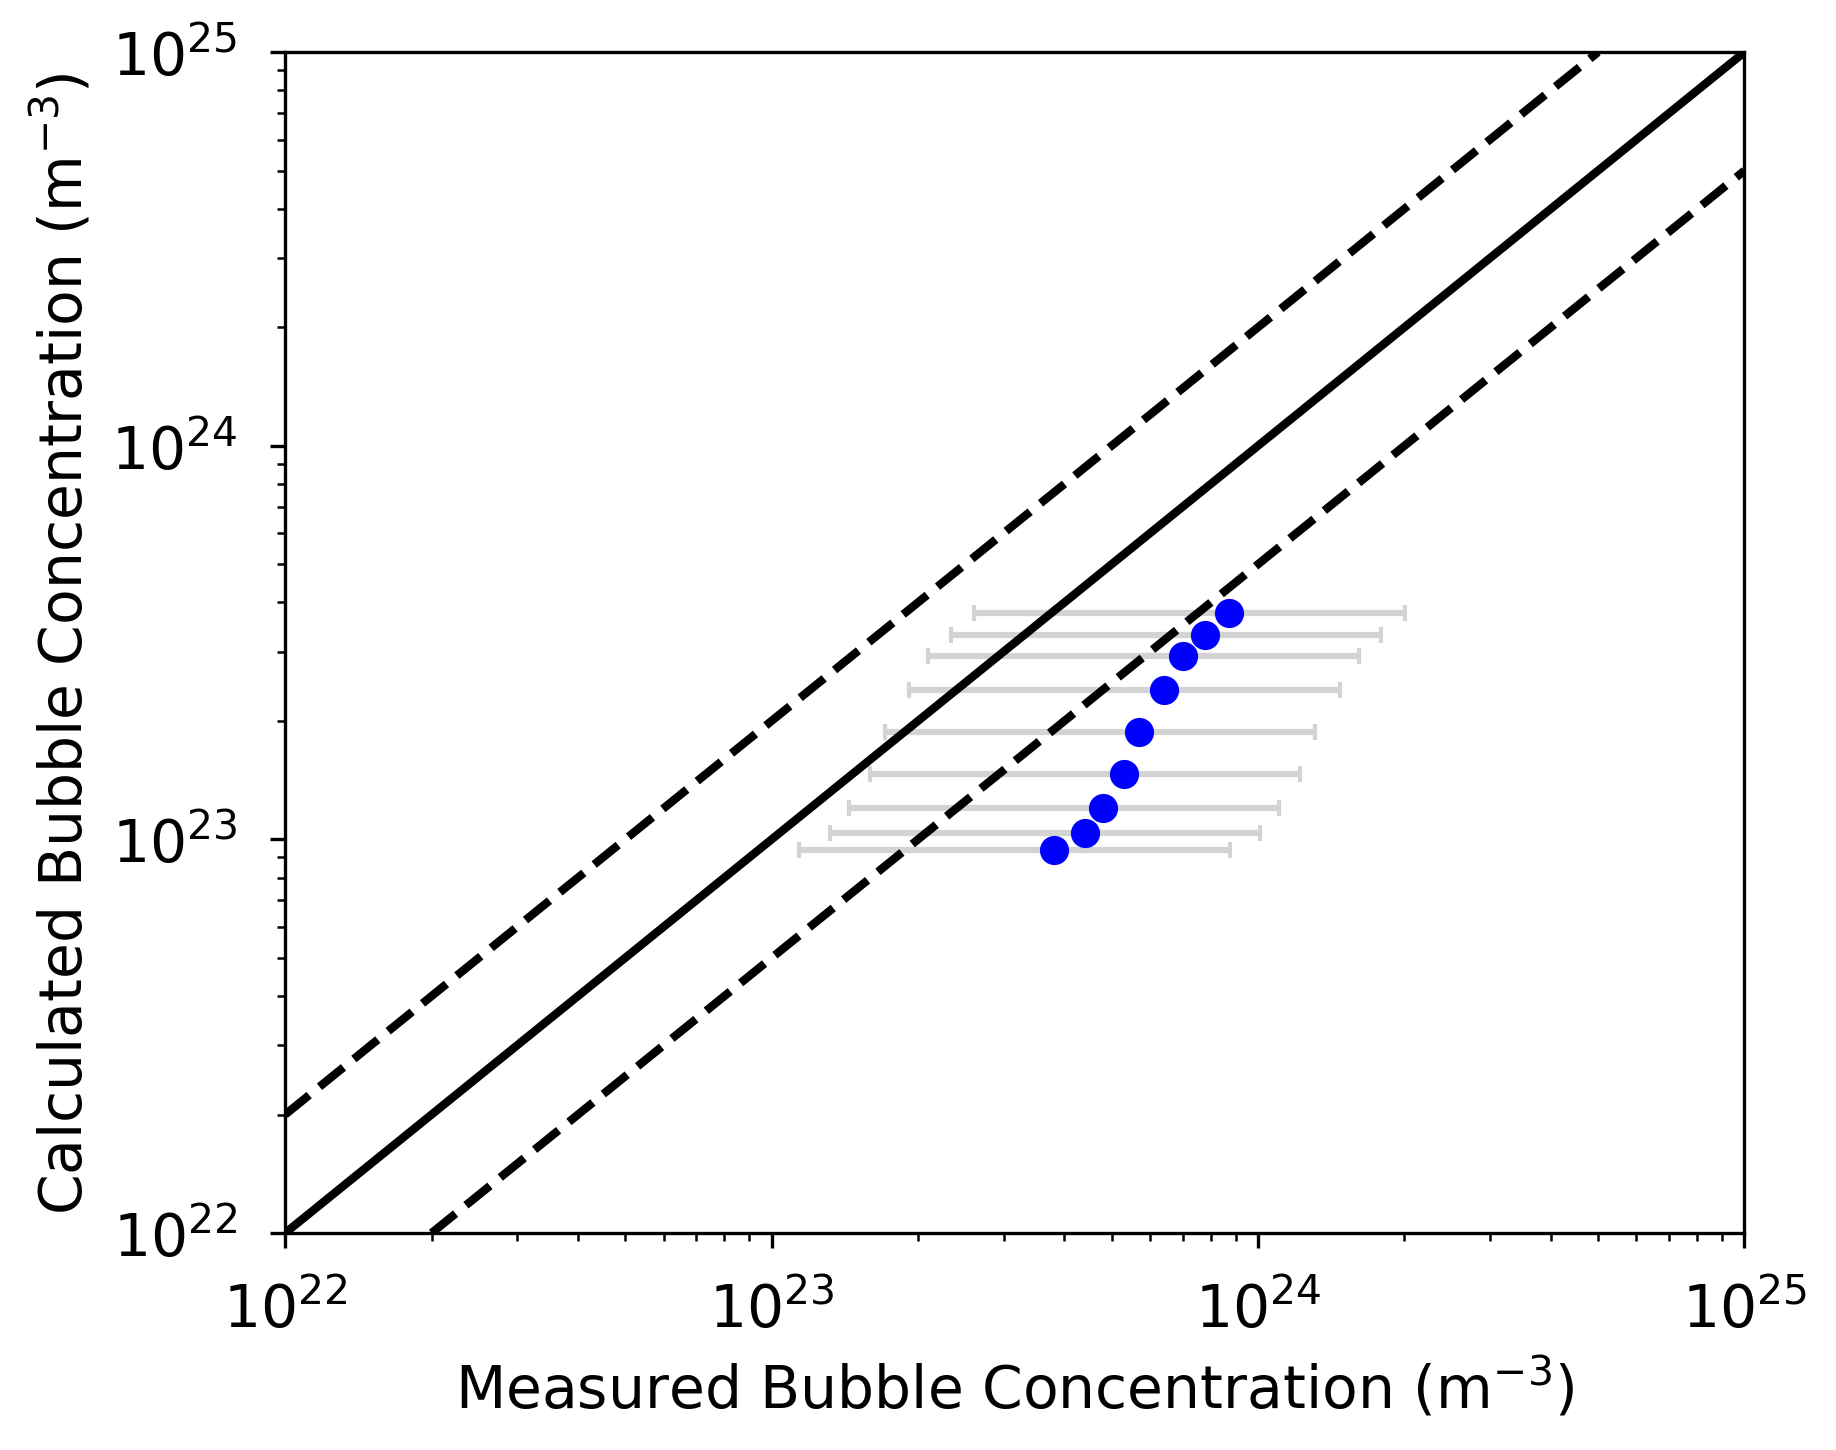
Figure 1: Comparisons between model calculations and experimental measurements from Baker (1977) for the bubble number density.
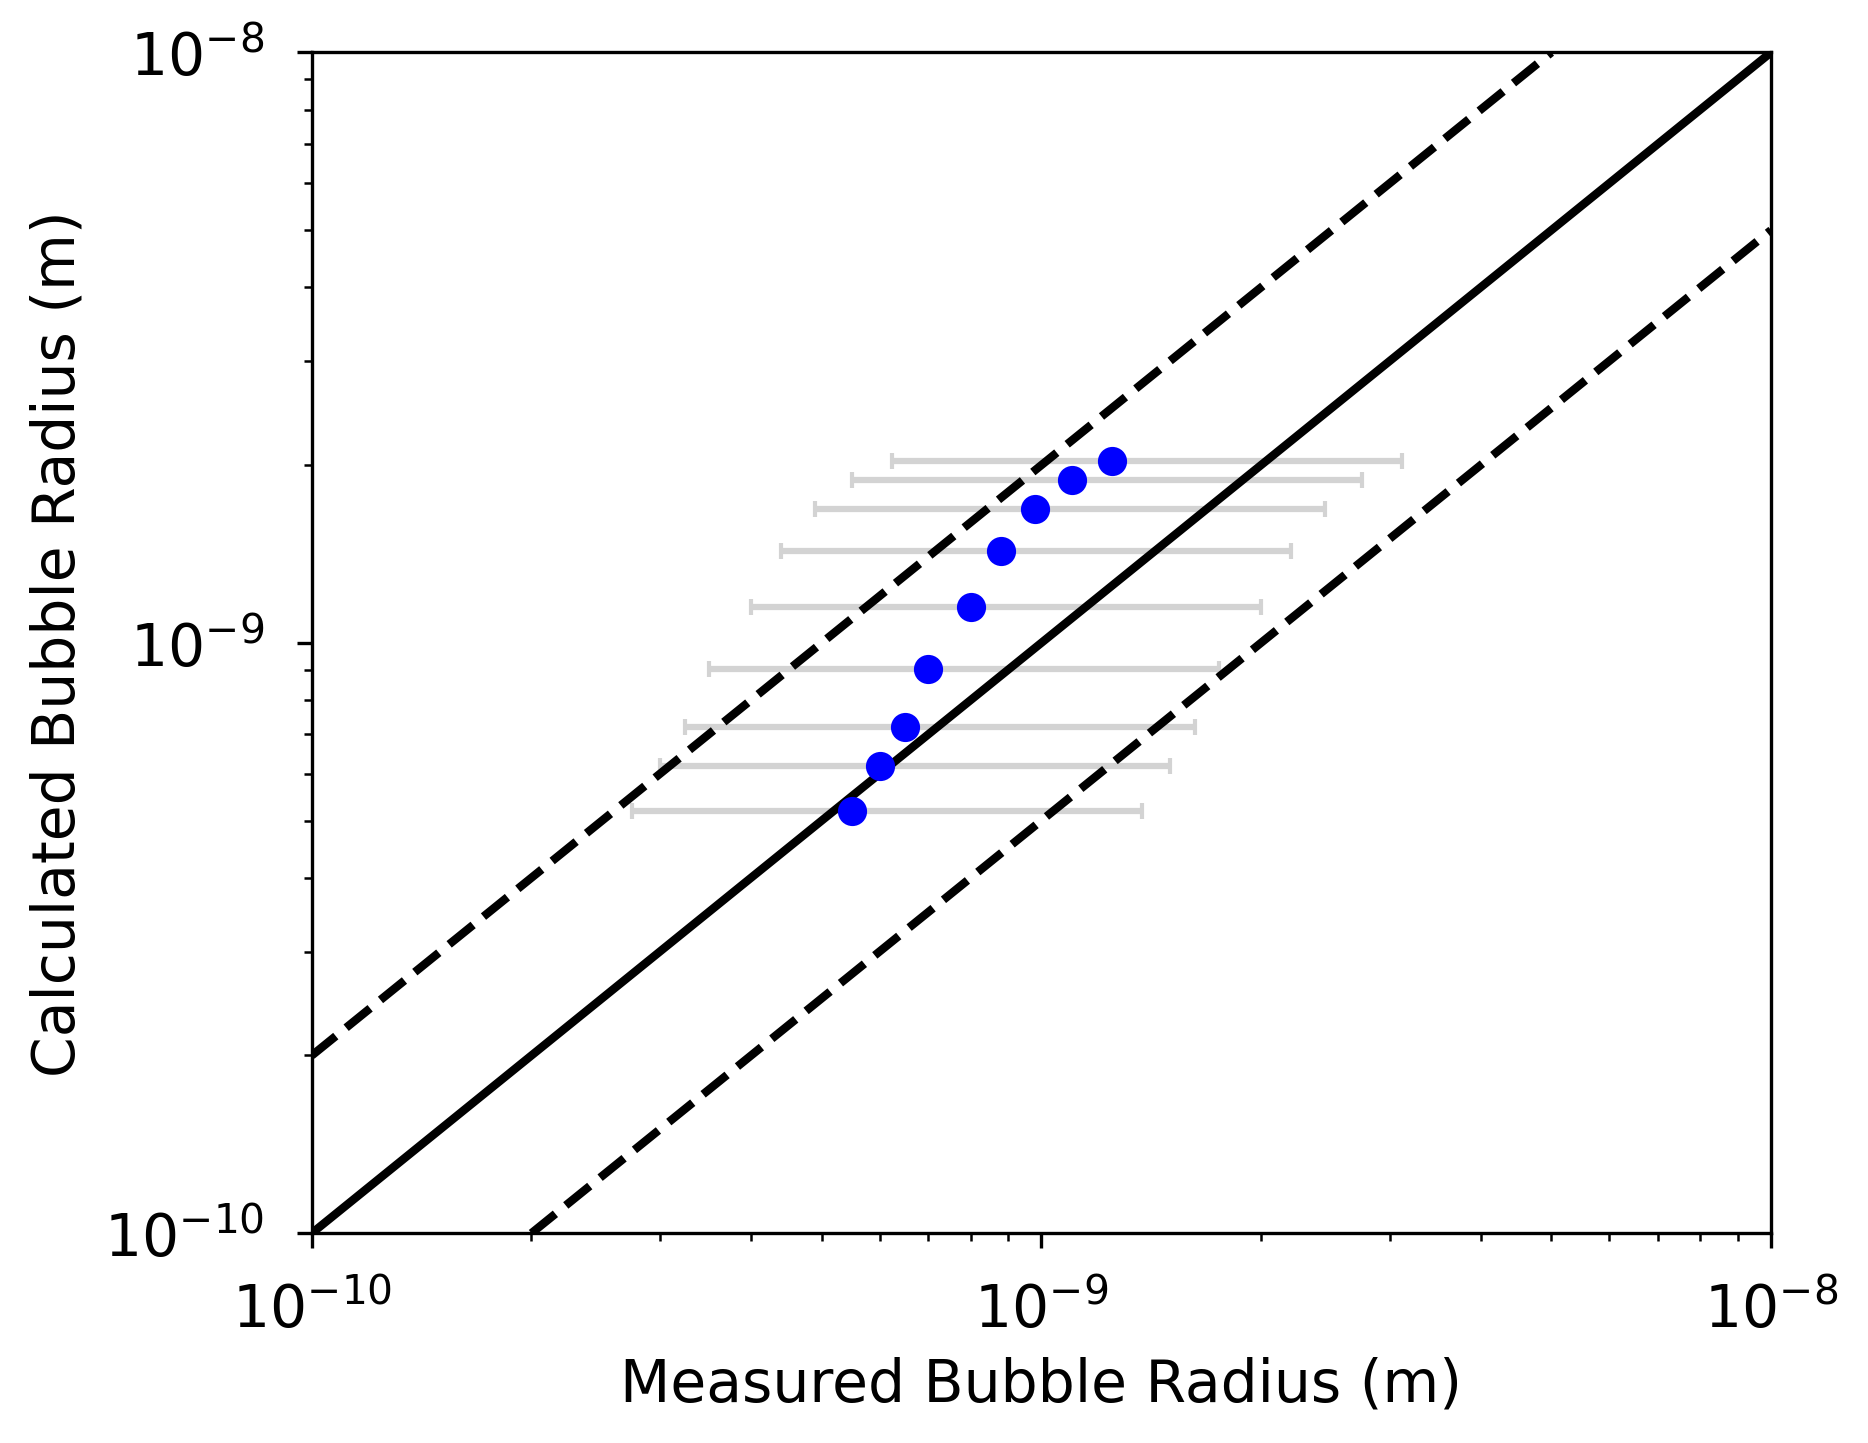
Figure 2: Comparisons between model calculations and experimental measurements from Baker (1977) for the bubble radius.
White Experimental Database
Test Description
scanning electron microscopy (SEM) measurements were performed at different radial positions on 12 UO AGR samples irradiated to burnups ranging between 9 and 21 MWd/kgU. A generic description of the power history supplied to the fuel during the ramp after base irradiation is provided in Figure 3. This schematic is similar to that presented in Barani et al. (2020). Values for the parameters shown in Figure 3 are tabulated in Table 1. The dashed lines bound different time periods and are represented by . The rods 4162 and 4163 are currently not included in the BISON validation suite. The sample IDs for 4135 and 4136 were subjected to multiple cycles and therefore have multiple rows included in the table.
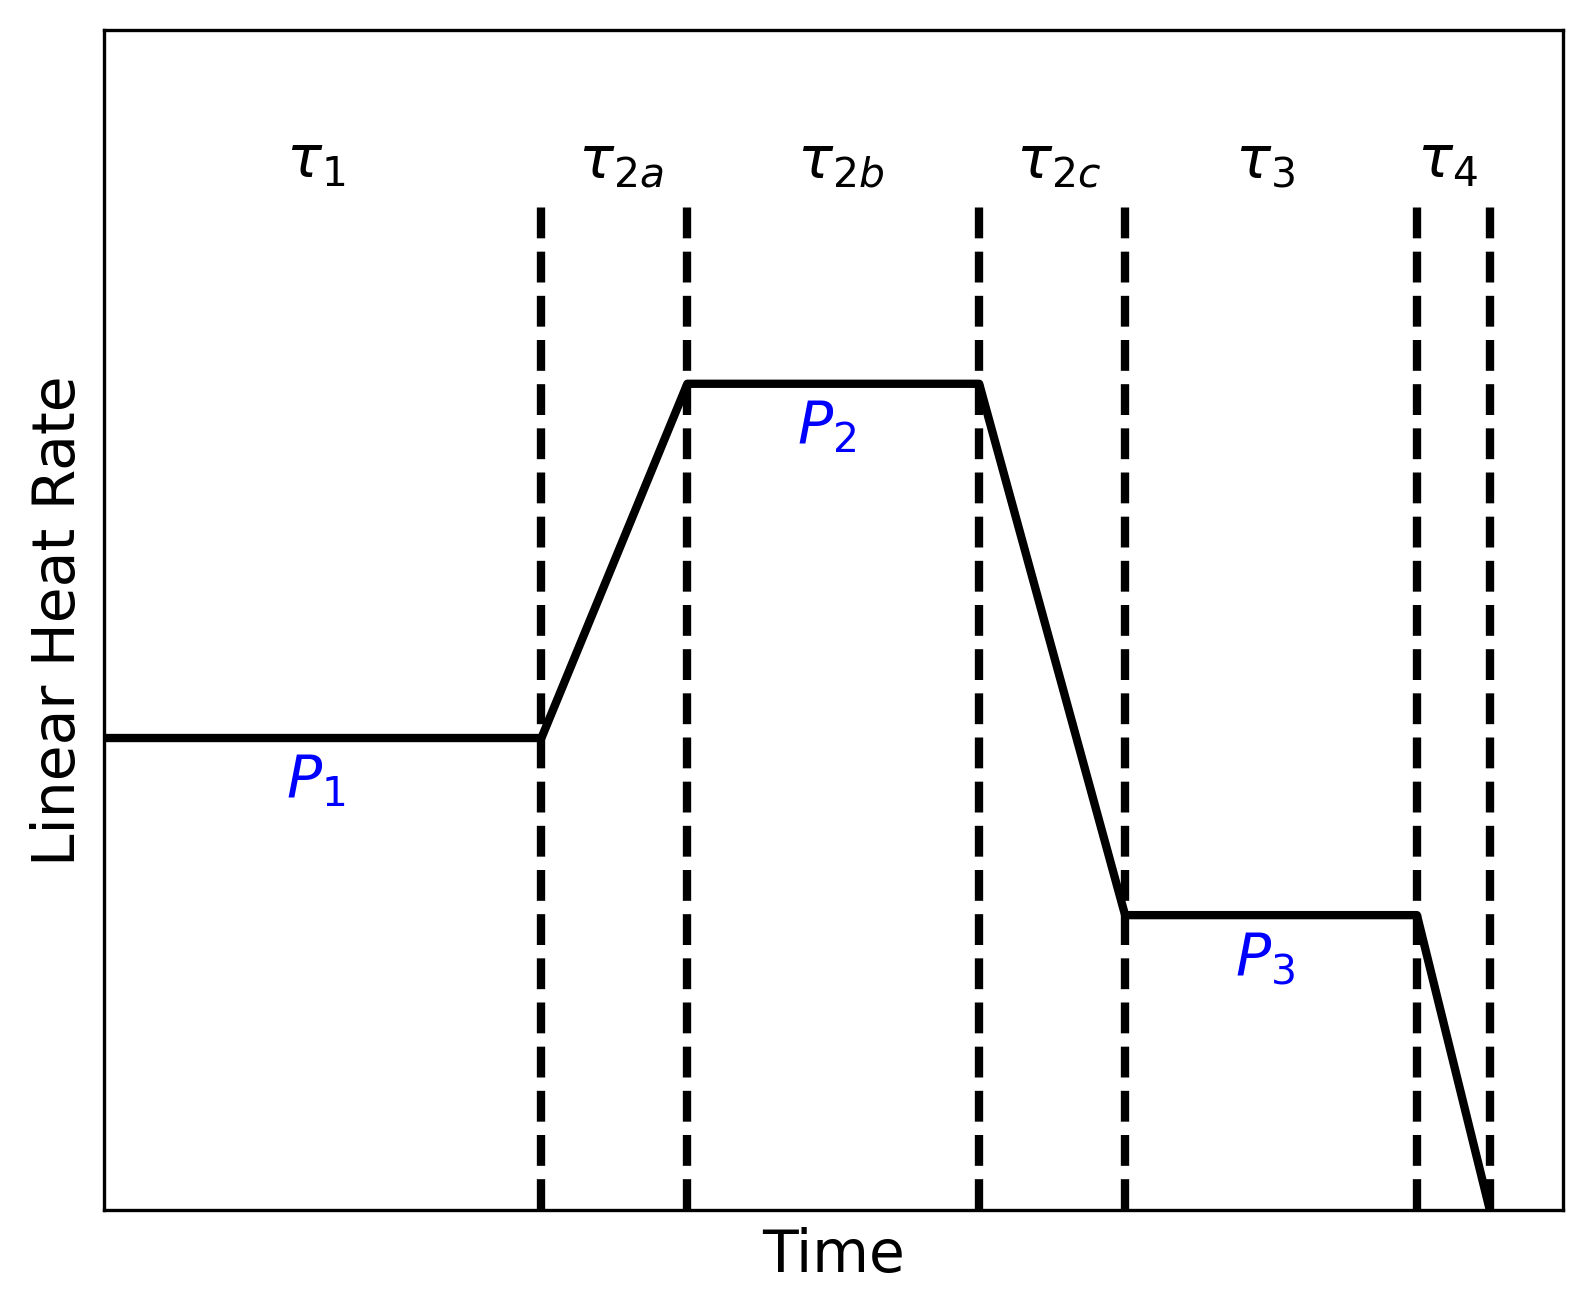
Figure 3: Schematic illustration of a generic ramp test used for the experiments from White et al. (2006). Values for the given parameters are provided in Table 1.
Table 1: Parameters used in the ramp power histories for which the SEM samples were subjected White et al. (2006)
| Rod ID | P (kW m) | (min) | P (kW m) | (min) | (s) | P (kW m) | |||
|---|---|---|---|---|---|---|---|---|---|
| 4000 | 14.0 | 12 days | 1.52 | 40.0 | 30.0 | 100 | 14.0 | 99.0 min | SCRAM |
| 4004 | 14.0 | 12 days | 1.97 | 40.0 | 2.38 | 90 | 14.0 | 99.0 min | SCRAM |
| 4005 | 14.0 | 12 days | 1.32 | 40.0 | 2.0 | - | SCRAM | - | - |
| 4064 | 20.0 | 15 weeks | 47.0 | 43.0 | 0.0 | - | SCRAM | - | - |
| 4065 | 19.3 | 3 weeks | 47.0 | 41.8 | 0.0 | - | SCRAM | - | - |
| 4135 | 18.5 | 1 week | 65.0 | 36.9 | 0.0 | 40 | |||
| 4135 | 13.0 | 8.0 min | 0.66667 | 36.9 | 1.33333 | 40 | |||
| 4135 | 13.0 | 0.0 | 0.66667 | 36.9 | 1.33333 | 40 | 16.0 | 28 days | 6 hr |
| 4136 | 16.5 | 1 week | 63.0 | 36.0 | 0.0 | - | |||
| 4136 | 36.0 | 0.0 | 2.0 | 39.0 | 0.0 | 40 | 16.0 | 27 days | 6 hr |
| 4140 | 16.5 | 1 week | 65.0 | 36.0 | 0.0 | 40 | 16.0 | 27 days | 6 hr |
| 4162 | 18.0 | 3 weeks | 45.0 | 40.0 | 0.0 | 40 | 18.0 | 6 min | - |
| 4163 | 18.0 | 3 weeks | 45.0 | 35.0 | 0.0 | 40 | 18.0 | 41 hou | - |
Model Description
Geometry and Mesh
The fuel sample is taken as a 0.010.010.01 m and is modeled with a single HEX8 element.
Material and Behavioral Models
HeatConductionMaterial: constant or temperature dependent thermal properties
UO2Sifgrs: fission gas behavioral model
The options selected in SIFGRS are shown below:
[Materials<<<{"href": "../../../../syntax/Materials/index.html"}>>>]
  [fission_gas_behavior]
    type = UO2Sifgrs<<<{"description": "Recommended fission gas model to account for generation of fission gasses in nuclear fuel", "href": "../../../../source/materials/UO2Sifgrs.html"}>>>
    block<<<{"description": "The list of blocks (ids or names) that this object will be applied"}>>> = 0
    gbs_model<<<{"description": "Activates the grain-boundary sweeping model"}>>> = true
    grain_radius<<<{"description": "Coupled grain Radius"}>>> = grain_radius
    temperature<<<{"description": "Coupled temperature"}>>> = temperature
    fission_rate<<<{"description": "Coupled fission rate variable (fiss/m^3/s)"}>>> = fission_rate
    ig_bubble_model<<<{"description": "Select bubble evolution model"}>>> = NUCLEATION_RESOLUTION
    ig_bubble_coarsening<<<{"description": "Select intra-granular diffusion algorithm"}>>> = WITH_COARSENING
    ig_fully_coupled<<<{"description": "Solving diffusion coupled to bubble evolution"}>>> = LOOSELY_COUPLED
    ig_diff_algorithm<<<{"description": "Select intra-granular diffusion algorithm"}>>> = polypole2
    diff_coeff_option<<<{"description": "Select diffusion coefficient"}>>> = TURNBULL_D1_4D2_D3
    transient_option<<<{"description": "Select transient release model]"}>>> = MICROCRACKING_BURNUP
    pellet_brittle_zone<<<{"description": "The name of the UserObject that computes the width of the brittle zone in the fuel pellet"}>>> = pbz
    pellet_id<<<{"description": "Coupled pellet ID"}>>> = pellet_id
    initial_burnup<<<{"description": "Burnup reached before annealing/separated effect experiment (GWd/tUO2)"}>>> = ${initial_burnup}
  []
[]Input Files
The BISON inputs and all supporting files for these cases are provided with the code distribution at bison/assessment/LWR/validation/Separate_effects_FGB/analysis/White_AGR_SEM.
Results Comparison
Figure 4, Figure 5, and Figure 6 present the calculated versus measured plots for the intragranular bubble number density, bubble radius, and swelling for the SEM database from White et al. (2006).
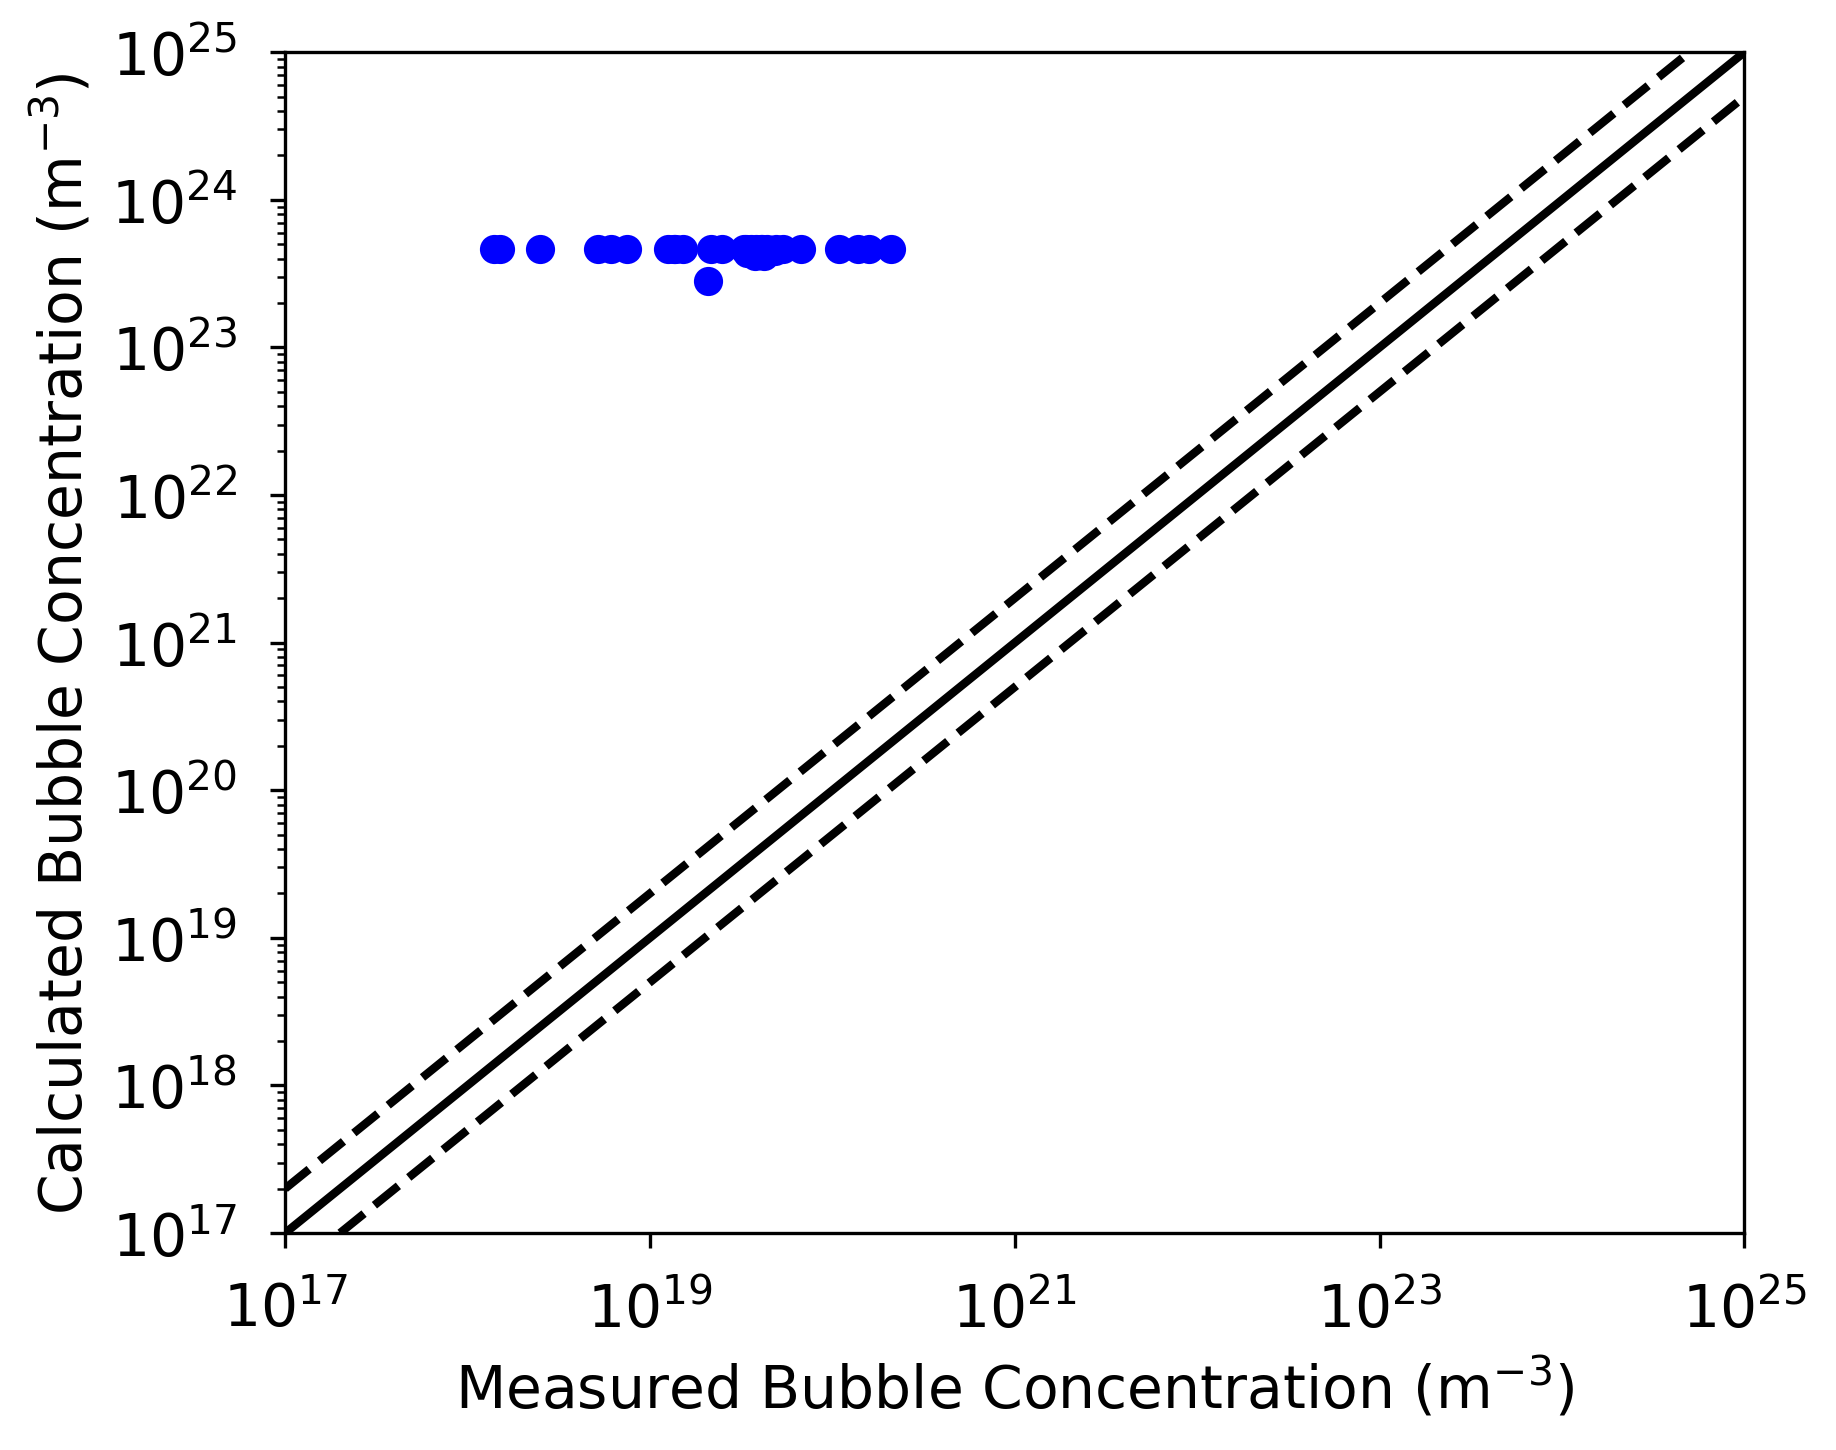
Figure 4: Comparisons between model calculations and experimental measurements from White et al. (2006) for the intragranular bubble number density.
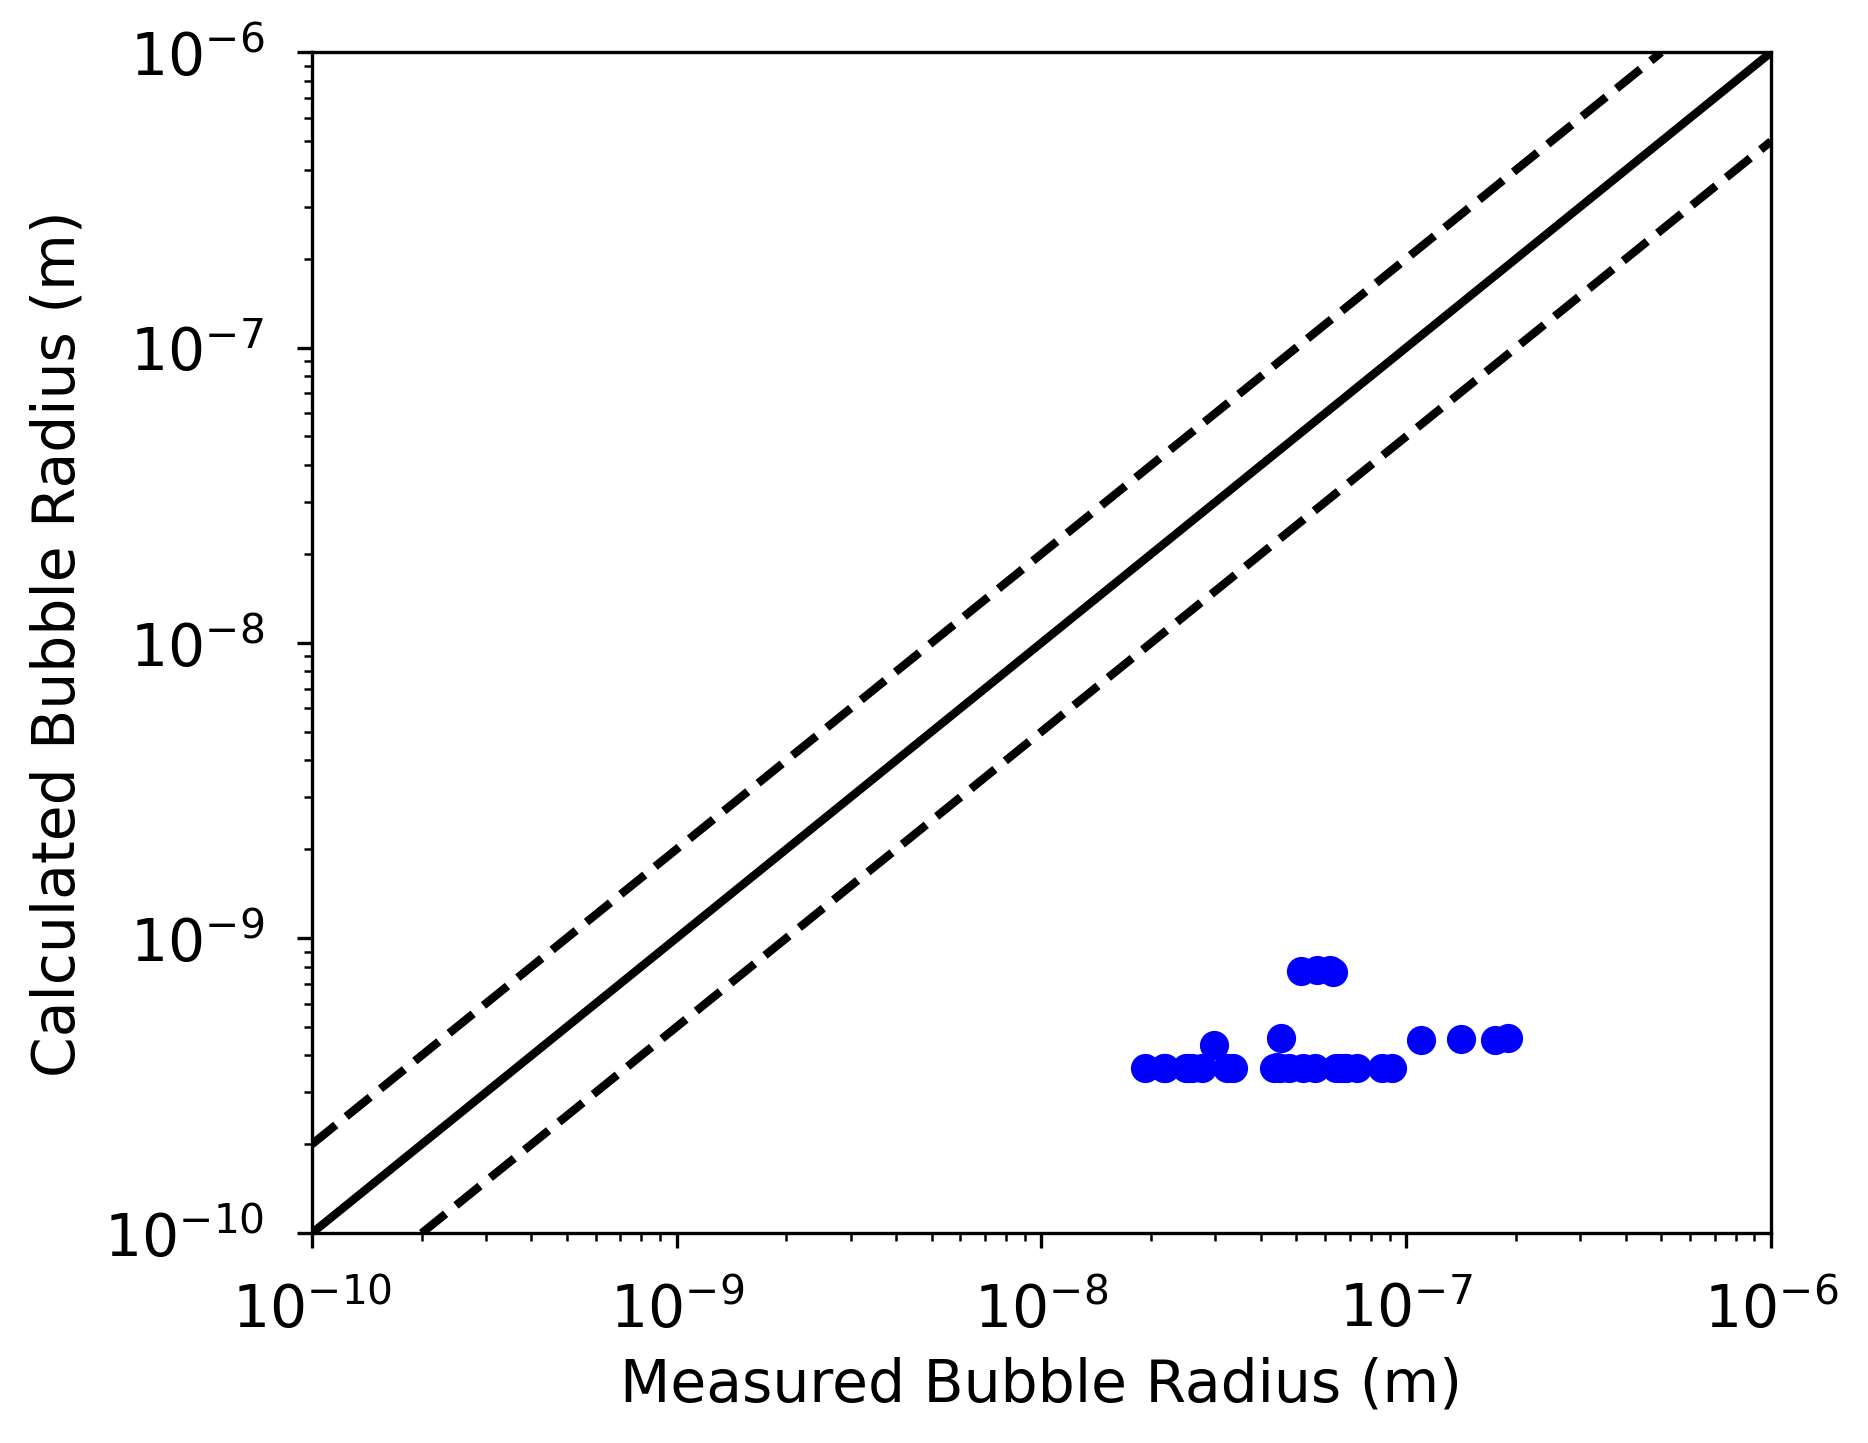
Figure 5: Comparisons between model calculations and experimental measurements from White et al. (2006) for the intragranular bubble radius.
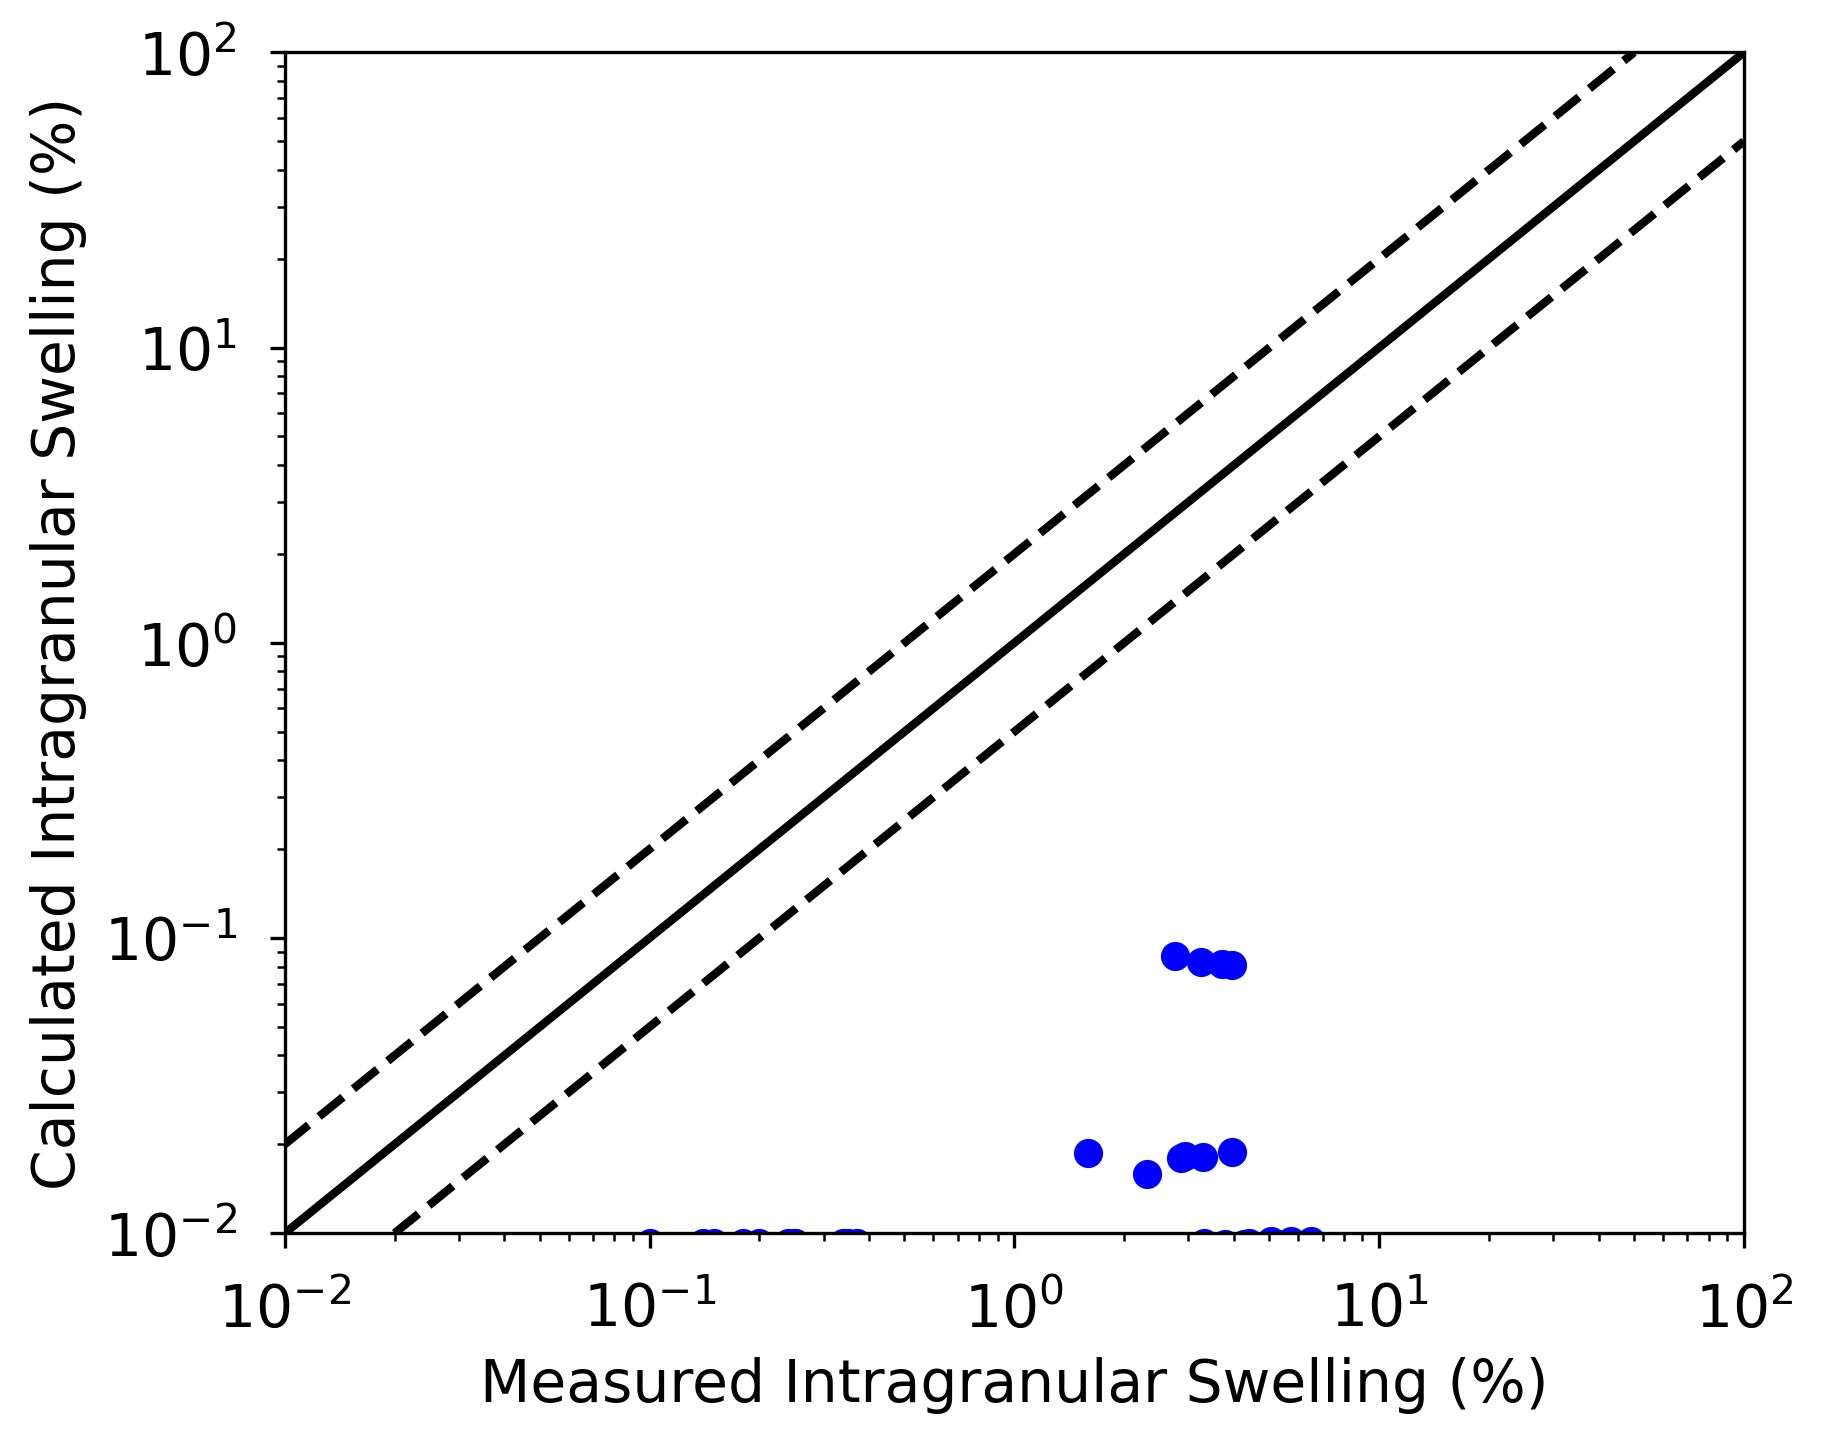
Figure 6: Comparisons between model calculations and experimental measurements from White et al. (2006) for the swelling.
References
- C. Baker.
The fission gas bubble distribution in uranium dioxide from high temperature irradiated SGHWR fuel pins.
Journal of Nuclear Materials, 66(3):283 – 291, 1977.[BibTeX]
- T. Barani, G. Pastore, A. Magni, D. Pizzocri, P. Van Uffelen, and L. Luzzi.
Modeling intra-granular fission gas bubble evolution and coarsening in uranium dioxide during in-pile transients.
Journal of Nuclear Materials, 538:152195, 2020.[BibTeX]
- G. Pastore, L. Luzzi, V. Di Marcello, and P. Van Uffelen.
Physics-based modelling of fission gas swelling and release in UO$_2$ applied to integral fuel rod analysis.
Nuclear Engineering and Design, 256:75–86, 2013.[BibTeX]
- D Pizzocri, G Pastore, T Barani, A Magni, L Luzzi, P Van Uffelen, SA Pitts, A Alfonsi, and JD Hales.
A model describing intra-granular fission gas behaviour in oxide fuel for advanced engineering tools.
Journal of Nuclear Materials, 2018.[BibTeX]
- R.J. White, R.C. Corcoran, and J.P. Barnes.
A Summary of Swelling Data Obtained from the AGR/Halden Ramp Test Programme.
Technical Report R&T/NG/EXT/REP/0206/02, British Nuclear Fuels Ltd., 2006.[BibTeX]