Riso-2 GE-m STR013
Overview
The Riso-2 GE-m test is a bump test that was carried out during the second Riso Transient Fission Gas Release Project in 1985 (R, 1986). The fuel pin STR013 was supplied by General Electric Company and was punctured and refabricated prior to the bump test. The STR013 fuel element measured 973.50 mm long tip-to-tip. The length of fuel irradiated during the bump test was 271 mm long. The fuel segment was base irradiated in the Millstone reactor at low powers ranging from 10-15 kW/m to a burnup of approximately 14 MWd/kgUO. A unique feature of the GE fuel used for this test is that it has a Niobium liner buried 0.075 mm from the clad inner diameter to resist failure due to Pellet-to-Cladding Interaction (PCI). For simplicity this liner was ignored in the simulation. The bump test was performed in the water-cooled HP-1 rig under BWR conditions in the DR3 test reactor.
Test Description
Rod Design Specifications
The rod specifications for the Riso-2 GE-m test is are summarized in Table 1.
Table 1: Rod specifications of rods STR013 and Riso-2 GE-m
| Base Fuel Rod (STR013) | Measurement | Unit |
|---|---|---|
| Tip-to-tip length | 0.9735 | m |
| Fuel Length | 0.778 | m |
| Active Fuel Length | 0.7557 | m |
| Nominal plenum height | 0.1444 | mm |
| Number of pellets in rod | 63 | |
| Fill gas composition | He | |
| Fill gas pressure (0 C) | 1.7 | MPa |
| Fuel | Measurement | Unit |
| Material | UO | |
| Enrichment | 2.89 | |
| Density | 95.73 | |
| Outer diameter | 10.89 | mm |
| Pellet geometry | Chamfered | |
| Grain diameter | 19.0 | m |
| Pellet Chamfer (both ends) | Measurement | Unit |
| Dish diameter | - | cm |
| Dish depth | - | cm |
| Chamfer width | 0.25 | mm |
| Chamfer depth | 0.38 | mm |
| Cladding | Measurement | Unit |
| Material | Zr-2 | |
| Outer diameter | 12.54 | mm |
| Inner diameter | 11.11 | mm |
| Wall thickness | 0.71 | mm |
| Refabricated Fuel Rod (GE-m) | Measurement | Unit |
| Fuel stack height | 0.271 | m |
| Number of pellets in rod | 23 | |
| Fill gas composition | He | |
| Fill gas pressure (0 C) | 0.49 | MPa |
Operating Conditions and Irradiation History
The base irradiation average power is shown in Figure 1. The average power during the bump test is shown in Figure 2. The axial power profile is nearly linear for the duration of the base irradiation and bump test. During the base irradiation there are small fluctuations in the axial power profile as a function of time. The axial profile for the duraction of the bump test is shown in Figure 3.
Table 2: Operational input parameters.
| Base Irradiation | ||
|---|---|---|
| Coolant inlet temperature | C | 287.8 |
| Coolant pressure | MPa | 7.24 |
| Power Ramps | ||
| Coolant inlet temperature | C | 289 |
| Coolant pressure | MPa | 7.2 |
Since the data was provided in a histogram form the input power profile used by BISON was modified to add additional points that are 10 s later than the supplied points to provide a short ramp time between plateaus in the histogram. The small duration of the ramp results in the use of a power profile that is very close to a histogram which permits the use of a piecewise linear algorithm. Moreover the first ramp in power has been broken down into 24 short ramps as per recommendations by ANATECH.
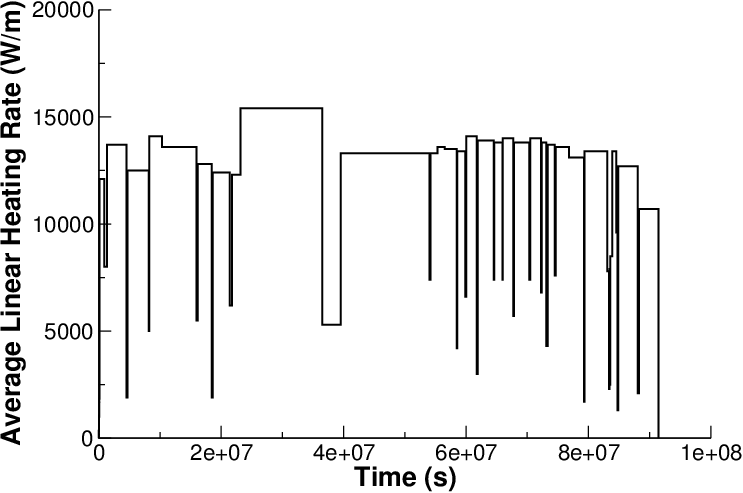
Figure 1: Base irradiation average power history for test pin STR013.
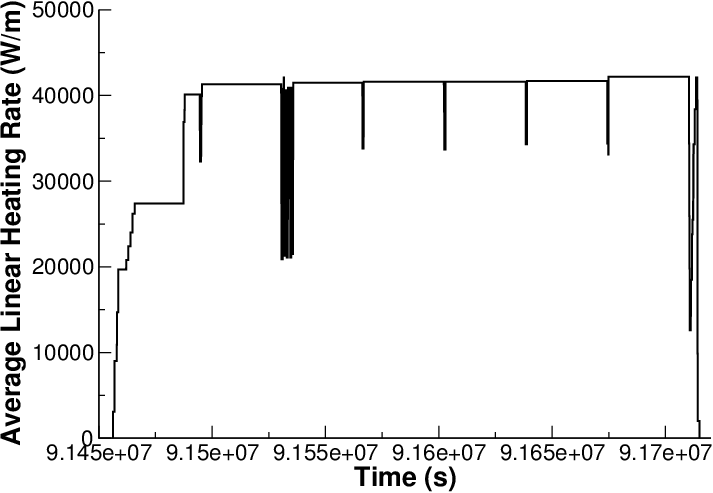
Figure 2: Average power history during the bump test.
The clad surface temperature was input as a function, along with the fast neutron flux from data provided in the FUMEX-III data set (IAEA, 2008-2012). The coolant inlet temperature and pressure for the base irradiation and power ramp is shown in Table 2. The clad tempature, fast flux, and axial peaking factors were modified such that the 10 s ramps are also applied. This ensures that the times used are consistent throughout the model.
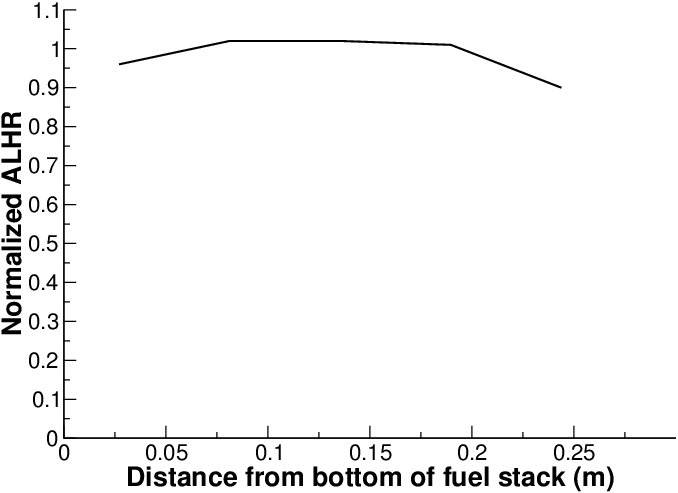
Figure 3: The axial power profile during the bump test
Model Description
Geometry and Mesh
The geometric parameters specified in Table 1 were used to create the mesh for this simulation. The fuel was meshed as a smeared fuel rod with 11 radial elements and 184 axial elements. Figure 4 shows a section of the mesh with a temperature contour plot. The geometry was such that the refabricated rod length was modeled during the base irradiation and bump test. To account for the correct gas volume the plenum height was adjusted such that the overall voidage including chamfers, radial gap, bottom plenum and top plenum were equivalent to the refabricated volume at the base irradiation. The lower plenum was equal to the length of the Hafnium Oxide insulator pellet that was not modeled. Due to fuel swelling and cladding creep down the initial volume at the beginning of the bump test is slightly lower than the refabrication.
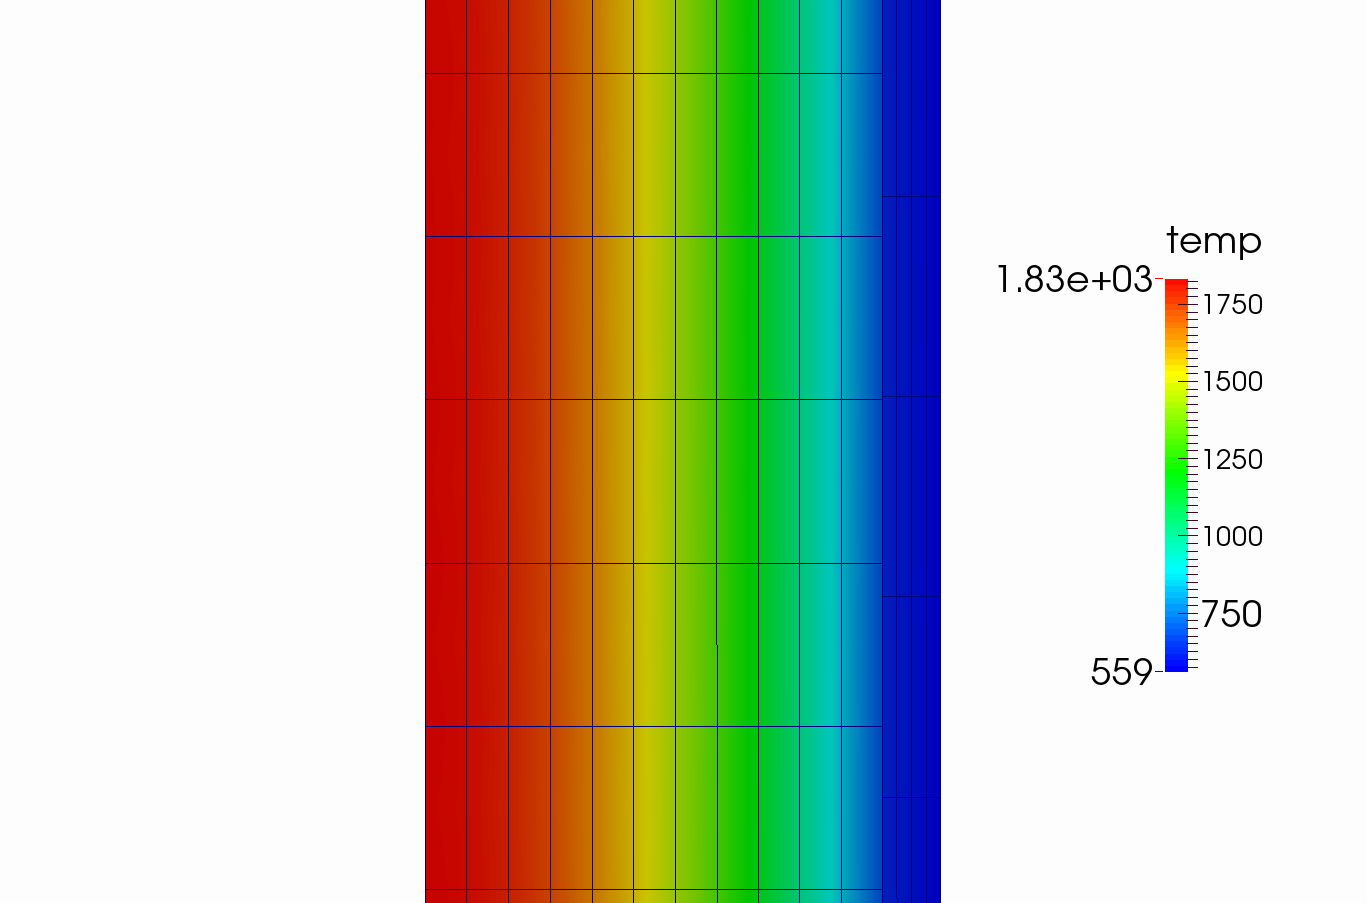
Figure 4: A section of the mesh with a temperature contour at t = 9.15662s.
Input files
The BISON input and all supporting files (power histories, axial power profile, fast neutron flux history, etc.) for this case are provided with the code distribution at bison/assessment/LWR/validation/ and bison/assessment/LWR/validation/Riso_GEM_STR013/analysis.
To avoid code duplication, the input files are structured in this format: A first base input file contains characteristics common to all the Riso cases: Riso_Base.i. A second base input file contains characteristics common to all the Riso case that do not use the action: Riso_Base_sub.i. Input files containing information specific to the fuel rod and the type of problem solving use the !include function to build a complete input file with the base files.
To run a specific assessment, such as the Riso GEm STR013, run: Riso_GEm_STR013.i.
Material and Behavioral Models
The thermal conductivity model used for the UO fuel was NFIR. The fuel was modeled as elastic and fuel swelling was coupled to the fission gas release model. In addition fuel relocation was modeled using an activation power of 5 kW/m. Fission gas release was modeled using the Sifgrs model with a transient burst release model. The following material and behavioral models for UO fuel were used:
UO2Thermal - NFIR: NFIR model for temperature and burnup dependent thermal properties
ComputeFiniteStrainElasticStress and UO2ElasticityTensor: elastic mechanical behavior
UO2RelocationEigenstrain: relocation strains, relocation activation threshold power set to 5 kW/m
ComputeThermalExpansionEigenstrain: thermal expansion with a constant instantaneous thermal expansion coefficient
UO2VolumetricSwellingEigenstrain : volumetric expansion due to solid and gaseous swelling
UO2Sifgrs: fission gas release model used with the gaseous swelling model
UO2VolumetricSwellingEigenstrain(Pastore et al., 2015)
The cladding material was modeled using a constant thermal conductivity of 16 W/m-K. Primary and secondary thermal, and irradiation creep were modeled. The following material and thermal behavior models were used for the cladding:
HeatConductionMaterial: Thermophysical material properties
ZryCreepLimbackHoppeUpdate and ZryElasticityTensor: mechanical creep and elastic deformation behavior
ZryIrradiationGrowthEigenstrain: ESCORE model for volumetric swelling due to irradiation exposure
ComputeThermalExpansionEigenstrain: thermal expansion with a constant instantaneous thermal expansion coefficient
Details and references for all of these models listed above can be found on the linked BISON documentation pages.
Results Comparison
Clad Diameter
A comparison of the predicted and measured rod outer diameter is shown in Table 3. The comparisons include the average rod diameter prior to the bump test, and the maximum and average changes in diameter during the test. No ridging was observed before the bump test and there is little to unclear evidence at the conclusion of the bump test.
Fission Gas Release
A comparison of the predicted and measured total fission gas release is shown in Figure 5. Since the base irradiation is a low power and low burnup irradiation BISON accurately predicts FGR of approximately zero percent. However, at the end of the ramp test, BISON under predicts the total FGR. Although the end of life percentage of FGR was underpredicted by the BISON simulation it is an acceptable result as it is within a factor of two of the experimental data.
Table 3: Clad diameter comparisions before and after the bump test.
| Average Diameter before Ramp (mm) | Maximum Diameter Increase (m) | Average Diameter Increase (m) | |
|---|---|---|---|
| Experimental | 12.536 | 8 | 5 |
| Refab T=273 K Smeared | 12.500 | 2.169 | -5.434 |
| Refab T=273 K Discrete | 12.500 | 2.740 | 2.120 |
| Refab T=373 K Smeared | 12.506 | 0.406 | -7.219 |
| Refab T=373 K Discrete | 12.506 | 0.470 | -7.216 |
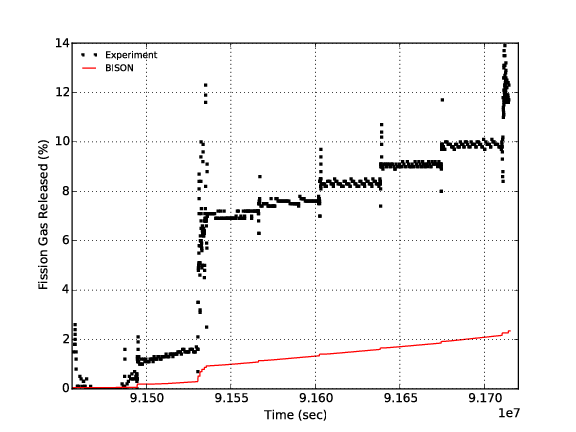
Figure 5: Fission gas release comparison of GE-m during the bump test.
Rod Internal Pressure
A comparison of the predicted and measured internal rod pressure is shown in Figure 6. BISON overpredicts the rod internal pressure from the beginning of the bump test. This is likely due with the refabrication calculation. The trend observed is encouraging as it is exactly the same as the experimental data. However, there appears to be an systematic offset in the internal pressure from the beginning of the bump test. Further investigation is required to determine the cause of this offset.
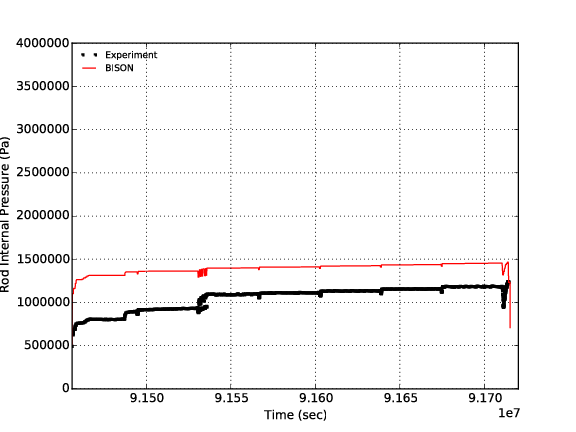
Figure 6: Rod internal pressure comparison of GE-m during the bump test.
Discussion
The comparisons of the results against the experimental data for the refabrication supplied in the FUMEX-III data were examined in the previous two subsections. It appears that the rod internal pressure strongly depends upon the refabrication temperature. Therefore a sensitivity analysis of the plenum pressure behavior as a function of the refabrication temperature was completed. By keeping the refabrication temperature and volume constant and varying the refabrication temperature the amount of initial moles after refabrication can be varied. BISON uses the refabrication data provided in the input file to calculate the initial moles after refabrication. Then the calculated moles and the postprocessor values for the average gas temperature and the gas volume are used to determine the internal gas pressure. To ensure the calculated pressure is close to the refabrication pressure the cladding temperature during the refabrication process must be set equal to the refabrication temperature. The sensitivity analysis was completed for refabrication temperatures of 273 K (given in the experimental data), 373 K, 473 K and 546 K. The rod internal pressure results of the analysis are presented in Figure 7 and the fission gas release results are presented in Figure 8.
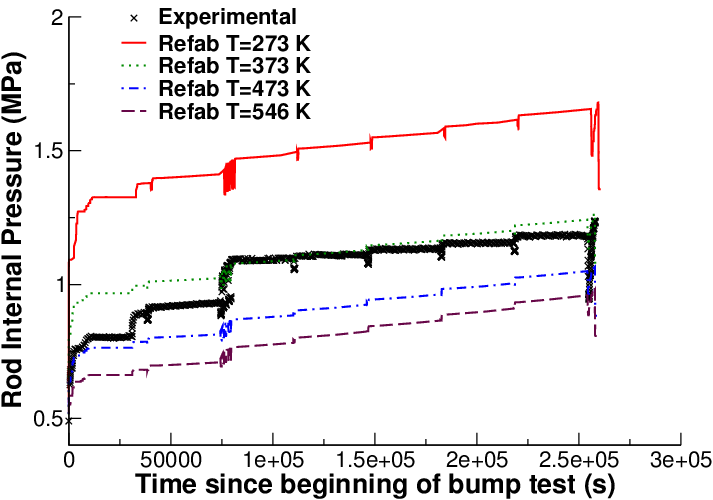
Figure 7: Sensitivity analysis of the rod internal pressure as a function of the refabrication temperature.
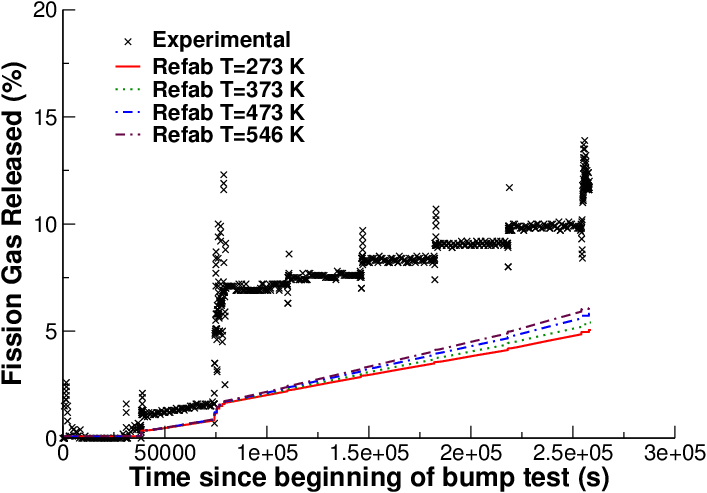
Figure 8: Sensitivity analysis of the fission gas release as a function of the refabrication temperature
Based upon the sensitivity analysis it is observed that as the refabrication temperature increases from 273 K to 546 K the internal rod pressure decreases and the fission gas released increases. This is expected because by changing the refabrication time the number of moles decreases. Less initial moles results in a lower internal rod pressure. The increasing temperature contributes to the increase fission gas release that is observed. The key takeaway of the sensitivity analysis is that the internal rod pressure for the duration of irradiation is strongly influenced by the refabrication temperature, or more importantly the difference between the refabrication temperature and the cladding temperature after refabrication. For example if the cladding temperature is brought down to 273 K during the refabrication process to be equal to the internal gas temperature. Once refabrication is complete the cladding surface temperature is increased to 562 K (the supplied boundary condition). This change in temperature is more than double the refabrication temperature and by the ideal gas law when the volume and initial moles remain relatively constant, the pressure more than doubles. Therefore, the largest contributing factor to the rod internal pressure discrepancy is the difference between the reported refabrication temperature and the cladding boundary condition.
The refabrication data is provided to calculate the initial moles in the void volume within the rod. Then using the gas volume and temperature postprocessors the plenum pressure is calculated using the determined initial moles. By examining the ideal gas law it should not matter what temperature the refabrication pressure is reported at because the refabrication volume remains constant. However, to correctly model the evolution of the rod internal pressure, the temperature at which the refabrication was completed at is required to ensure the temperature change from refabrication to bump test operation is correct.
References
- IAEA.
Improvement of Computer Codes Used for Fuel Behaviour Simulation (FUMEX-III): Report of a Coordinated Research Project 2008-2012.
Technical Report IAEA-TECDOC-1697, International Atomic Energy Agency, 2008-2012.[BibTeX]
- G. Pastore, L.P. Swiler, J.D. Hales, S.R. Novascone, D.M. Perez, B.W. Spencer, L. Luzzi, P. Van Uffelen, and R.L. Williamson.
Uncertainty and sensitivity analysis of fission gas behavior in engineering-scale fuel modeling.
Journal of Nuclear Materials, 465:398–408, 2015.[BibTeX]
- R.
The Risø Transient Fission Gas Release Project: Bump Tests with GE Fuel.
Technical Report Riso-TFGP-R10, Risø, June 1986.[BibTeX]