OSIRIS J12-5
Overview
This test is of a segmented PWR rod base-irradiated in the Electricity of France (EDF) Gravline 5 PWR (IAEA, 2008-2012). The segment was then re-fabricated and ramp-tested in the French Alternative Energies and Atomic Energy Commission (CEA) OSIRIS reactor to investigate PCMI resistance. This experiment was chosen because it allows for an evaluation of several aspects of the code, including fully coupled thermo-mechanics, contact, and several nonlinear material models.
Test Description
Rod Design Specifications
The geometric input parameters for the OSIRIS J12 test are summarized in Table 1.
Table 1: OSIRIS J12 Test Rod Specifications
| Fuel Rod | Measurement | Unit |
|---|---|---|
| Overall length | 0.5224 | m |
| Fuel stack height | 432.95 | m |
| Nominal plenum height | 89.44 | mm |
| Number of pellets per rod | 32 | |
| Fill gas composition | He | |
| Fill gas pressure | 2.6 | MPa |
| Fuel | Measurement | Unit |
| Material | UO | |
| Enrichment | 4.5 | |
| Density | 95.73 | |
| Outer diameter | 8.192 | mm |
| Pellet geometry | Dished | |
| Grain diameter | 10 | m |
| Pellet Dishing (no chamfers) | Measurement | Unit |
| Dish diameter | 6 | mm |
| Dish depth | 0.32 | mm |
| Cladding | Measurement | Unit |
| Material | Zr-2 | |
| Outer diameter | 9.5 | mm |
| Inner diameter | 8.36 | mm |
| Wall thickness | 0.57 | mm |
Operating Conditions and Irradiation History
The approximately 0.522 m segmented Zircaloy-4 clad rod was irradiated for 2 cycles in the EDF Gravline 5 PWR to a final discharge burn-up of 23.852 MWd/kgU. The average powers in the 2 cycles were approximately 16 and 23 kW/m. The rod segment designated J12-5, which was irradiated in the fifth span from the lower end of the assembly, was refabricated with new end plugs without altering either the fuel column or the internal fill gas. After a conditioning period of 762 minutes at 21 kW/m, the power was increased quickly (9 kW/m/min.) and held at 39.5 kW/m for 739 minutes. The axial profile was flat during base irradiation. The peaking factors during the bump test varied from approximately 0.75 at the ends of the segment to 1 at the center. The power history is presented in Figure 1, and the power ramp is shown in Figure 2. The initial fill-gas (Helium) pressure was 2.6 MPa, and the coolant pressure was 15.5 MPa. The external clad temperature was defined as a function of time and constant in space over the section of rod, the specified clad temperature in Figure 3 was used in this simulation. The clad temperature was about 585 K during base irradiation and about 615 K during the ramp. The fast neutron flux in the clad was supplied via input using experimental data supplied with the experiment. Operational input parameters are summarized in Table 2.
Table 2: Operational input parameters.
| Base Irradiation | ||
|---|---|---|
| Coolant inlet temperature | C | |
| Coolant pressure | MPa | 15.5 |
| Fast neutron flux | n/(ms) per (W/m) | 4.8 |
| Power Ramp | ||
| Coolant inlet temperature | C | |
| Coolant pressure | MPa | 14.7 |
| Fast neutron flux | n/(ms) per (W/m) | 4.8 |
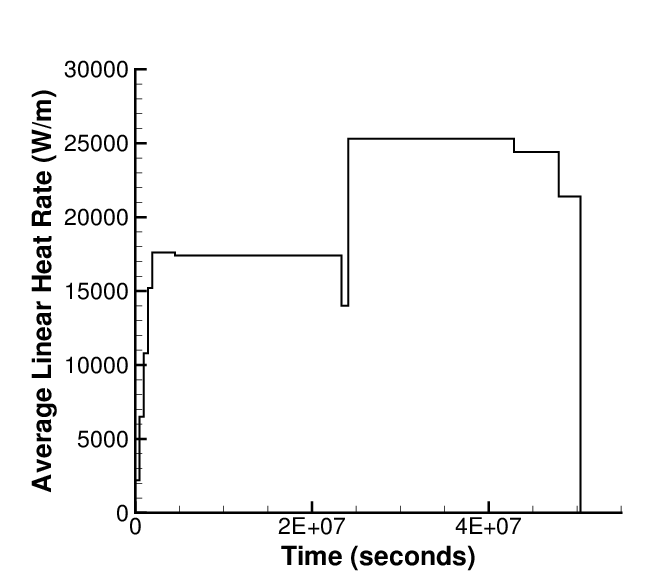
Figure 1: OSIRIS J12 power history in the Gravlines 5 PWR.
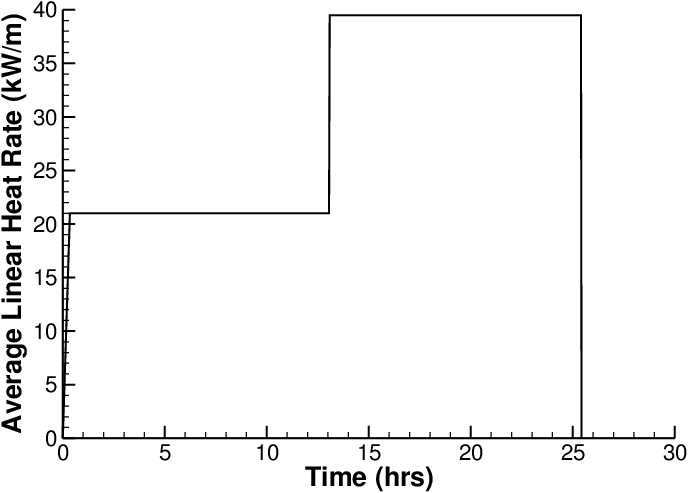
Figure 2: OSIRIS J12 power ramp
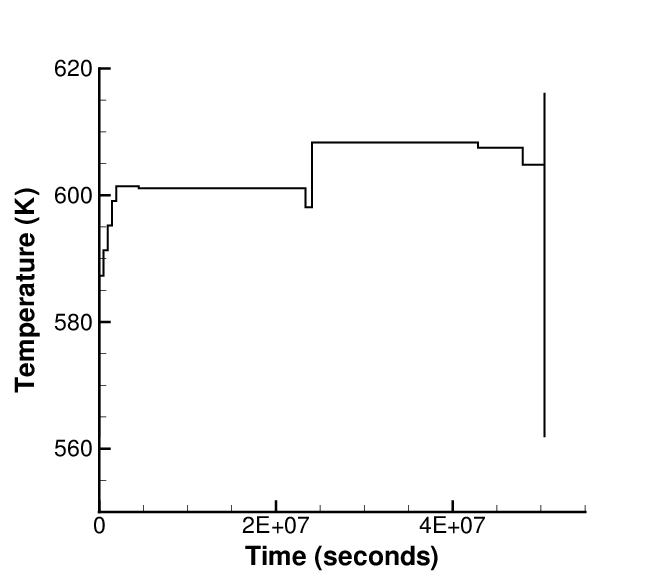
Figure 3: OSIRIS J12 clad temperature
Model Description
Geometry and Mesh
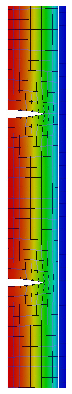
Figure 4: OSIRIS J12-5 mesh with temperature contour.
The rod specifications in Table 1 were used as input for the geometry for this simulation. The J12-5 rod was modeled as a 2D-RZ axisymmetric discrete pellet mesh with quadratic elements. Each pellet consisted of 16 axial elements and 9 radial elements. The clad was meshed with 4 elements through the thickness. Figure 4 is a section of the mesh with a temperature contour.
Material and Behavioral Models
The following material and behavioral models were used for the fuel:
UO2Thermal - NFIR: For temperature and burnup dependent thermal properties.
ComputeFiniteStrainElasticStress and UO2ElasticityTensor: elastic mechanical behavior
UO2VolumetricSwellingEigenstrain: volumetric expansion due to solid and gaseous swelling
UO2RelocationEigenstrain: relocation strains, relocation activation threshold power set to 5 kW/m
ComputeThermalExpansionEigenstrain:thermal expansion with a constant instanteous thermal expansion coefficient
UO2Sifgrs: fission gas release model used with the gaseous swelling model
UO2VolumetricSwellingEigenstrain
For the clad material, a constant thermal conductivity of 16 W/m-K was used and both thermal (primary and secondary) and irradiation creep were considered. The following material and thermal behavior models were used for the cladding:
HeatConductionMaterial: Thermophysical material properties
ZryCreepLimbackHoppeUpdate and ZryElasticityTensor: mechanical creep and elastic deformation behavior for Zircaloy-2
ZryIrradiationGrowthEigenstrain: ESCORE model for volumetric swelling due to irradiation exposure
ZryThermalExpansionMATPROEigenstrain: thermal expansion of Zircaloy with the MATPRO model
Input files
The BISON input and all supporting files (power histories, axial power profile, fast neutron flux history, etc.) for this case are provided with the code distribution at bison/assessment/LWR/validation/OSIRIS_J12/analysis.
Results Comparison
Clad Diameter
A comparison of the predicted and measured rod outer diameter is shown in Figure 5. The solid blue line is the as-manufactured rod diameter, prior to irradiation. The experimental data, shown as "+" (post-ramp) and "x" (pre-ramp) symbols, indicate the measured average rod diameter at both the end and middle fuel pellet locations, giving an indication of rod ridging due to pellet hour-glassing. The green solid line is the predicted rod diameter following the power bump and the red solid line is the predicted rod diameter prior to the ramp.
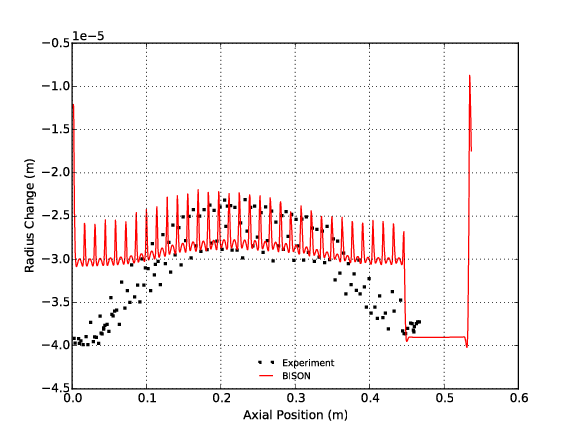
Figure 5: OSIRIS J12 experimental measurements and BISON calculation results from before and after the power ramp.
BISON under predicts clad creep down resulting in a larger than measured diameter. The overall shape of the rod after the ramp is captured well with BISON, as well as the clad ridging caused by the hour glassing (bamboo effect) of the discrete pellets.
References
- IAEA.
Improvement of Computer Codes Used for Fuel Behaviour Simulation (FUMEX-III): Report of a Coordinated Research Project 2008-2012.
Technical Report IAEA-TECDOC-1697, International Atomic Energy Agency, 2008-2012.[BibTeX]