OSIRIS H09
Overview
The OSIRIS H09 test rod is a standard full length PWR rod that was irradiated for 4 cycles in the Electricity of France (EDF) Cruas 2 PWR to a final discharge rod average burn-up of 46.06 MWd/kgU (OECDNEDB, 2002). This experiment was chosen for analysis because of the availability of measured data for evaluation of several fuel rod performance characteristics including fission gas release, cladding hydrogen content, fuel column length changes, rod growth, oxide thickness, rod internal pressure, whole pellet density, end-of-life internal free volume, and radial distribution of Cs, Nd, Pu and Xe.
Test Description
Rod Design Specifications
The geometric input parameters for the OSIRIS H09 rod are summarized in Table 1.
Table 1: OSIRIS H09 Test Rod Specifications.
| Fuel Rod | Measurment | Unit |
|---|---|---|
| Overall length | 3.8517 | m |
| Fuel stack height | 3.66038 | m |
| Nominal plenum height | 0.13932 | m |
| Fill gas composition | He | |
| Fill gas pressure | 3.1 | MPa |
| Fuel | Measurment | Unit |
| Material | UO | |
| Enrichment | 3.249 | |
| Density | 95.31 | |
| Outer diameter | 8.190 | mm |
| Nominal diametral gap | 160 | m |
| Average grain size | 9.060 | m |
| Cladding | Measurment | Unit |
| Material | Zr-4 | |
| Outer diameter | 9.508 | mm |
| Inner diameter | 8.35 | mm |
| Wall thickness | 0.575 | mm |
Operating Conditions and Irradiation History
The H09 rod was irradiated for 4 cycles in the OSIRIS reactor to a final discharge average burnup of 46.06 MWd/kgU. The power mode selected for this simulation is PiecewiseConstant. The average linear powers in the 4 cycles were approximately 22, 20, 18, and 15 kW/m (OECDNEDB, 2002). The average power history for is shown in Figure 1. The power history assumed a 24 hour startup time that was broken into 24 timesteps in one hour increments. Because the axial power shapes and boundary conditions are modeled as PieceswiseBilinear, a ramp time of 360 seconds (0.1 hours) was assumed at each power step for the axial power shape and boundary condition input. The startup time of 24 hours and the ramp time of 360 seconds (0.1 hours) are based on ANATECH's experience with fuel rod modeling for steady state operation and the development of Falcon Verification and Validation cases. They are intended to minimize the introduction of computational artifacts from unrealistic power changes and ramp rates into the analyses. The axial power profile was calculated from the OSIRIS data package (OECDNEDB, 2002) taken from the IFPE database. The cladding outer surface temperature as a function of time was also provided in the OSIRIS data package (OECDNEDB, 2002), and was used as a boundary condition for this simulation. The cladding outer surface temperature ranged from 562.55 K to 611.95 K. The initial fill-gas (Helium) pressure was 3.1 MPa, and the coolant system pressure was 15.5 MPa. The fast neutron flux as a function time was calculated from the data provided in the OSIRIS data package (OECDNEDB, 2002). Operational input parameters are summarized in Table 2.
Table 2: Operational input parameters
| Base Irradiation | ||
|---|---|---|
| Coolant inlet temperature | K | 562.55 |
| Coolant pressure | MPa | 15.5 |
| Fast Neutron Flux | ||
| Cycle 2 | n/(ms) per (W/m) | 4.2 |
| Cycle 3 | n/(ms) per (W/m) | 4.6 |
| Cycle 4 | n/(ms) per (W/m) | 4.8 |
| Cycle 6 | n/(ms) per (W/m) | 4.8 |
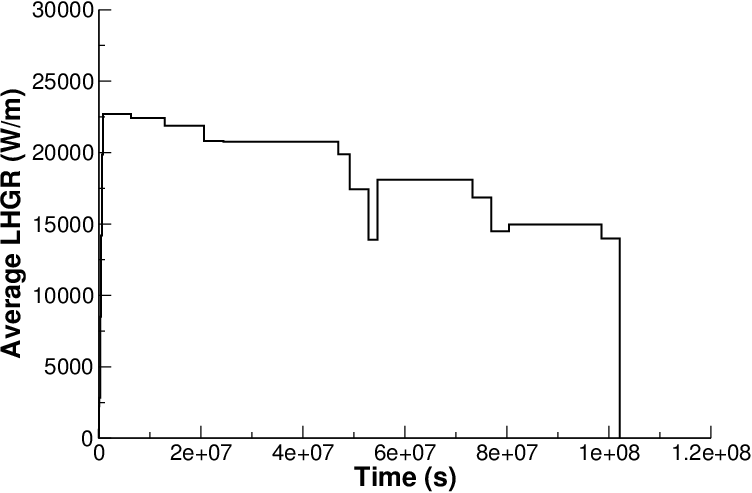
Figure 1: OSIRIS H09 power history with 24 hours startup
Model Description
Geometry and Mesh
The rod specifications in Table 1 were used to define the geometry for this simulation. The OSIRIS H09 rod was modeled as a two-dimensional, axi-symmetric linear mesh with quadratic elements. The fuel mesh consisted of 11 radial elements and the cladding mesh consisted of four radial elements to form a clad thickness of 0.575 mm. The fuel stack length is 3.66 m and the plenum height is 0.139 m. The mesh of the top portion of the rod is shown in Figure 2.
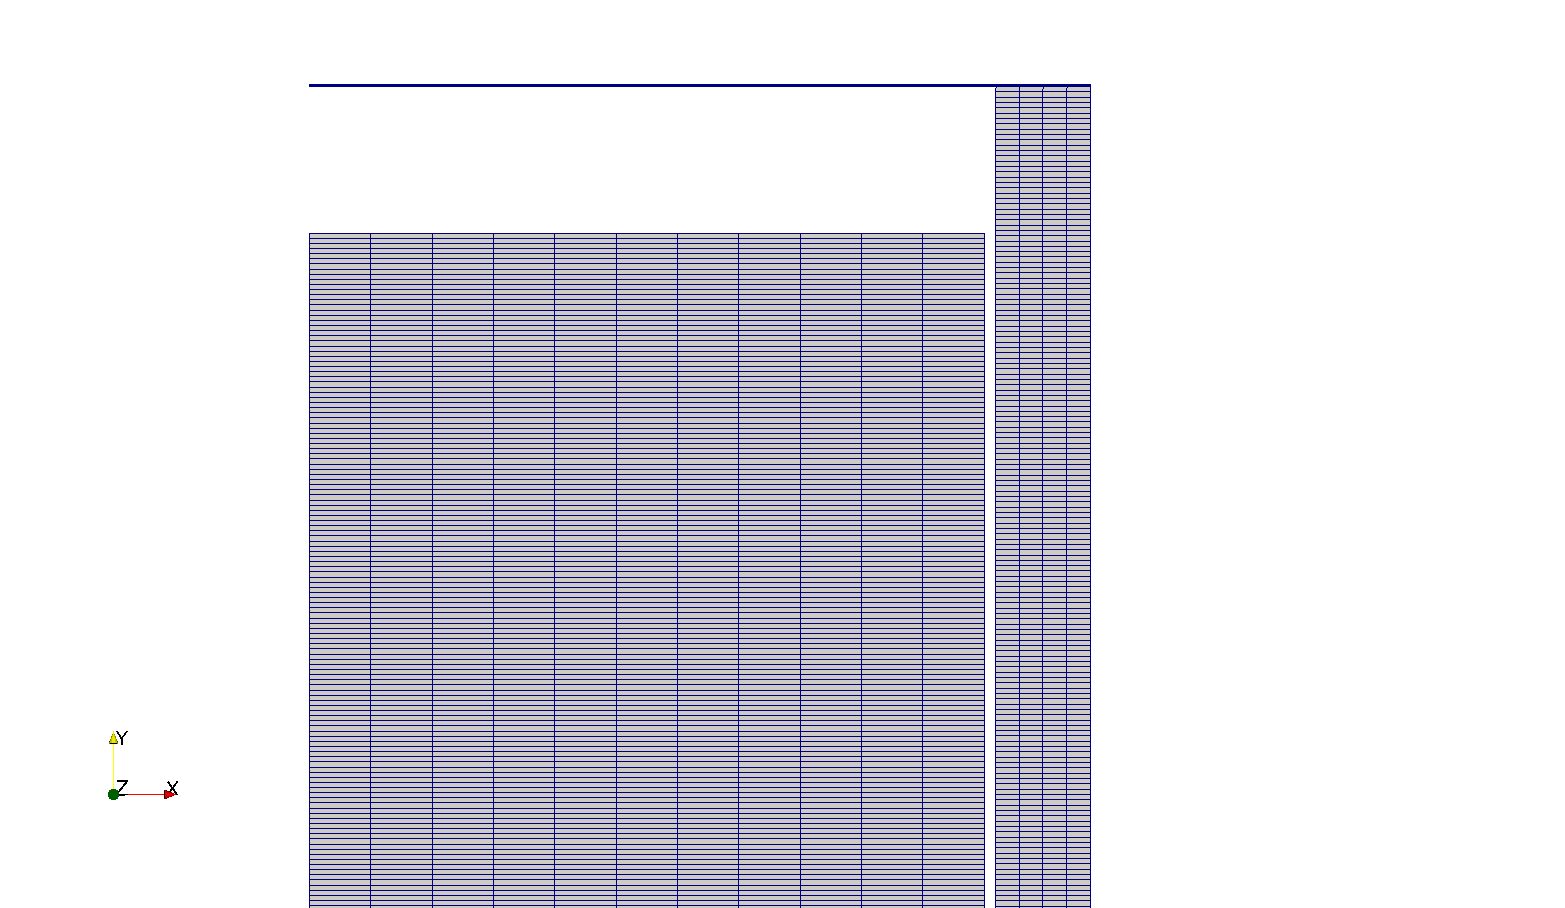
Figure 2: OSIRIS H09 mesh (not to scale)
Material and Behavioral Models
The following material and behavioral models were used for the fuel:
UO2Thermal - NFIR: For temperature and burnup dependent thermal properties.
ComputeFiniteStrainElasticStress and UO2ElasticityTensor: elastic mechanical behavior
UO2VolumetricSwellingEigenstrain: volumetric expansion due to solid and gaseous swelling
UO2RelocationEigenstrain: relocation strains, relocation activation threshold power set to 5 kW/m
ComputeThermalExpansionEigenstrain:thermal expansion with a constant instanteous thermal expansion coefficient
UO2Sifgrs: fission gas release model used with the gaseous swelling model
UO2VolumetricSwellingEigenstrain
For the cladding material, a constant thermal conductivity of 16 W/m-K was used and both thermal and irradiation creep were considered using the Limback model (Limbäck and Andersson, 1996). The following material and thermal behavior models were used for the cladding:
HeatConductionMaterial: Thermophysical material properties
ZryCreepLimbackHoppeUpdate and ZryElasticityTensor: mechanical creep and elastic deformation behavior for Zircaloy-2
ZryIrradiationGrowthEigenstrain: ESCORE model for volumetric swelling due to irradiation exposure
ZryThermalExpansionMATPROEigenstrain: thermal expansion of Zircaloy with the MATPRO model
Input files
The BISON input and all supporting files (power histories, axial power profiles, etc.) OSIRIS H09 rod are provided with the code distribution at folder bison/assessment/LWR/validation/OSIRIS_H09/analysis in the code repository.
Results Comparison
Data from the OSIRIS fuel irradiation program was used to assess the code's capability to capture the integral fuel rod fission gas release, rod internal pressure, rod growth, fuel column length changes, axial cladding diameter, cladding hydrogen content and oxide thickness at the end of life. A comparison of the predicted values from BISON calculations versus measured values from experimental data are shown in Table 3. Because the feature to calculate cladding hydrogen concentration and oxide thickness are not currently available in BISON, these comparisons will be performed in the future. The final burnup calculated was 44.64 MWd/kgU compared to 46.06 MWd/kgU burnup in the test documentation.
Table 3: BISON prediction versus measured data for OSIRIS H09.
| BISON prediction | Measured Data | |
|---|---|---|
| Burnup (MWd/kgU) | 44.65 | 46.06 |
| Fission Gas Release () | 0.21 | 0.8 |
| EOL Rod Internal Pressure at RT (MPa) | 6.67 | 4.338 |
| EOL Internal free volume (cc) | 9.35 | 11.1 |
| Fuel column changes (mm) | 22.41 | 26.62 |
| Fuel rod growth (mm) | 23.08 | 28.8 |
Fission Gas Release
The fission gas release data available for this experiment is from post irradiation examination (PIE) puncture tests. Figure 3 show BISON's comparisons with the end-of-life measurement for the OSIRIS H09 rod. BISON computes a reasonable FGR value that under predicts the measured result.
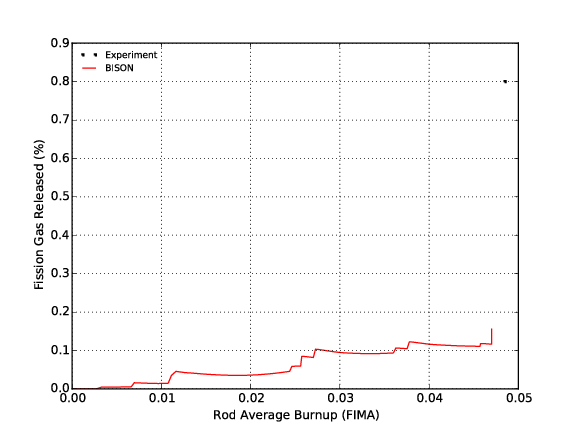
Figure 3: Fission gas release comparisons for OSIRIS H09
Rod Internal Pressure
The only rod internal pressure data available for this experiment is from PIE puncture tests at the end-of-life. Figure 4 shows BISON's comparisons to the experimental data for the OSIRIS H09 rod. The figure shows BISON over predicts the rod internal pressure.
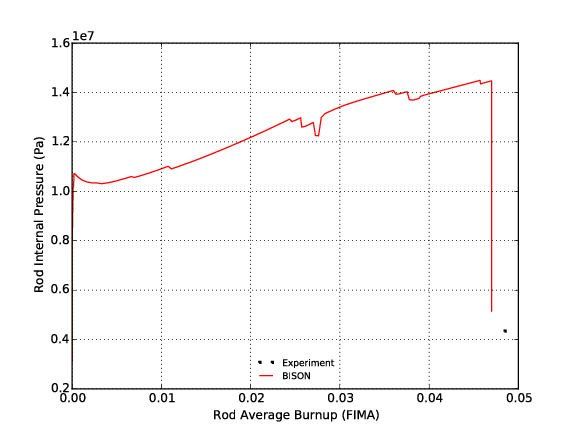
Figure 4: Rod internal pressure comparison for OSIRIS H09
Cladding Diameter
The calculated final rod diameter as a function of axial position is compared to measured data. A comparison of the computed and measured end-of-life rod diameter data (excluding oxide thickness) is shown in Figure 5. The figure shows BISON over predicts the cladding diameter at the end of life which results in less cladding computed creep down than measured.
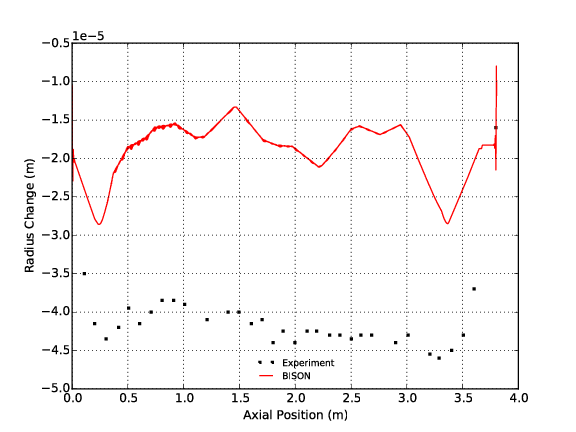
Figure 5: EOL average cladding diameter comparisons for OSIRIS H09
Discussion
Based on the data presented above, several observations can be made regarding the results obtained from BISON analyses of the OSIRIS H09 test rod.
BISON's prediction the EOL FGR is reasonable, but somewhat low.
BISON over predicts the measured rod internal pressure by a fairly large margin.
BISON over predicts measured EOL cladding diameter.
- Based on evaluation of these and other assessment cases, this behavior appears to be related to fuel swelling after fuel/cladding contact. Additionally, other effects on fuel deformation including relocation, densification, fuel creep, etc. could influence the behavioral response in these analyses.
Since cladding oxide thickness and hydrogen concentration data are available for OSIRIS H09 rod, these characteristics should be evaluated in the future once these features are available in BISON.
References
- M. Limbäck and T. Andersson.
A model for analysis of the effect of final annealing on the in- and out-of-reactor creep behavior of zircaloy cladding.
In Zirconium in the Nuclear Industry: Eleventh International Symposium, ASTM STP 1295, 448–468. 1996.[BibTeX]
- OECDNEDB.
Ifpe/osiris r3 database.
Technical Report, OECD Nuclear Energy Data Bank, May 2002.[BibTeX]