IFA-681 Rods 1, 2, and 3
Overview
The Halden integral test IFA-681 was loaded in the Halden Boiling Water Reactor (HBWR) in January 2005 and operated till February 2012 with a completion of 15 cycles of irradiation. The rig contained two UO fuel rods and four UO-GdO rods with varied gadolinia content from 0.0 to 8.0wt.%, which were manufactured by Institutt for Energiteknikk (IFE)-Kjeller. An overview of the fuel rod specifications of the IFA-681 tests is provided in Table 1. In practice, the rod designs were very similar except U enrichment and Gd concentrations. The experiment was conducted under standard HBWR conditions, with the rig operating at a coolant pressure of approximately 3.5MPa, and a coolant temperature of approximately 235. Achieved burnup varied between 31 and 45 MWd/kgUO. The aim in the experiment was to evaluate the impact of Gd concentration to the oxide solution on the fuel thermal behavior, dimensional changes, and fission gas release.
Test Description
Rod Design Specifications
The IFA-681.1 rods 1, 2, and 3 were solid rods and were enriched to 4.70wt.%U for rods 1 and 2, and 2.80wt.%U for rod 3. The fuel and cladding specifications are tabulated in Table 1.
Table 1: IFA-681.1 Test Rod Specifications
| Fuel Rod | Rod 1 | Rod 2 | Rod 3 | Unit |
|---|---|---|---|---|
| Fuel stack height | 400.4 | 400.0 | 400.2 | mm |
| Fuel pellet height | 10.25 | 9.92 | 9.97 | mm |
| Fill gas composition | He | He | He | |
| Fill gas pressure | 1.0 | 1.0 | 1.0 | MPa |
| Fuel | Rod 1 | Rod 2 | Rod 3 | Unit |
| Material | UO | UO-GdO | UO-GdO | |
| GdO | 0.0 | 2.0 | 8.0 | wt.% |
| Enrichment | 4.70 | 4.70 | 2.80 | |
| Density | 95.6 | 96.1 | 96.0 | |
| Inner diameter | 0.0 | 0.0 | 0.0 | mm |
| Outer diameter | 8.19 | 8.19 | 8.19 | mm |
| Pellet geometry | solid | solid | solid | |
| Insulator Pellet | Rod 1 | Rod 2 | Rod 3 | Unit |
| Material | natural UO/AlO | natural UO/AlO | natural UO/AlO | |
| Inner diameter | 1.80 | 1.80 | 1.80 | mm |
| Outer diameter | 8.19 | 8.19 | 8.19 | mm |
| Pellet geometry | hollow | hollow | hollow | |
| Cladding | Rod 1 | Rod 2 | Rod 3 | Unit |
| Material | Zy-4 | Zy-4 | Zy-4 | |
| Outer diameter | 8.36 | 8.36 | 8.36 | mm |
| Inner diameter | 9.50 | 9.50 | 9.50 | mm |
| Wall thickness | 1.14 | 1.14 | 1.14 | mm |
Operating Conditions and Irradiation History
The HBWR operating conditions are tabulated in Table 2. The reactor power history is shown in Figure 1. The measured reactor coolant temperature was used as the boundary temperature on the cladding outer surface.
Table 2: Operational input parameters.
| Average coolant temperature | 235 | |
| Coolant pressure | MPa | 3.5 |
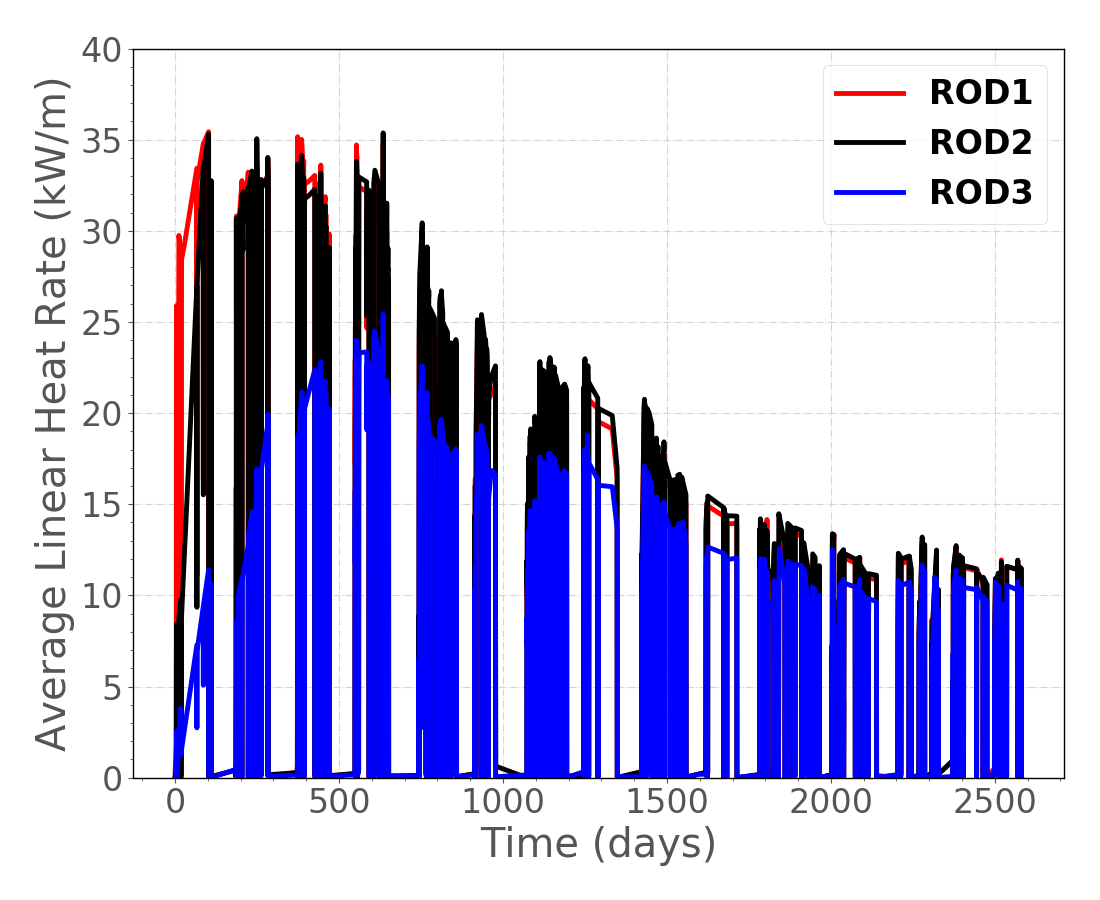
Figure 1: Through life power histories for IFA-681.1 rods 1, 2, and 3.
Model Description
Geometry and Mesh
The assumed geometry and mesh are shown in Figure 2 and Figure 3. The fuel pellet stack was modeled as a smeared column with merged insulator pellets (natural UO and AlO). The analysis in BISON was performed for the three out of six rods, IFA-681 rods 1, 2, and 3. Note that top 11 pellets are hollow where the thermocouple were located. The integral responses from the experiment were obtained as follows: fuel temperature via a fuel centerline thermocouple, rod internal pressure via pressure transducer, fission gas release (FGR) via the online pressure measurements, and rod power via four neutron detectors installed in the rig. A two-dimensional axisymmetric geometry was used.
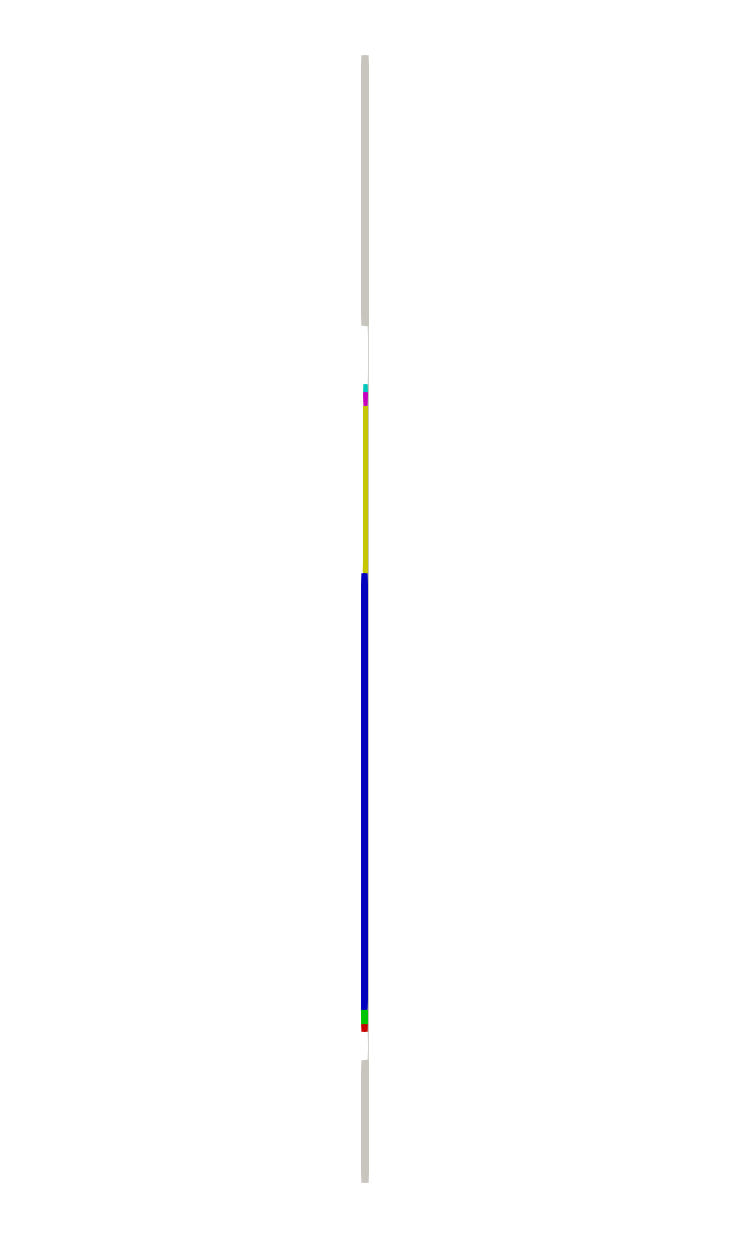
Figure 2: A front-view of the IFA-681.1 rod 1.
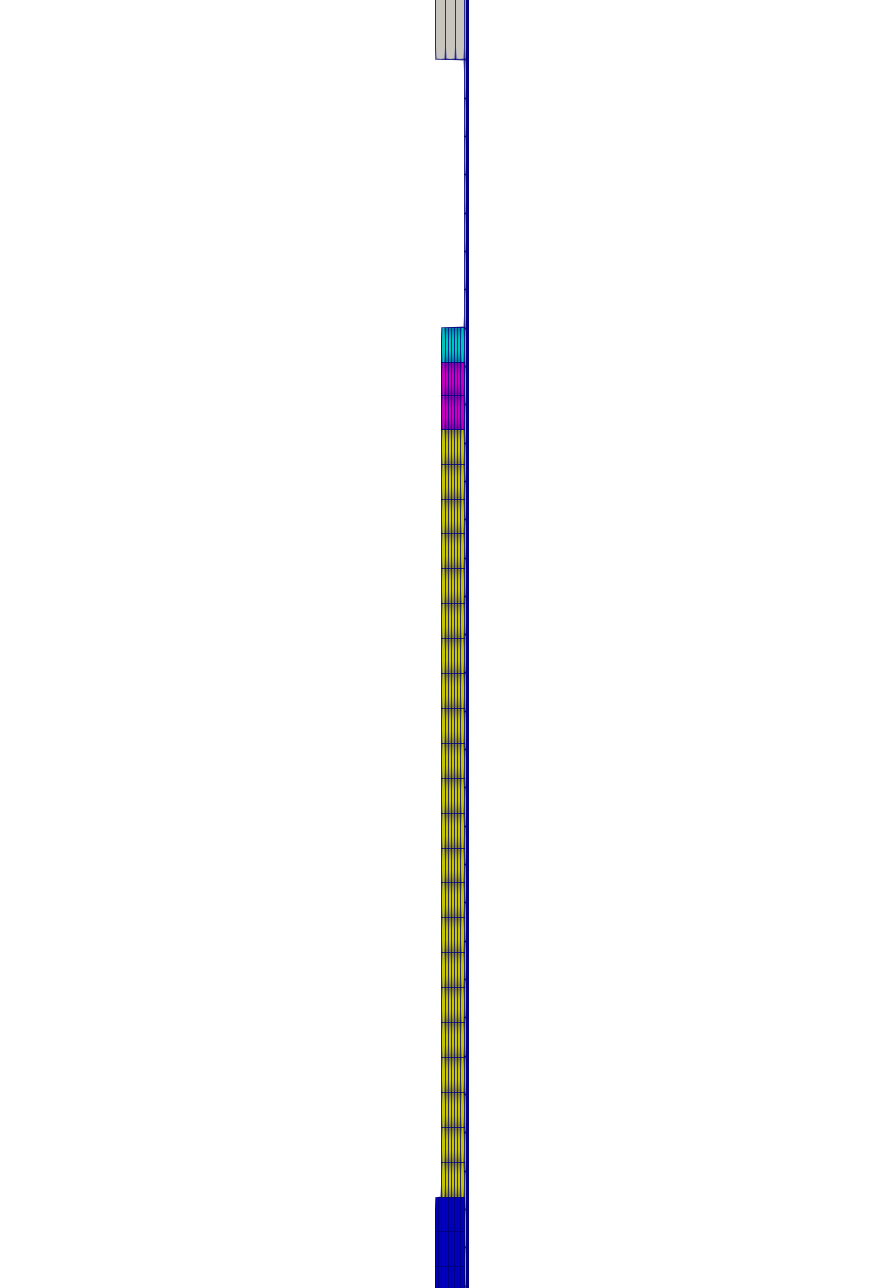
Figure 3: Close-up view of the IFA-681.1 rod 1, a cut from the top of the fuel rod.
AlO hollow insulation pellets in upper end in IFA-681 rods 1, 2, and 3, followed by natural UO hollow pellets. 11 pellets of hollow enriched UO fuel, followed by 28/29 pellets of the solid enriched UO fuel. Similarly, the lower end, natural UO solid pellets, followed by AlO solid insulation pellets.
Material and Behavioral Models
The following material and behavioral models were used for the fuel:
UO2Thermal - Toptan: For temperature and burnup dependent thermal properties.
ComputeFiniteStrainElasticStress and ComputeIsotropicElasticityTensor: elastic mechanical behavior
UO2VolumetricSwellingEigenstrain: volumetric expansion due to solid and gaseous swelling
UO2RelocationEigenstrain: relocation strains
ComputeThermalExpansionEigenstrain: thermal expansion with a constant instanteous thermal expansion coefficient
UO2Sifgrs: fission gas release model used with the gaseous swelling model
UO2VolumetricSwellingEigenstrain
For the clad material, a constant thermal conductivity of 16 W/m-K was used and both thermal (primary and secondary) and irradiation creep were considered using the Limback creep model (Limbäck and Andersson, 1996). The following material and thermal behavior models were used for the cladding:
HeatConductionMaterial: Thermophysical material properties
ZryCreepLimbackHoppeUpdate and ZryElasticityTensor: mechanical creep and elastic deformation behavior
ZryIrradiationGrowthEigenstrain: ESCORE model for volumetric swelling due to irradiation exposure
ZryThermalExpansionMATPROEigenstrain: thermal expansion of Zircaloy with the MATPRO model
ZryOxidation: corrosion oxide layer thickness
For the natural UO material, a constant thermal conductivity of 3.0 W/m-K and a constant specific heat capacity of 300 J/kg-K were used. The following material and thermal behavior models were used for the cladding:
HeatConductionMaterial: Thermophysical material properties
- ComputeFiniteStrainElasticStress and ComputeIsotropicElasticityTensor: elastic mechanical behavior
ComputeThermalExpansionEigenstrain: thermal expansion with a constant instanteous thermal expansion coefficient
For the natural AlO material, a constant thermal conductivity of 18.0 W/m-K and a constant specific heat capacity of 880 J/kg-K were used. The following material and thermal behavior models were used for the cladding:
HeatConductionMaterial: Thermophysical material properties
ComputeFiniteStrainElasticStress and ComputeIsotropicElasticityTensor: elastic mechanical behavior
ComputeThermalExpansionEigenstrain: thermal expansion with a constant instanteous thermal expansion coefficient
Details and references for all of these models listed above can be found on the linked BISON documentation pages and in the provided inputs.
Input Files
The supplementary histories, from Halden data, such linear heat rate (LHR), fast neutron flux, coolant pressure, and coolant inlet temperatures are provided to BISON. Fuel Rod Analysis Toolbox is utilized for the condensation of the data prior to setting the BISON inputs. Gadolinium doping is performed using the BurnupFunction after this capability was added in FY23 (Sweet et al., 2023).
The BISON input and all supporting files (power histories, axial power profile, cladding surface temperature boundary condition, fast neutron flux history, etc.) for this case are provided with the code distribution at bison/assessment/LWR/validation/IFA_681/analysis.
Simulation Parameters and Assumptions
As mentioned in the Geometry and Mesh section, the mesh used is not an exact representation of the experiment. The insulator pellets were not included in the heat source term. The expansion thermometer was physically neglected in this mesh. This was done to alleviate troubles with thermal and mechanical properties between the thermometer and the fuel/insulator stack. The plenum length of the fuel rod was adjusted to account for the extra gas volume made from the voided thermometer. The simulation initial gas volumes were as listed in (Khattout, 2013). The value of 8.5 was used for the initial grain size, 1.0 for the fuel surface roughness, and 2.0 for the cladding surface roughness.
Results Comparison
BISON's predictions are compared to the experimental measurements for each rod in the following sections. A Python postprocessor script was used to extract the centerline temperature at the thermocouple (TC) position and the plenum pressure from the BISON simulations. It's important note that the thermocouples and pressure transducers failed, yielding BISON to go to the full time of the average linear heat rate (ALHR) while the experiment doesn't.
Temperature
BISON's temperature predictions are compared to the estimated values derived from the pressure measurements, which are shown for IFA-681.1 Rods 1, 2, and 3 in Figure 4, Figure 5, and Figure 6, respectively.
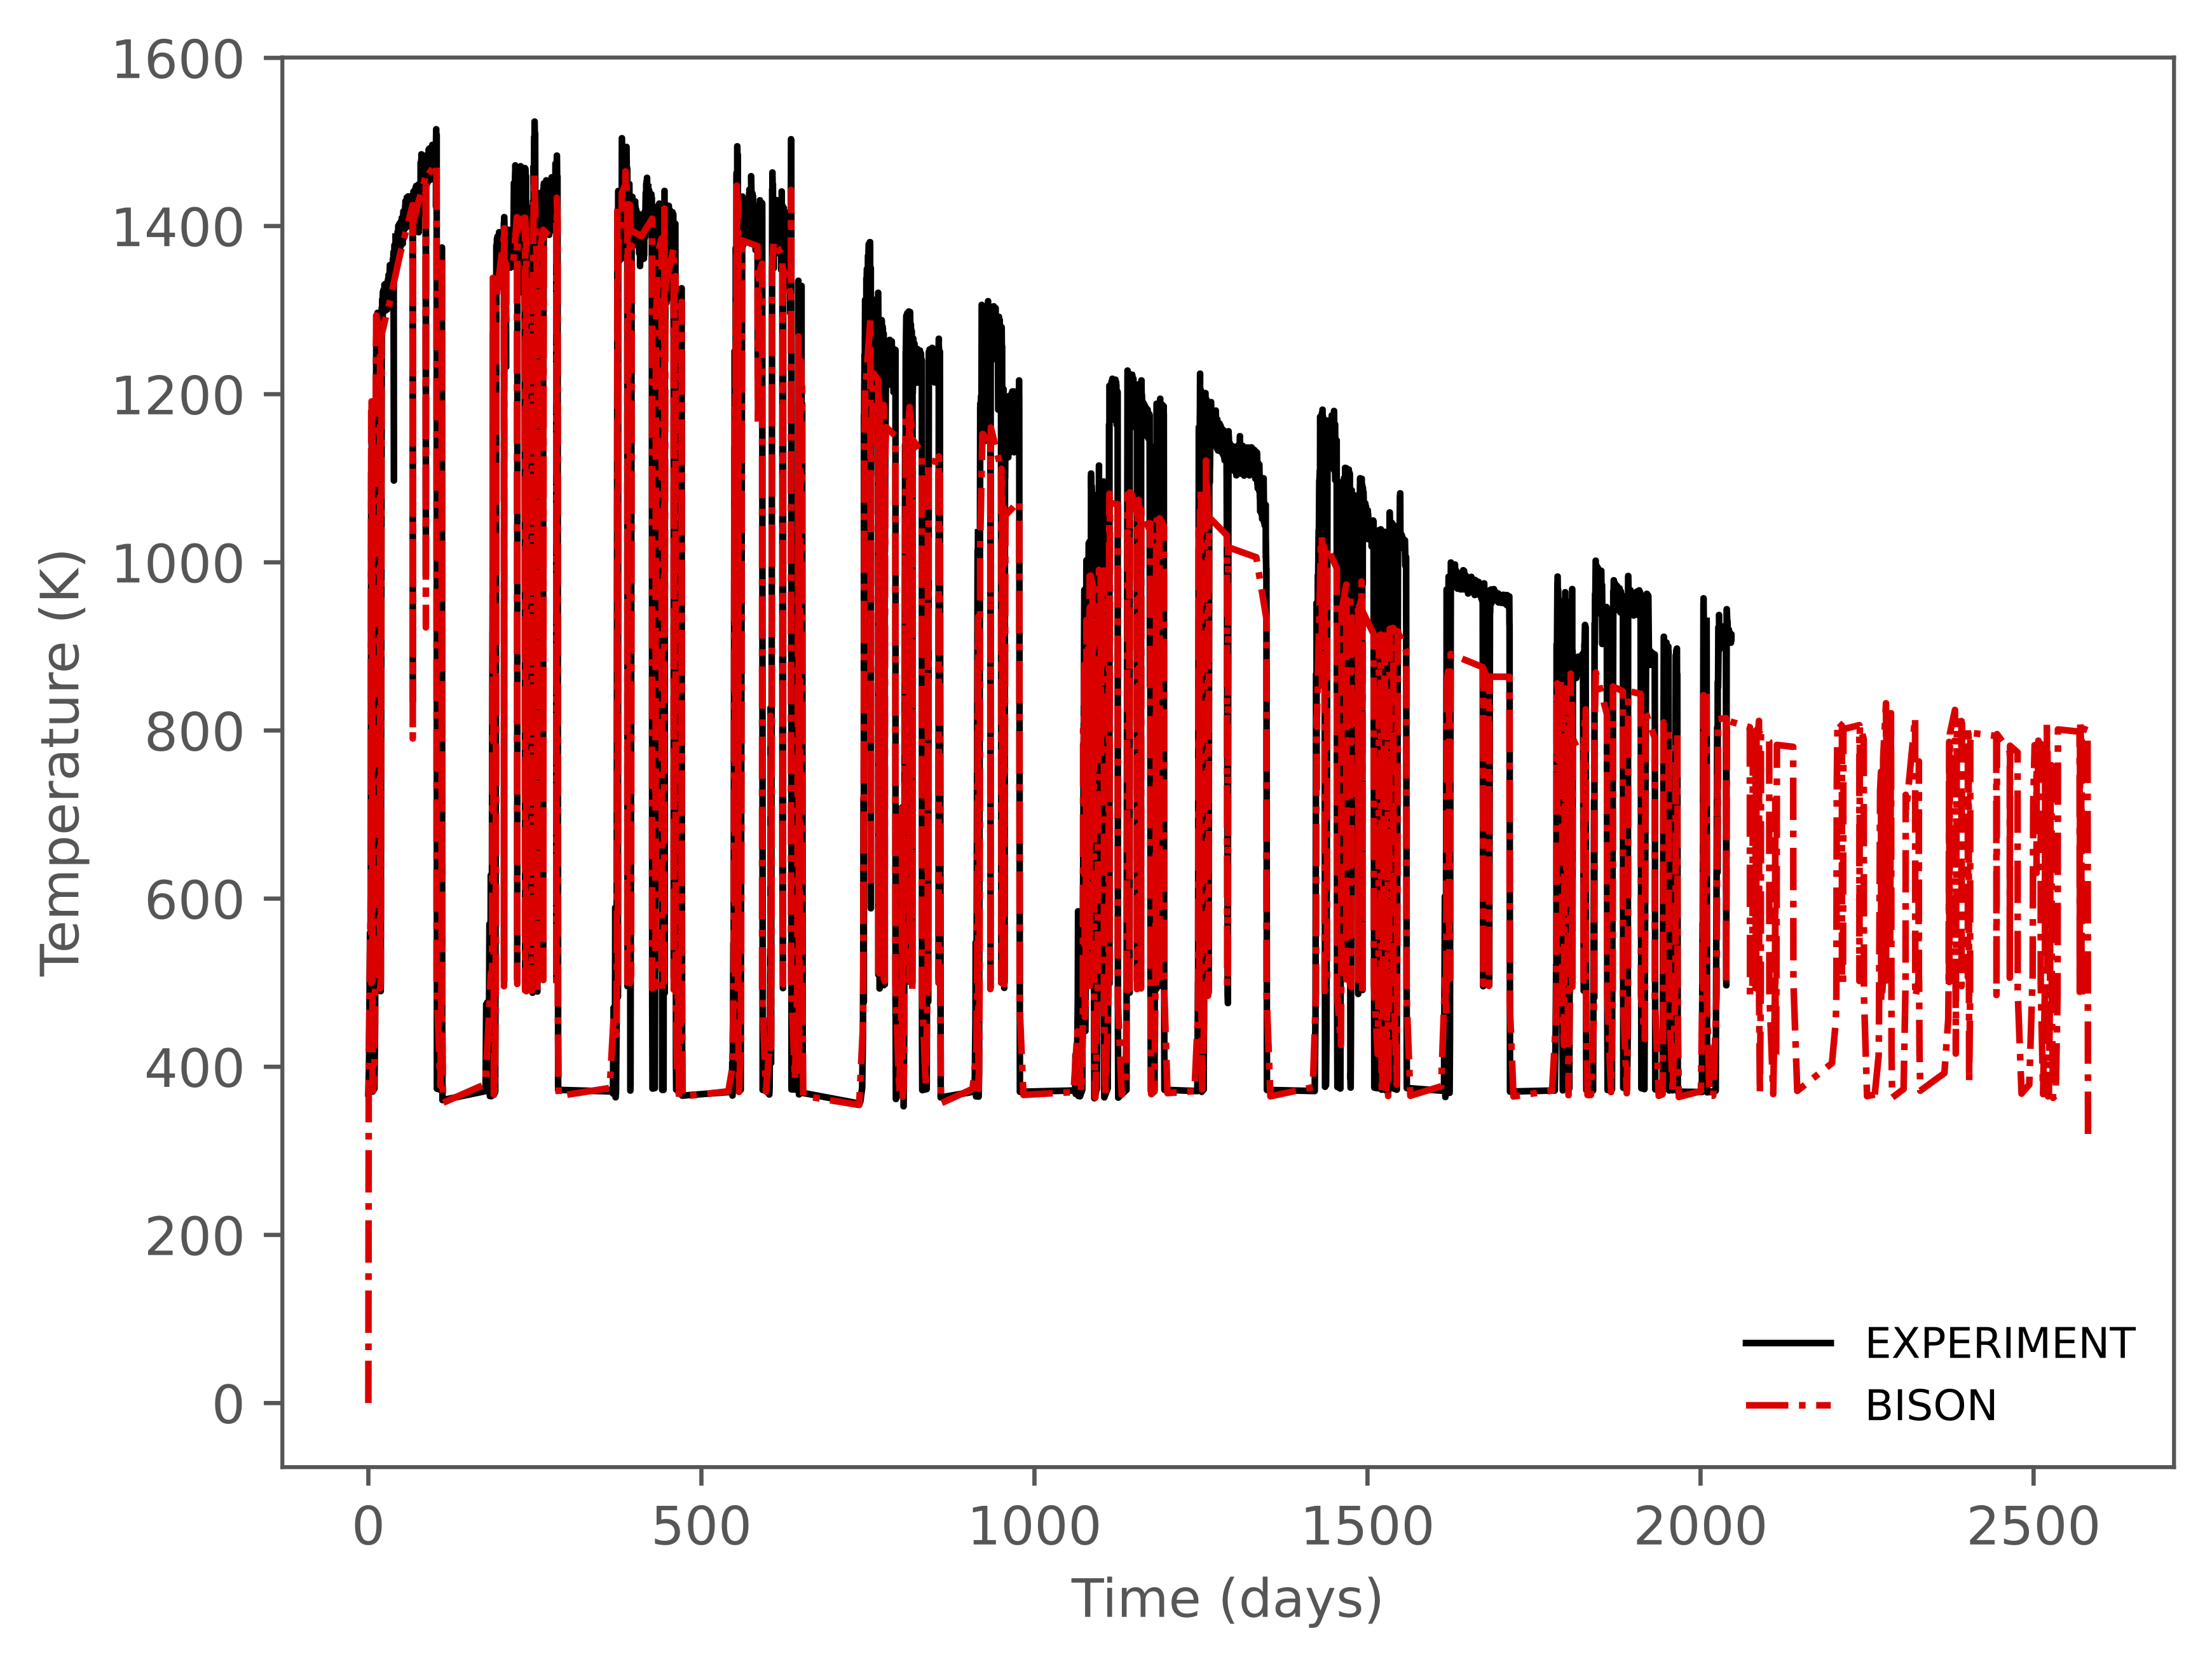
Figure 4: IFA-681.1 rod 1 temperature histories.
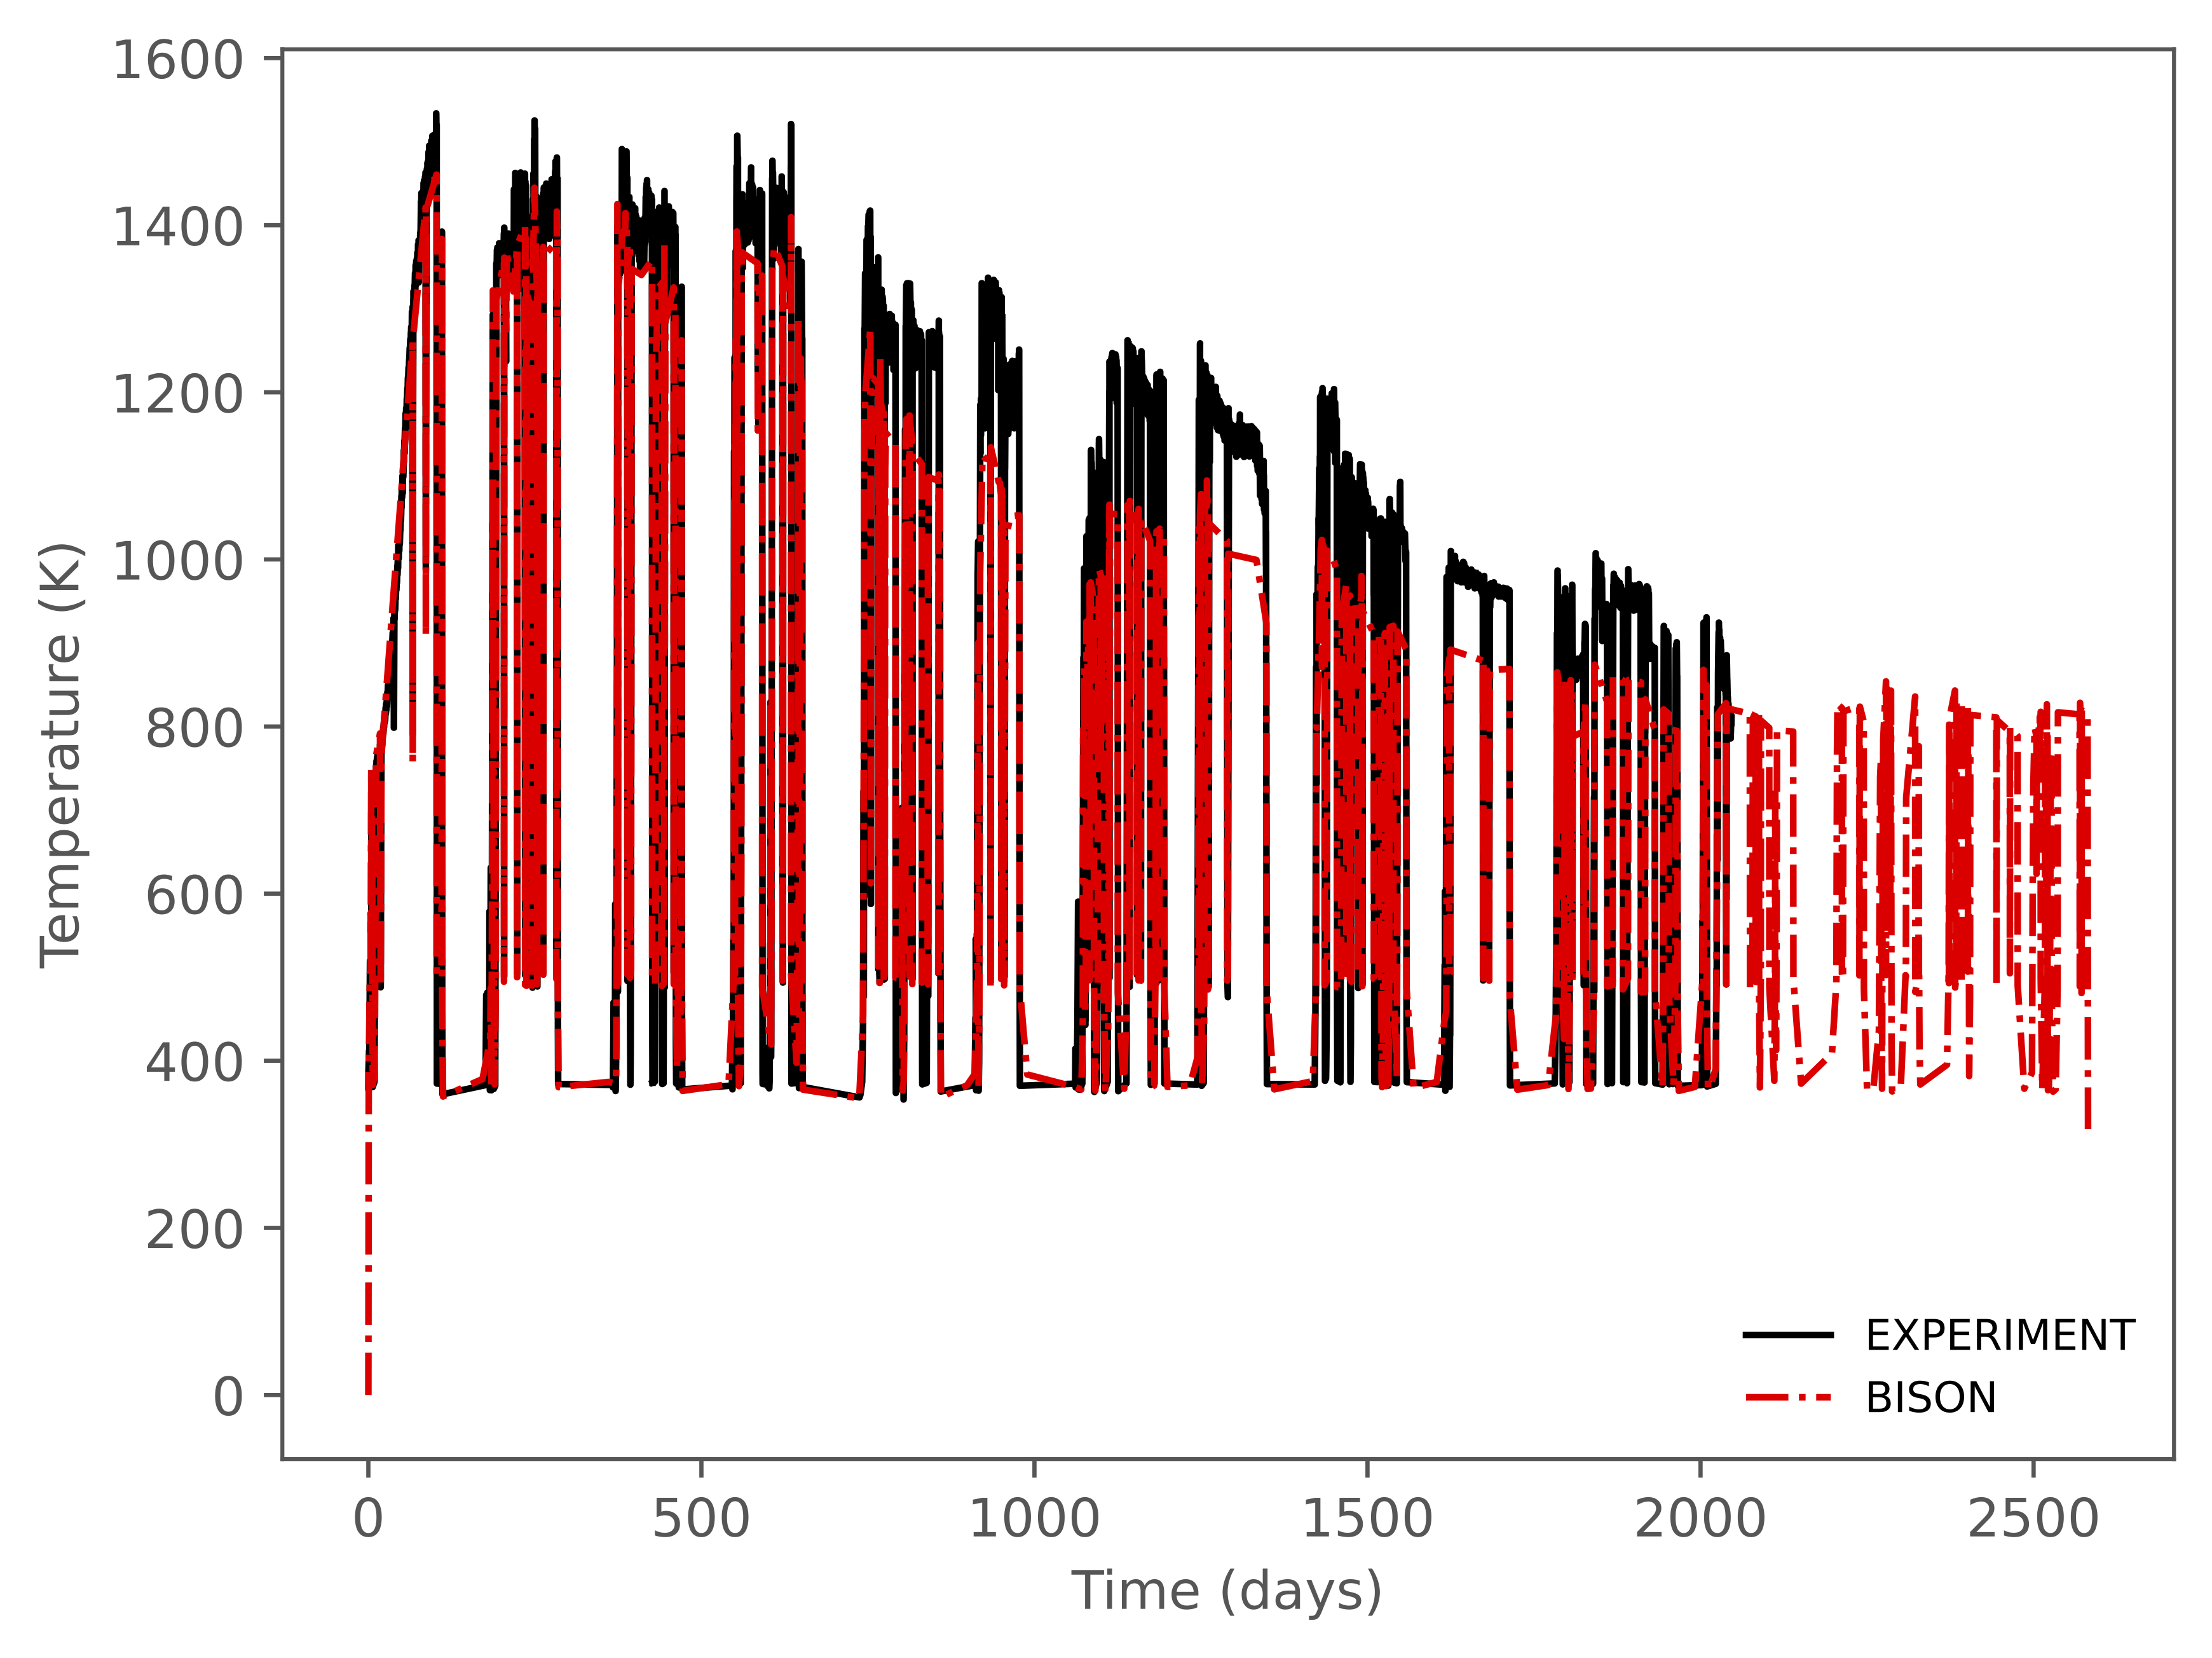
Figure 5: IFA-681.1 rod 2 temperature histories.
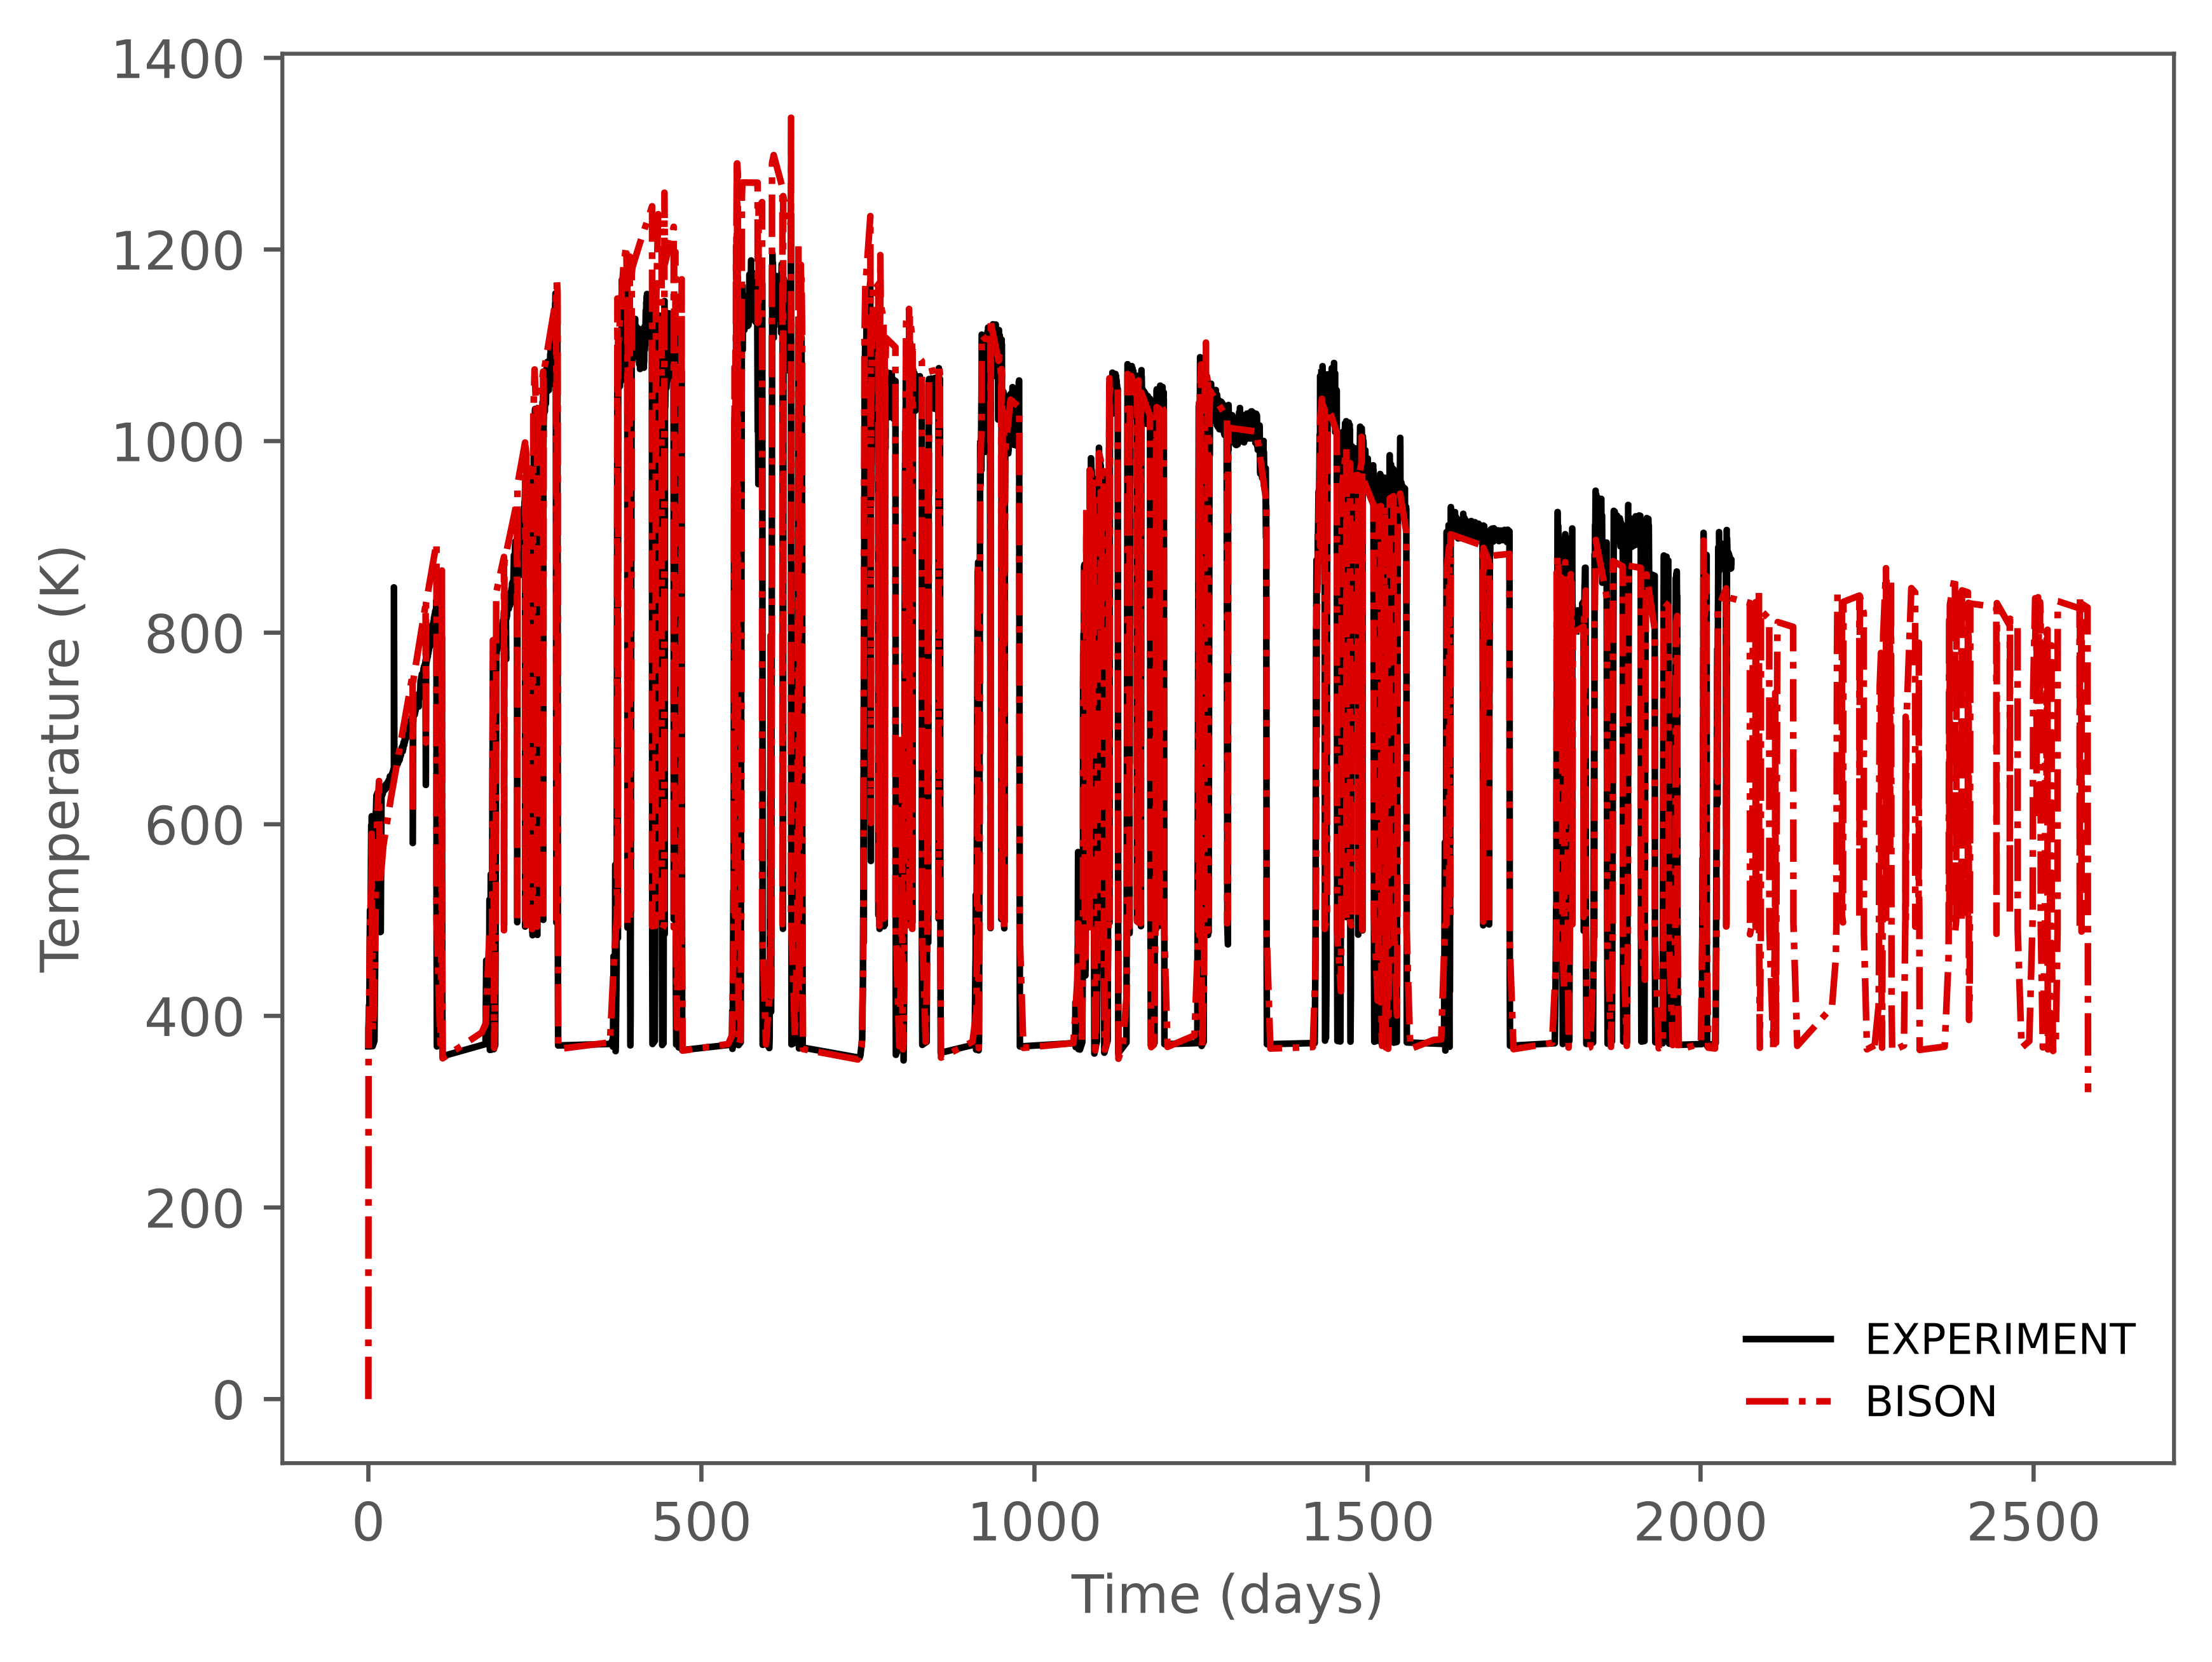
Figure 6: IFA-681.1 rod 3 temperature histories.
Rod internal pressure
BISON's rod internal pressure predictions are compared to the measurements, which are shown for IFA-681.1 Rods 1, 2, and 3 in Figure 7, Figure 8, and Figure 9, respectively.
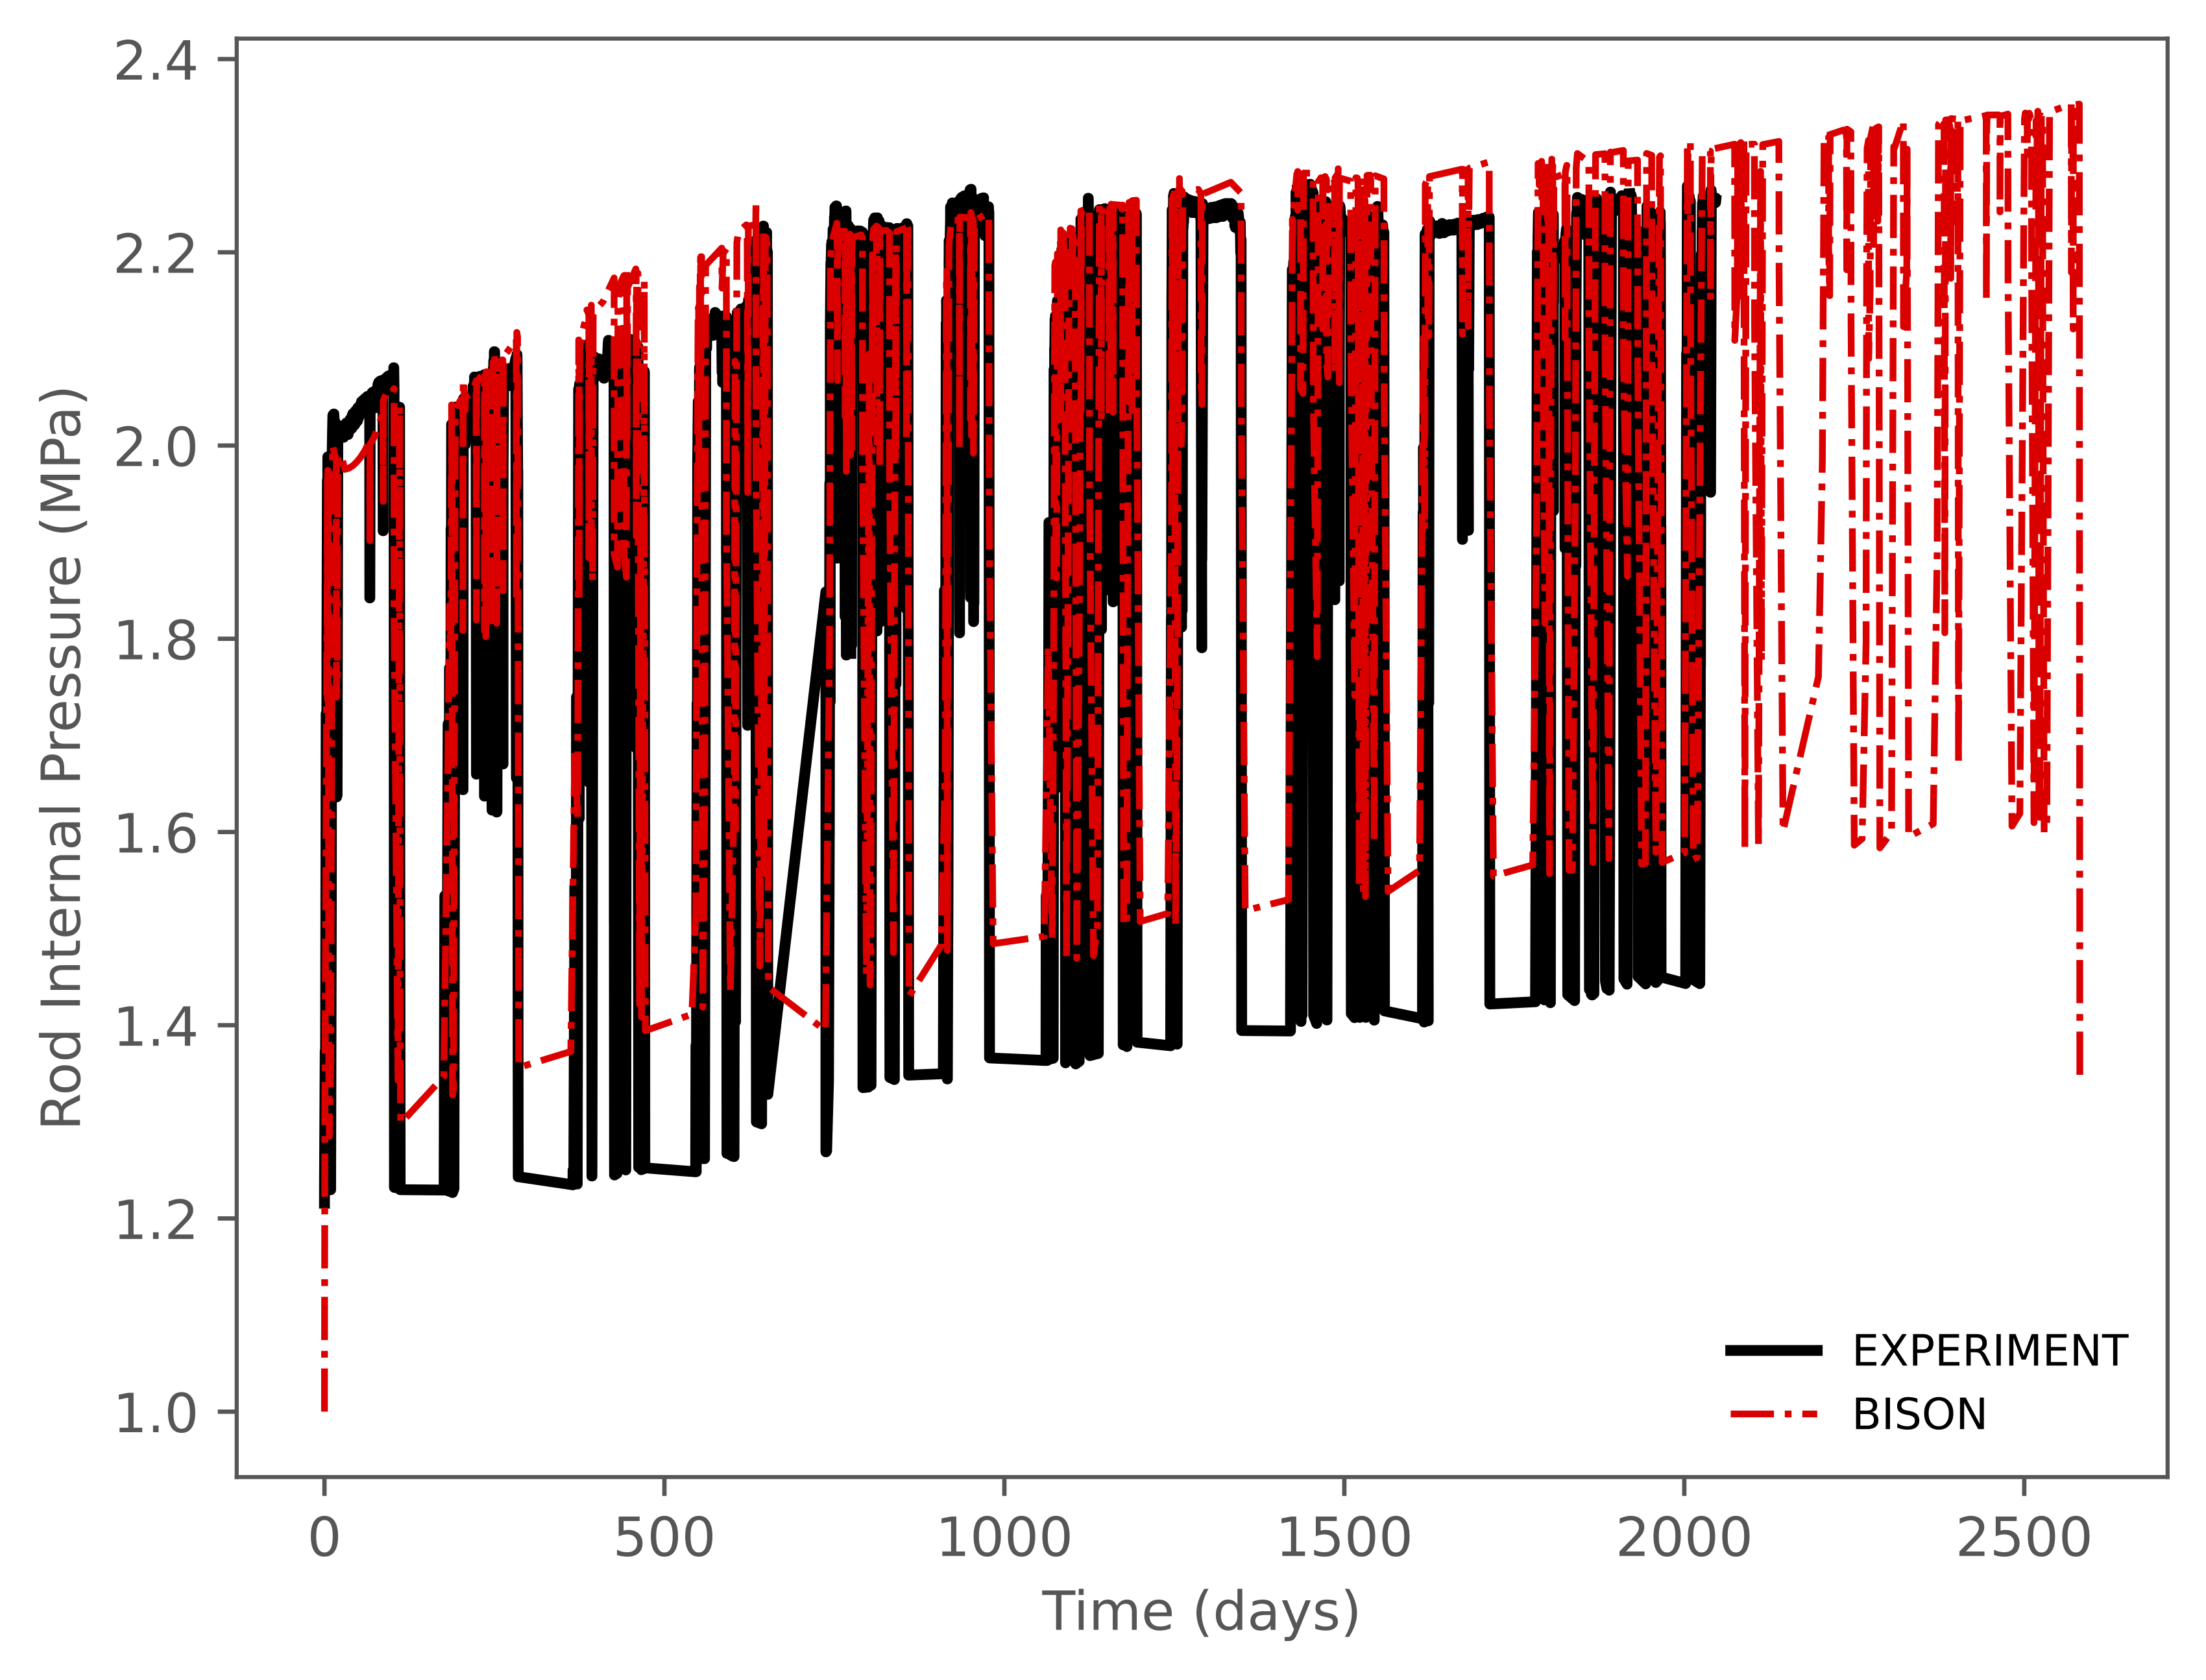
Figure 7: IFA-681.1 rod 1 rod internal pressure histories.
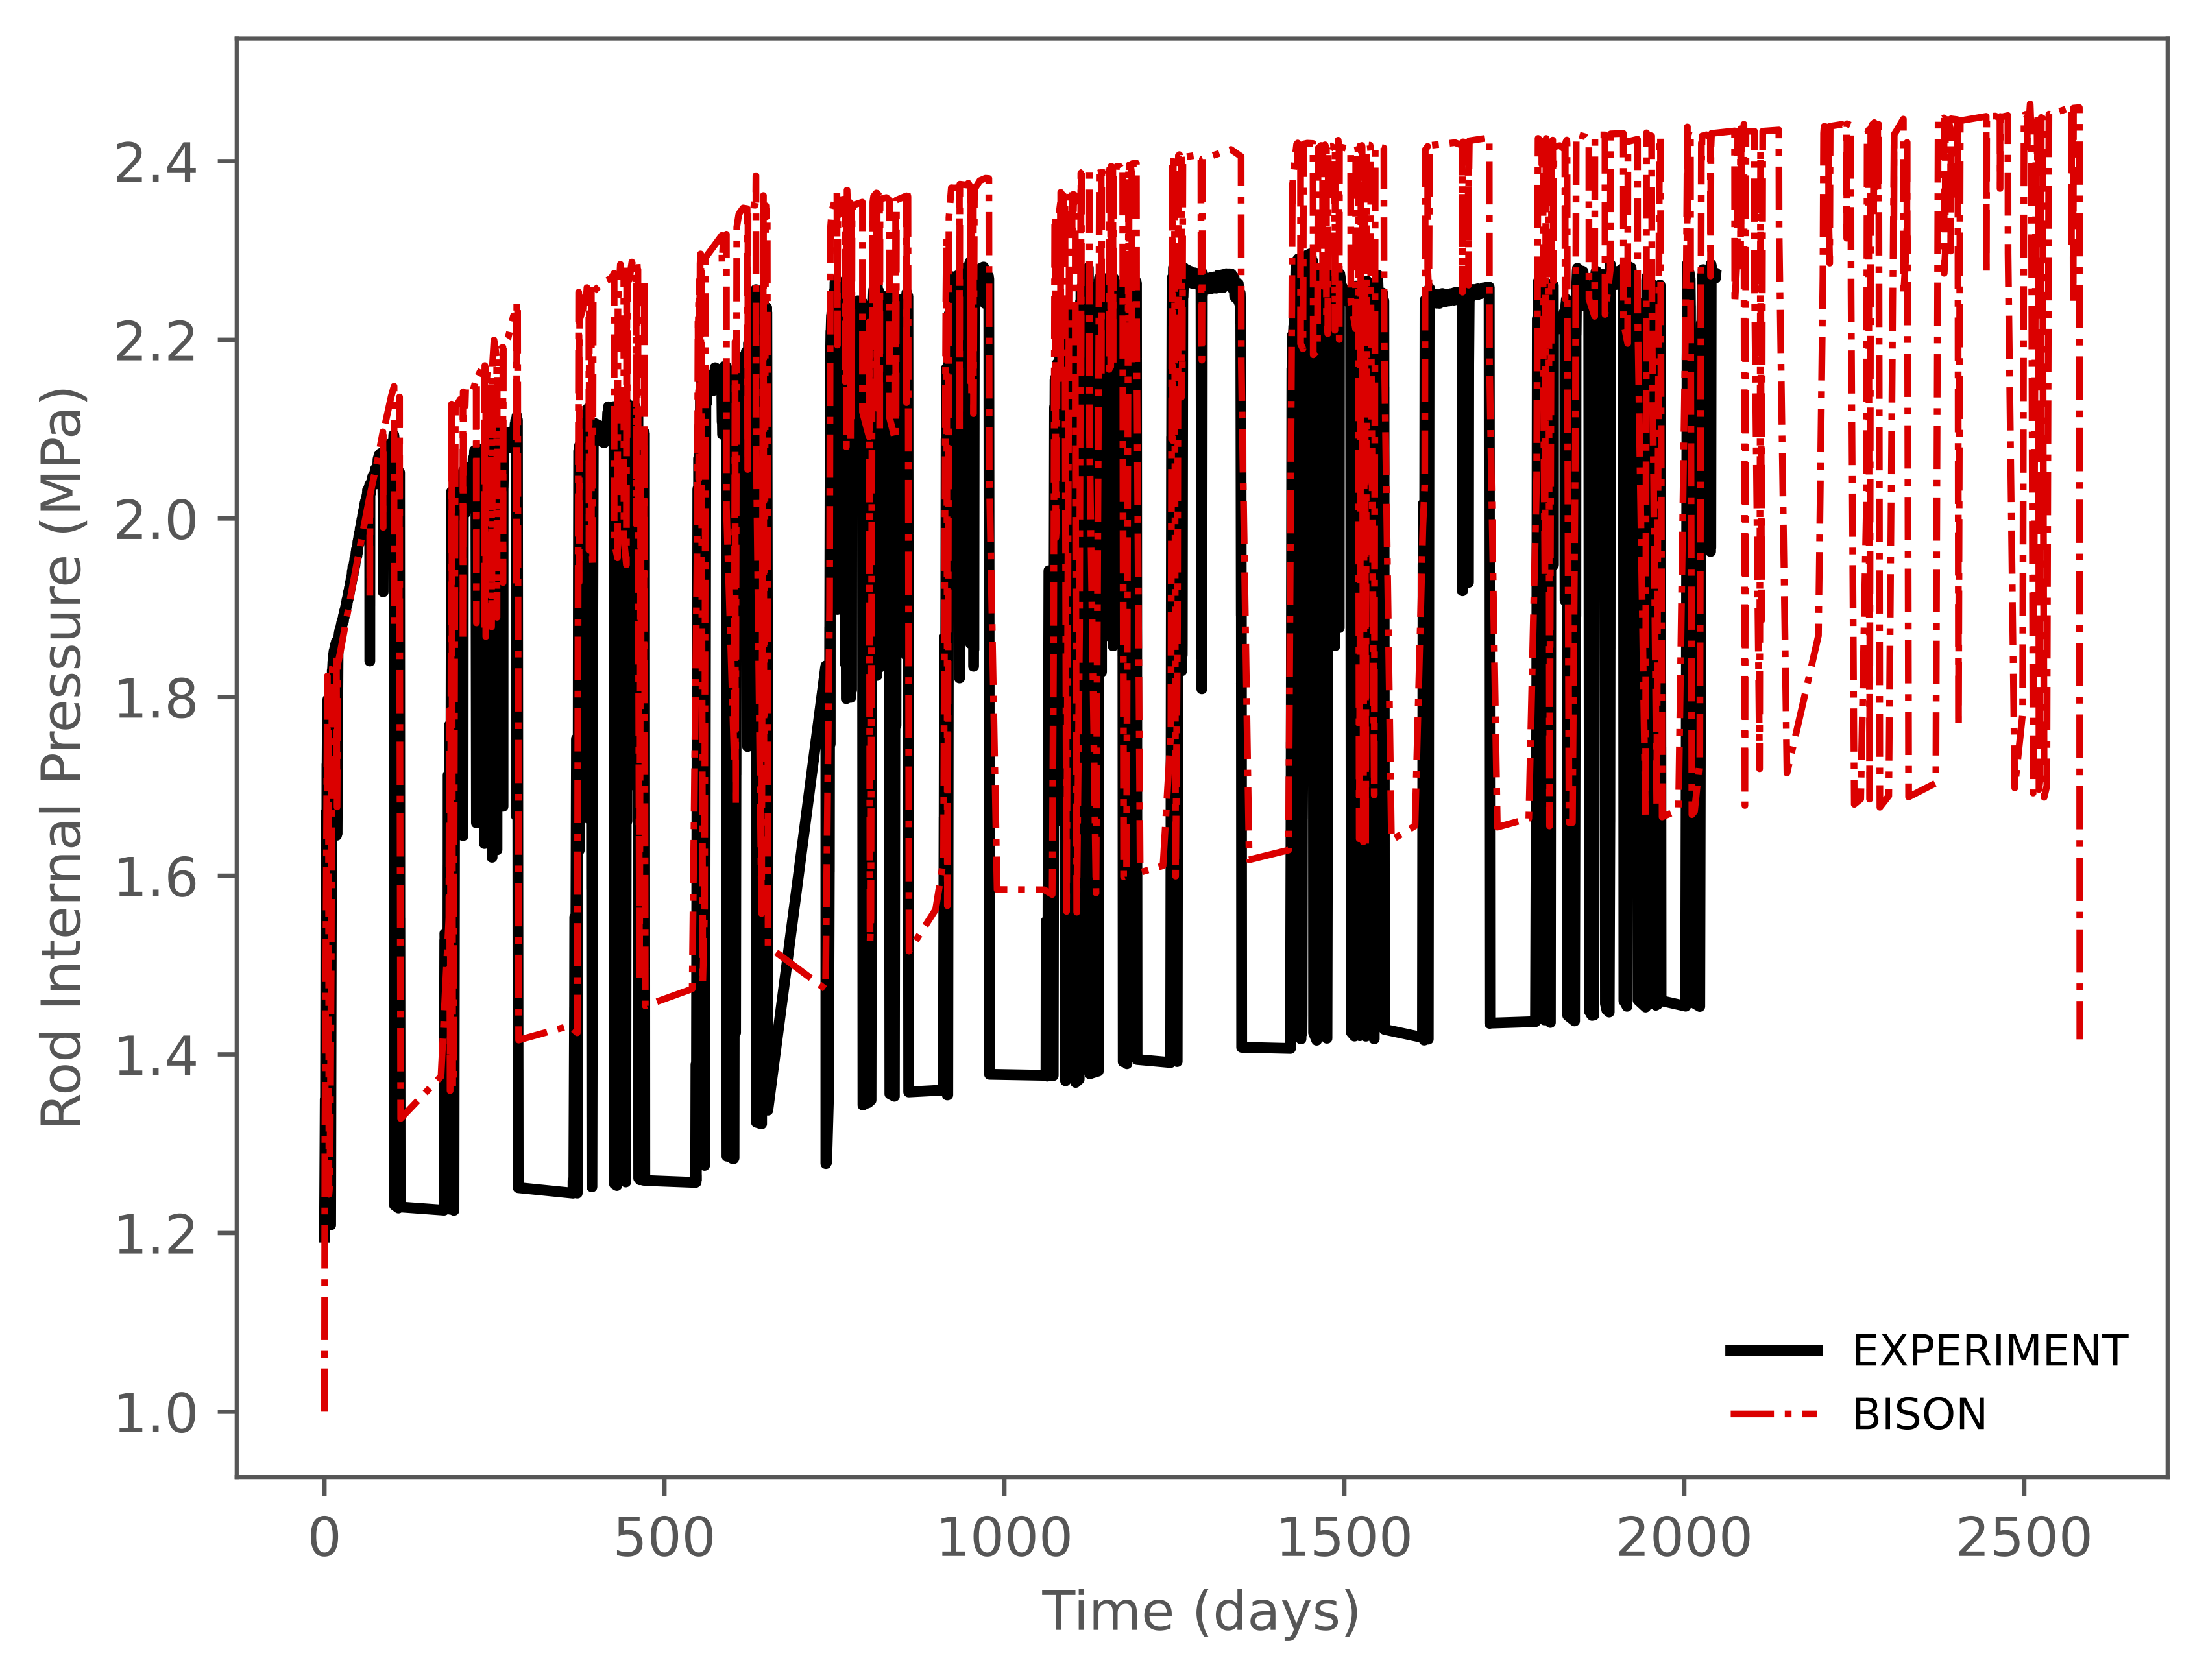
Figure 8: IFA-681.1 rod 2 rod internal pressure histories.
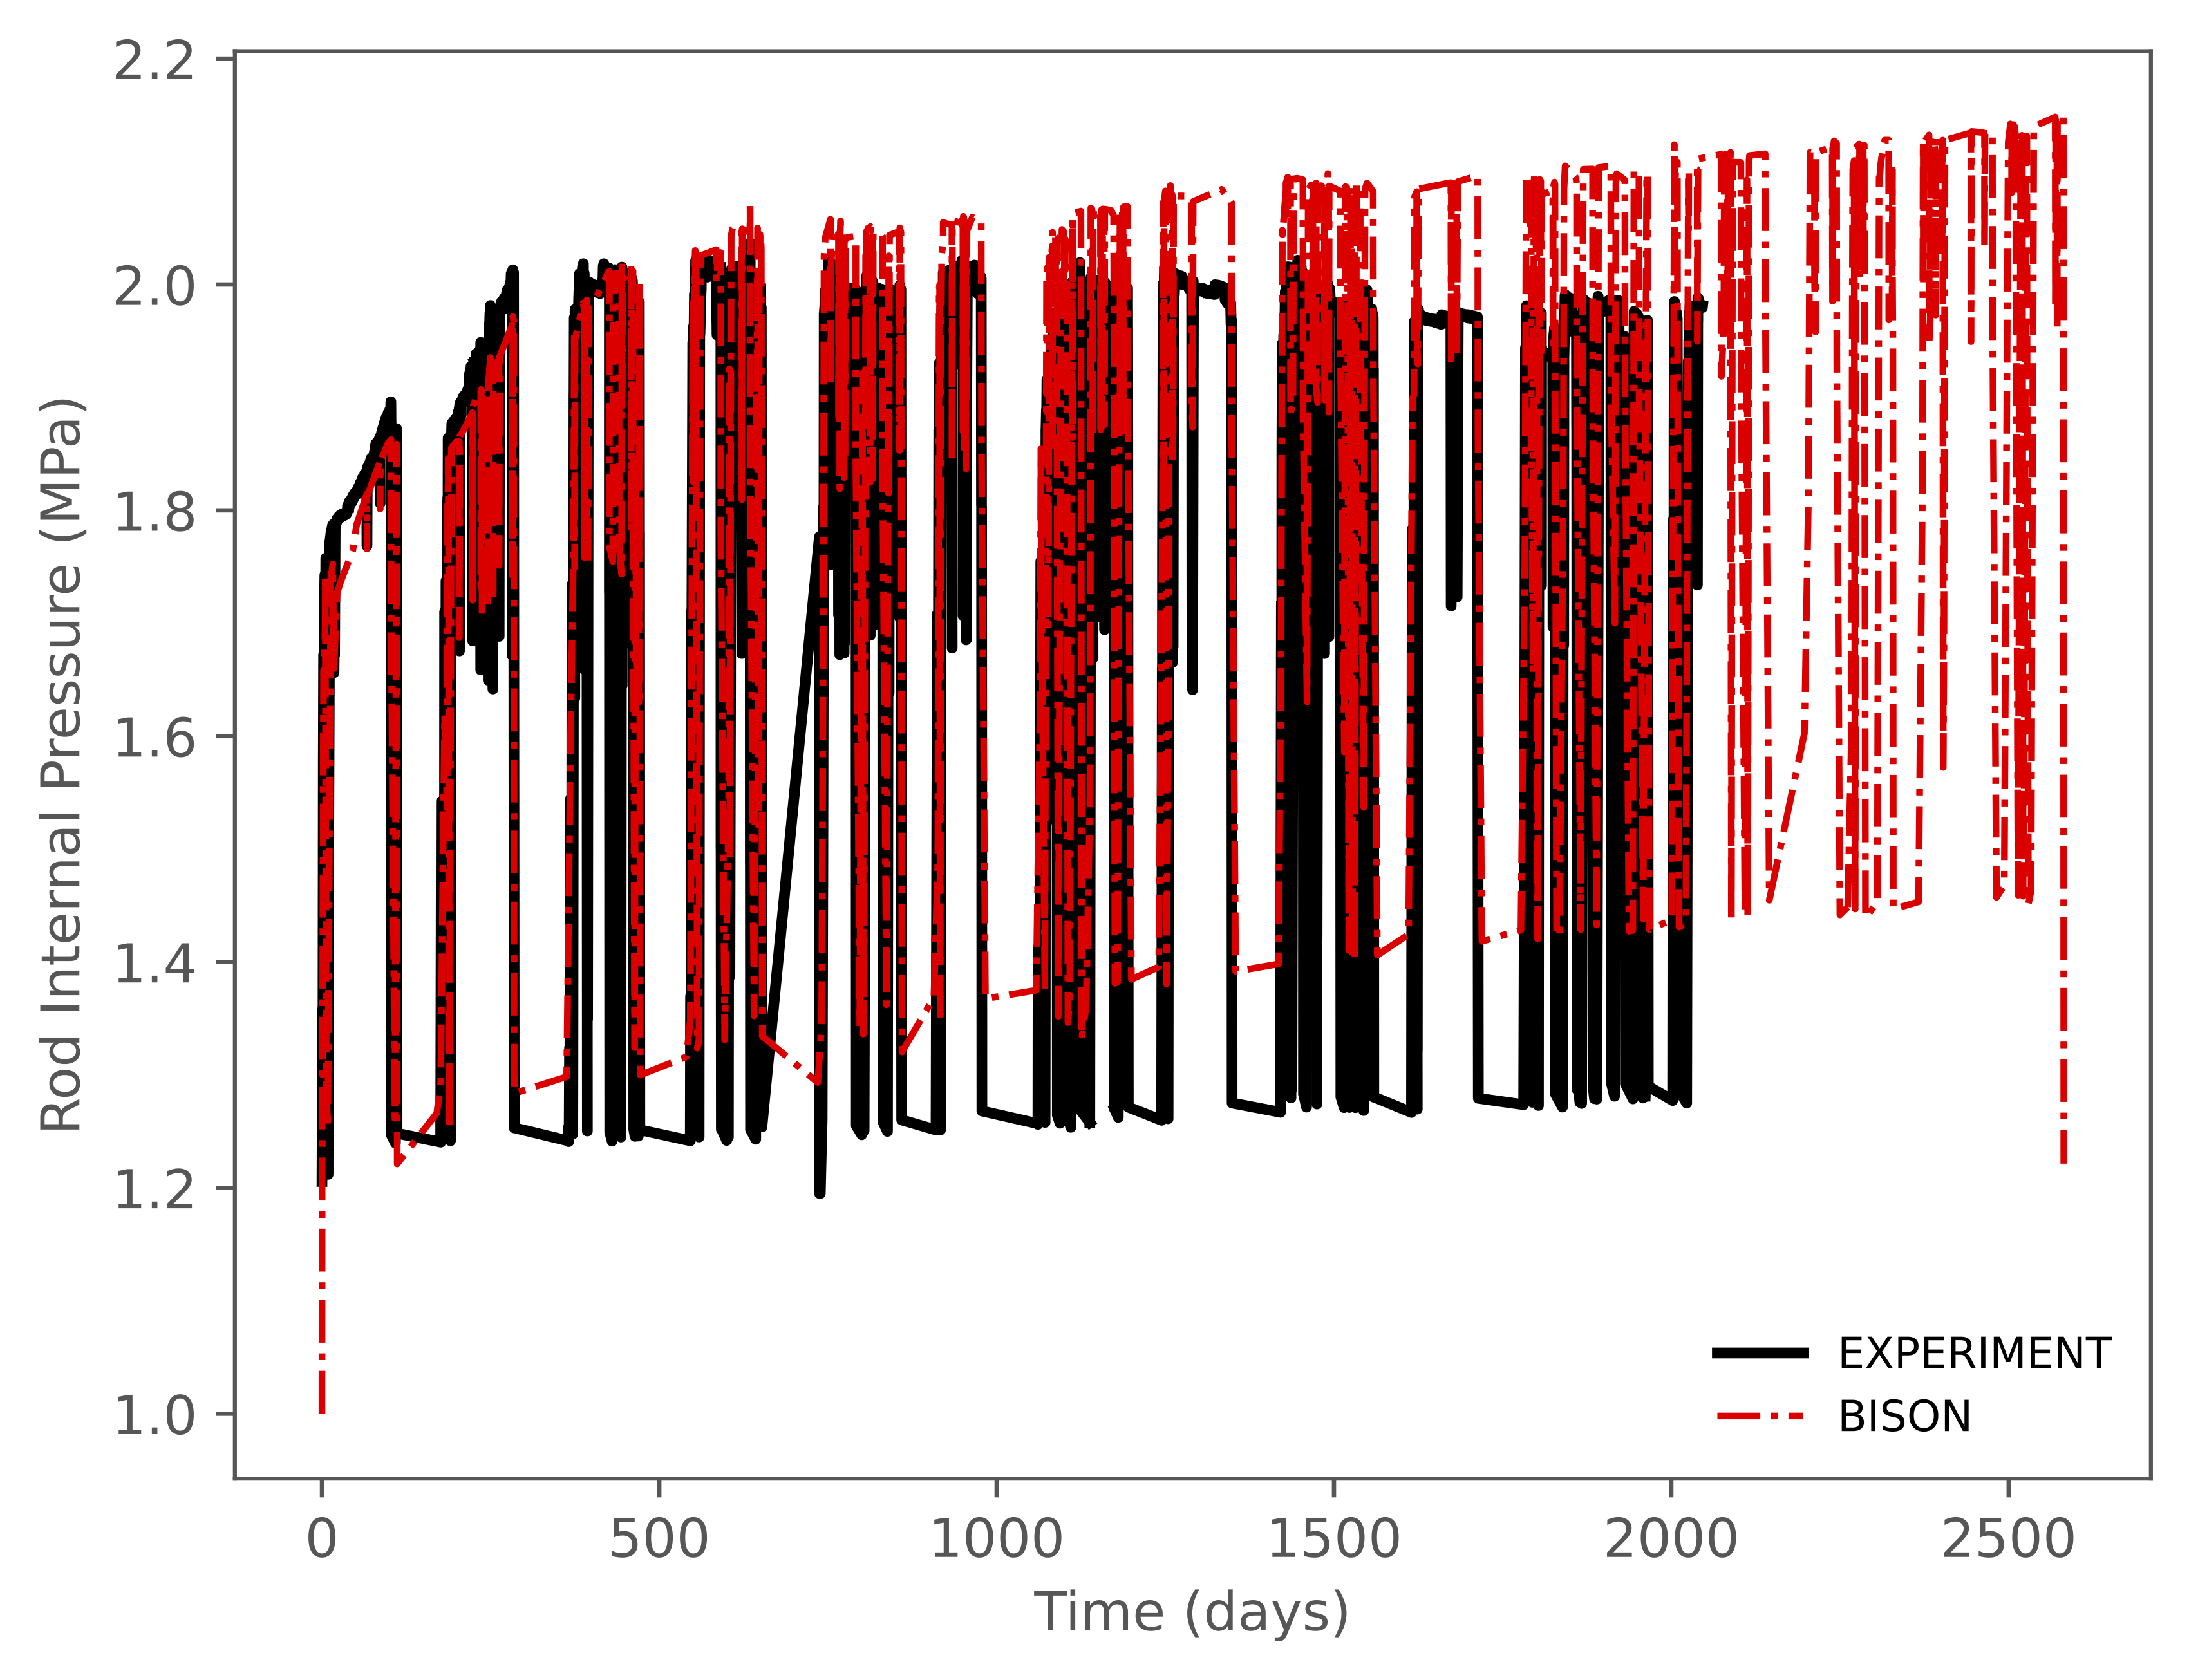
Figure 9: IFA-681.1 rod 3 rod internal pressure histories.
Discussion
The new thermal conductivity model along with the improved gap conductance modeling results in a good aggreement with the measured values for larger gadolinia concentrations. Furthermore, BISON's rod internal pressure predictions are slightly overestimating the expected behavior.
References
- F Khattout.
The Gadolinia fuel test IFA-681: Overview of in-pile measurements from beginning of irradiation to unloading.
Technical Report HWR-1038, OECD Halden Reactor Project, 3 2013.[BibTeX]
- M. Limbäck and T. Andersson.
A model for analysis of the effect of final annealing on the in- and out-of-reactor creep behavior of zircaloy cladding.
In Zirconium in the Nuclear Industry: Eleventh International Symposium, ASTM STP 1295, 448–468. 1996.[BibTeX]
- Ryan Terrence Sweet, Daniel J. vanWasshenova, Daniel Schwen, and Aysenur Toptan.
Compare mechanistic predictions for doped uo2 mechanical response and other properties with empirical models and experimental measurements.
Technical Report, Idaho National Laboratory, 9 2023.[BibTeX]