IFA-562 Rods 15-17
Overview
The IFA-562.2 experiments centered on through life fuel centerline temperature and were part of the Ultra High Burnup (UHB) program. They were irradiated in the Halden Boiling Water Reactor (HBWR) for 2.68 years to a average burnup of approximately 50 MWd/kgUO. The rods were fitted with a fuel centerline expansion thermometer (ET) to measure the fuel centerline temperature during irradiation (P. Lösönen, 1989).
Test Description
Rod Design Specifications
The IFA-562.2 rods were short rods of annular fuel and were enriched to 13% U-235. The fuel and cladding specifications are tabulated in Table 1.
Table 1: IFA-562.2 Test Rod Specifications
| Fuel Rod | Measurement | Unit |
|---|---|---|
| Fuel stack height | 442.5 | mm |
| Nominal plenum height | 31.0 | mm |
| Fuel pellet height | 7.5 | mm |
| Fill gas composition | He | |
| Fill gas pressure | 1.0 | MPa |
| Fuel | Measurement | Unit |
| Material | UO | |
| Enrichment | 13 | |
| Density | 94 | |
| Inner diameter | 2 | mm |
| Outer diameter | 5.915 | mm |
| Pellet geometry | flat end | |
| Insulator Pellet | Measurement | Unit |
| Material | natural UO | |
| Inner diameter | 1.80 | mm |
| Outer diameter | 5.56 | mm |
| Pellet length | 7.5 | mm |
| Cladding | Measurement | Unit |
| Material | Zr-2 | |
| Outer diameter | 7.015 | mm |
| Inner diameter | 6.015 | mm |
| Wall thickness | 0.5 | mm |
Operating Conditions and Irradiation History
The HBWR operating conditions are tabulated in Table 2. The reactor power history is shown in Figure 1. The measured reactor coolant temperature was used as the boundary temperature on the cladding outer surface.
Table 2: Operational input parameters.
| Average coolant temperature | C | 230 |
| Coolant pressure | MPa | 3.4 |
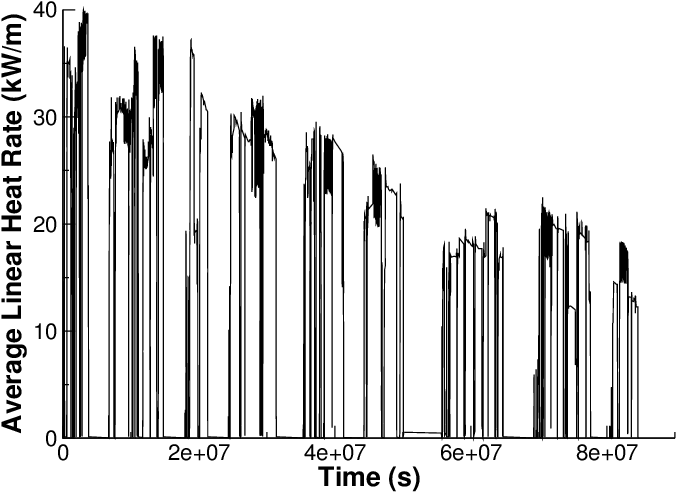
Figure 1: Through life power profile for IFA-562.2 rod 15. Note: Rods 15-17 power histories were very similar.
Model Description
Geometry and Mesh
The assumed geometry and mesh are shown in Figure 2 and Figure 3. The fuel pellet stack was modeled as a smeared column with merged insulator pellets. The insulator pellets were modeled as UO, meaning they the same mechanical and thermal properties of the rest of the column. The expansion thermometer was modeled as a void in the pellet/insulator stack; this was done to ease the simulation. The BISON fuel centerline temperature was calculated as an average of the pellet interior (BISON sideset 13). The plenum length for the mesh was adjusted from the experiment length to account for the difference in volume caused by the voided expansion thermometer. The initial gas volumes for the simulations were as listed in (P. Lösönen, 1989). A 2-dimensional axisymmetric quadratic mesh was used. The fuel column was meshed with 177 axial and 11 radial elements (aspect ratio 14) and the insulator pellets with 3 axial and 11 radial elements (aspect ratio 14). The cladding was meshed with 183 axial and 4 radial elements (aspect ratio 23.3).

Figure 2: Close-up view of the IFA-562.2 rod 15. Note: This is only a cut from the bottom of the fuel rod meant to show the fuel and insulator pellet. The volume where the expansion thermometer would be in the experiment can also be seen.
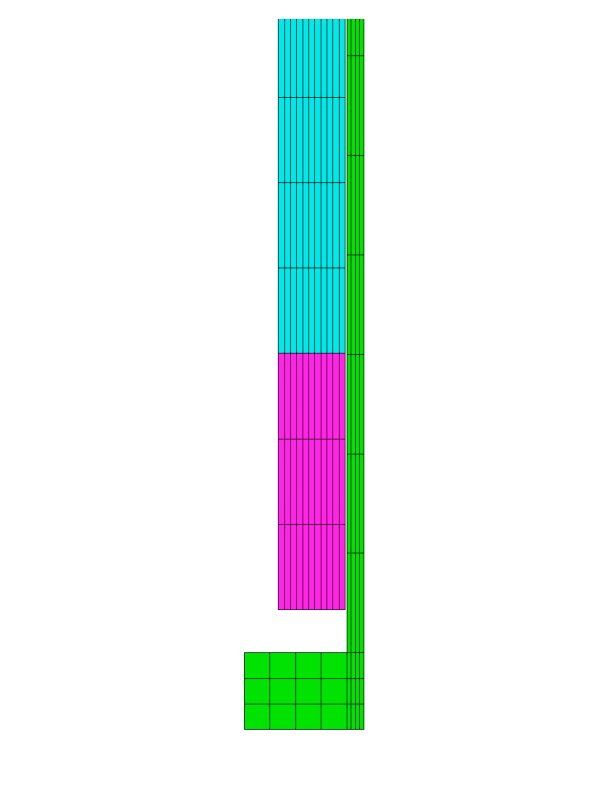
Figure 3: Close-up view of the IFA-562.2 rod 15. Note: This is only a cut from the bottom of the fuel rod meant to show the fuel and insulator pellet. The volume where the expansion thermometer would be in the experiment can also be seen.
Material and Behavioral Models
The following material and behavioral models were used for the fuel:
UO2Thermal - NFIR: For temperature and burnup dependent thermal properties.
ComputeFiniteStrainElasticStress and UO2ElasticityTensor: elastic mechanical behavior
UO2VolumetricSwellingEigenstrain: volumetric expansion due to solid and gaseous swelling
UO2RelocationEigenstrain: relocation strains, relocation activation threshold power set to 5 kW/m
ComputeThermalExpansionEigenstrain:thermal expansion with a constant instanteous thermal expansion coefficient
UO2Sifgrs: fission gas release model used with the gaseous swelling model
UO2VolumetricSwellingEigenstrain
For the clad material, a constant thermal conductivity of 16 W/m-K was used and both thermal (primary and secondary) and irradiation creep were considered using the Limback creep model (Limbäck and Andersson, 1996). The following material and thermal behavior models were used for the cladding:
HeatConductionMaterial: Thermophysical material properties
ZryCreepLimbackHoppeUpdate and ZryElasticityTensor: mechanical creep and elastic deformation behavior for Zircaloy-2
ZryIrradiationGrowthEigenstrain: ESCORE model for volumetric swelling due to irradiation exposure
ZryThermalExpansionMATPROEigenstrain: thermal expansion of Zircaloy with the MATPRO model
Details and references for all of these models listed above can be found on the linked BISON documentation pages.
Input files
The BISON input and all supporting files (power histories, axial power profile, cladding surface temperature boundary condition, fast neutron flux history, etc.) for this case are provided with the code distribution at bison/assessment/LWR/validation/IFA_515_RodA1/analysis.
To avoid code duplication, the input files are built as follows: A base input file contains characteristics common to the entire assessment case. Specific model, numerical, and configuration parameters are listed in .params files, as well as locations to irradiation history data. The base input files require the information contained in the .params files and cannot run on its own. To run a specific assessment case, the input file can be created by listing the rod pair base file and the desired parameters, such as, for IFA_562_17: IFA_562_Base.i IFA_562_17.params
Simulation Parameters and Assumptions
As mentioned in the Geometry & Mesh section, the mesh used is not an exact representation of the experiment. The insulator pellets were not included in the heat source term. The expansion thermometer was physically neglected in this mesh. This was done to alleviate troubles with thermal and mechanical properties between the thermometer and the fuel/insulator stack. The plenum length of the fuel rod was adjusted to account for the extra gas volume made from the voided thermometer. The simulation initial gas volumes were as listed in (P. Lösönen, 1989). The initial fuel grain size and the fuel roughness were not given in (P. Lösönen, 1989). The value of 7.75e-6 m was used for the initial grain size. This value was taken from IFA-515A1. The BISON default value of 2e-6 was used for the fuel roughness. Peaking factors were not given for this experiment. It is assumed that the rod were short enough that they did not experience much power tilting.
Results Comparison
A BISON postprocessor was used to extract the centerline temperature as an average of the interface of the pellet interior surface and the ET (BISON sideset 13). This provides an accurate representation of the average fuel centerline temperature since, in this case, no axial variation in fuel temperature.
Temperature
BISON's temperature predictions are compared to the experimental measurements for each rod in the following sections. Differences between the measurements and the BISON predictions are quantified in terms of the validation metrics to understand how well the code predictions statistically behave against the experimental measurements.
Rod 15
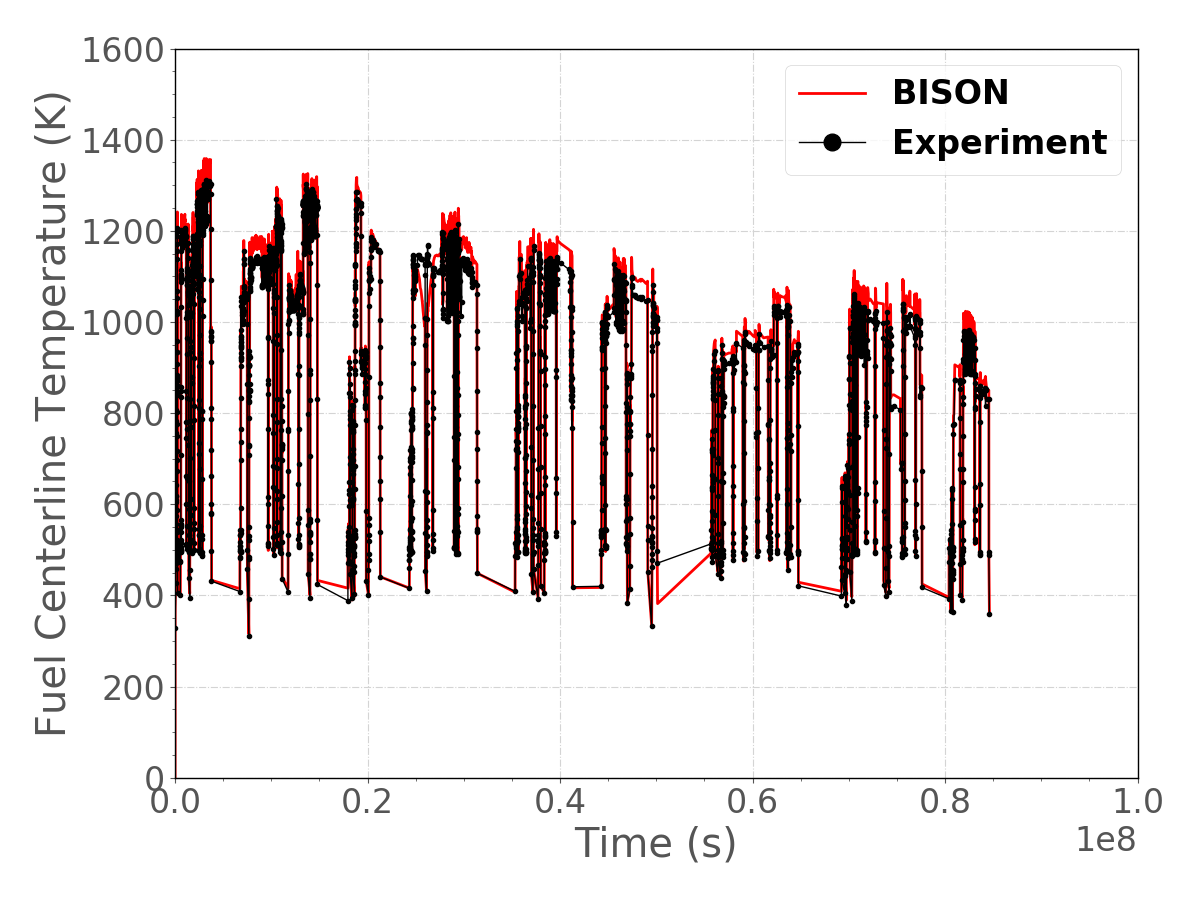
Figure 4: Fuel centerline temperature histories for IFA-562.2 rod 15.
Figure 4 shows the fuel centerline temperature history for IFA-562.2 Rod 15. The measured fuel centerline temperatures are compared against the BISON predictions in Figure 5 at three different burnup ranges (in MWd/kgUO): [0,20), [20,40), and [40,60). Differences between the measurements and the BISON predictions are quantified in terms of the validation metrics. These are tabulated in Table 3. BISON slightly overpredicts the fuel centerline temperatures at higher temperatures and higher burnup ranges. However, this overprediction occurs with an average relative error of 3.0%. Overall, the computed -scores are very close to the ideal score of 1.0, meaning that the code predictions are in near optimal agreement with the measurements.
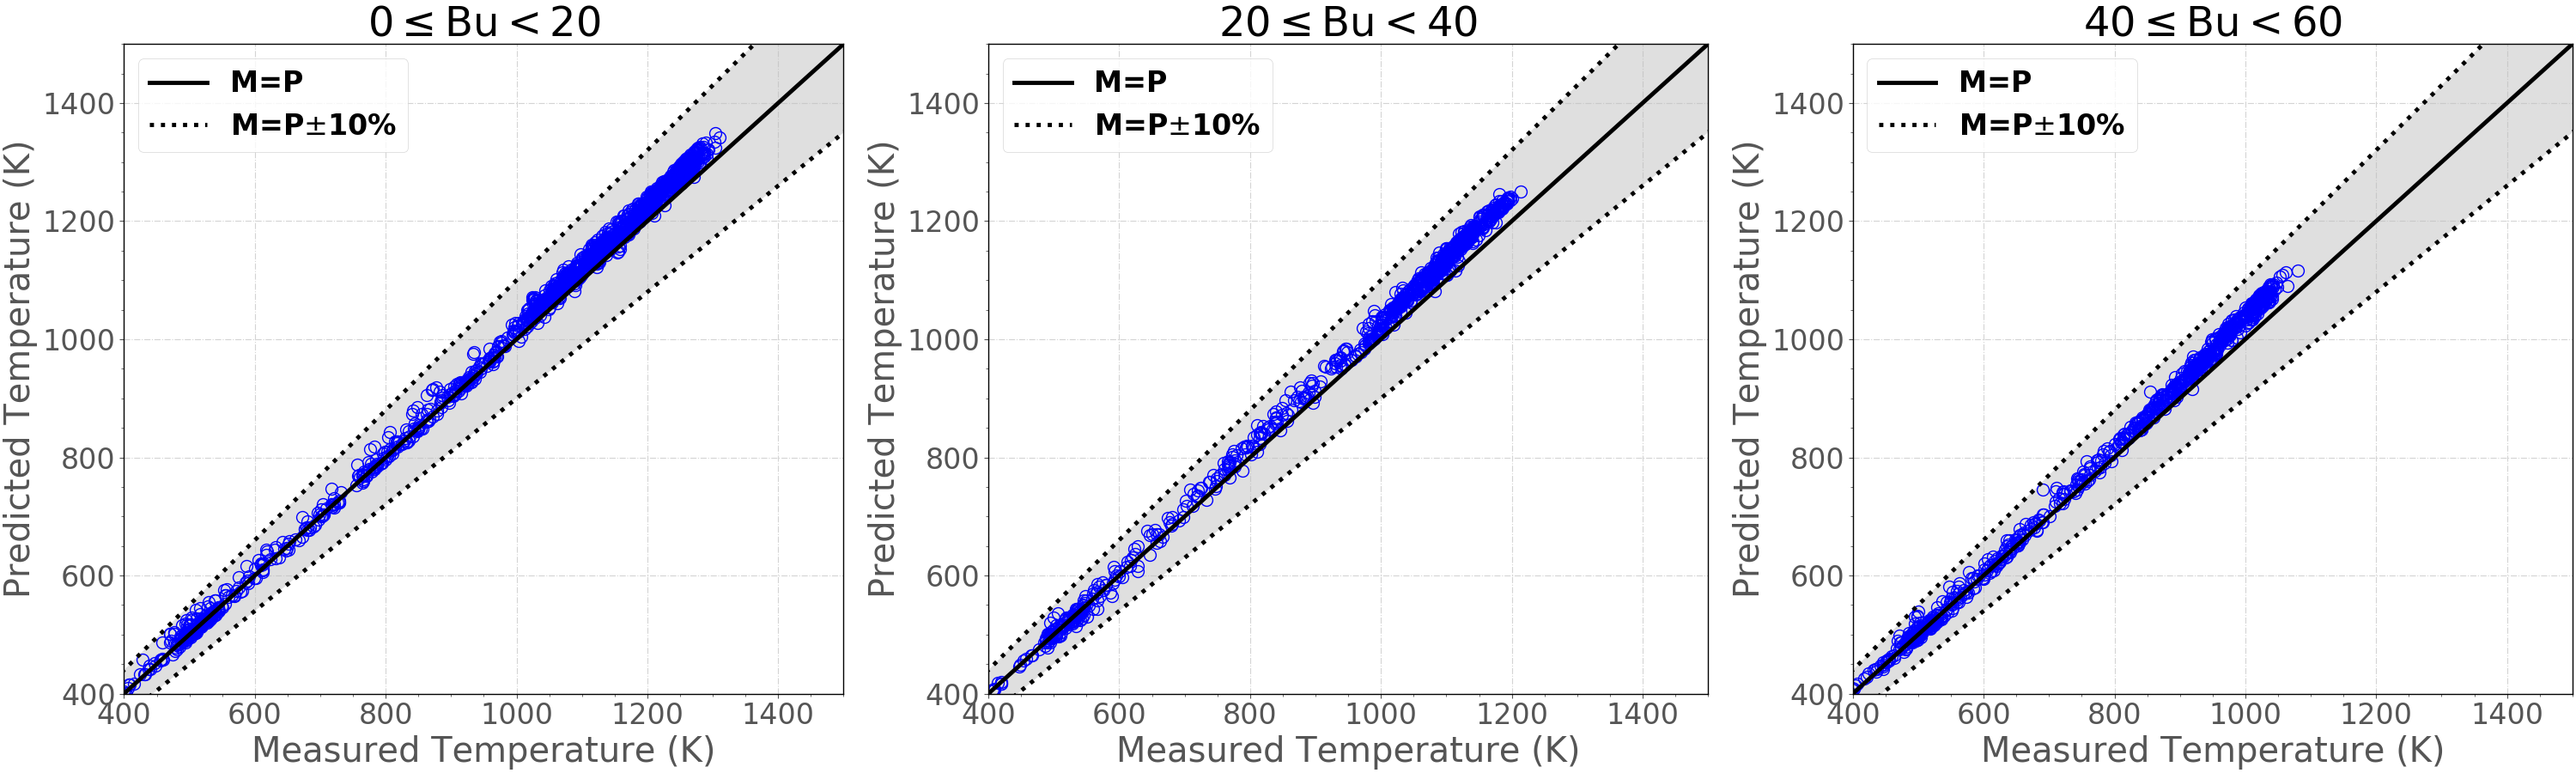
Figure 5: Measured fuel centerline temperatures against the BISON predictions for IFA-562.2 Rod 15 at three different burnup ranges ( for measured; for predicted).
Table 3: The validation metrics for the fuel centerline temperature predictions.
| Experiment | (-) | II (K) | RMSE (K) | rRMSE (%) |
|---|---|---|---|---|
| 0Bu20 | 0.991 | 47.1 | 23.7 | 2.2 |
| 20Bu40 | 0.983 | 65.3 | 31.5 | 3.0 |
| 40Bu60 | 0.984 | 56.9 | 27.7 | 3.0 |
Rod 16
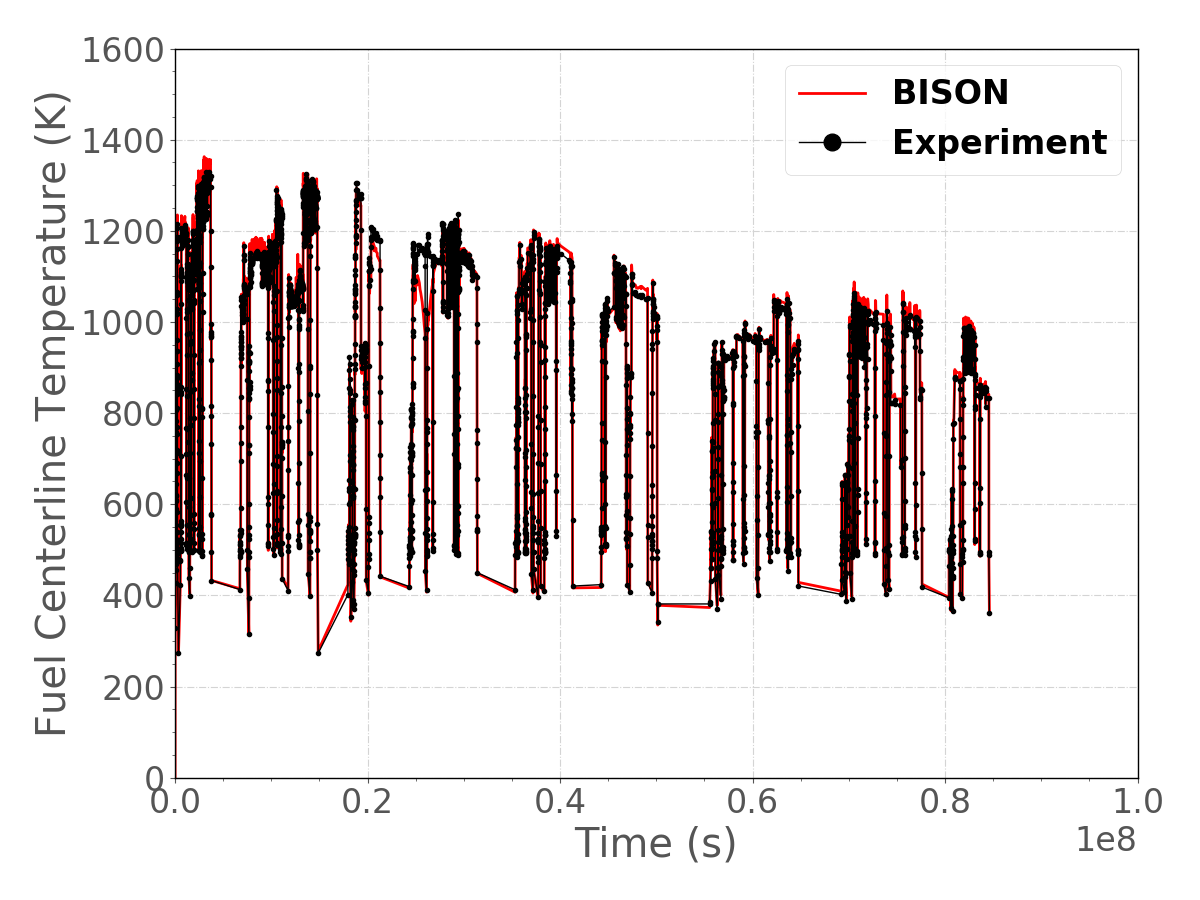
Figure 6: Fuel centerline temperature histories for IFA-562.2 rod 16.
Figure 6 shows the fuel centerline temperature history for IFA-562.2 Rod 16. The measured fuel centerline temperatures are compared against the BISON predictions in Figure 7 at three different burnup ranges (in MWd/kgUO): [0,20), [20,40), and [40,60). Differences between the measurements and the BISON predictions are quantified in terms of the validation metrics. These are tabulated in Table 4. BISON's predictions are in near optimal agreement with the measurements (-score 1.0), with less than 2% average relative error.
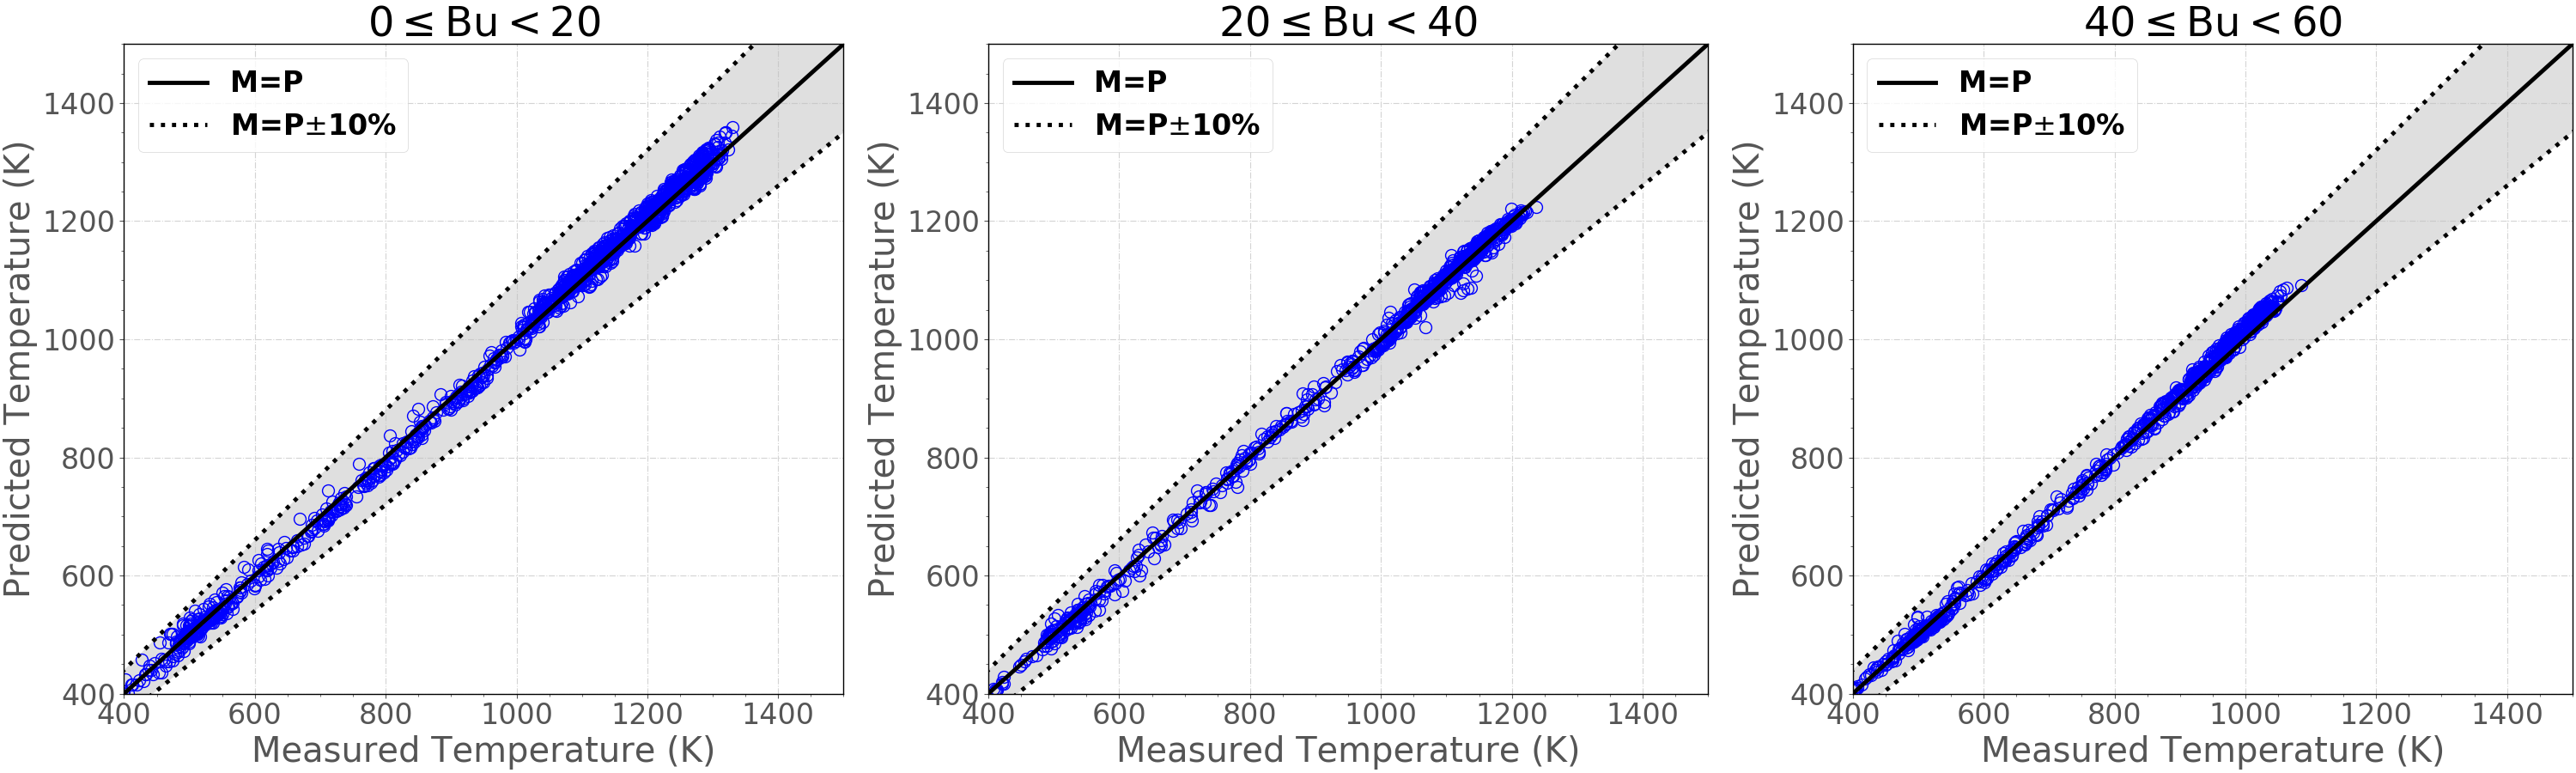
Figure 7: Measured fuel centerline temperatures against the BISON predictions for IFA-562.2 Rod 16 at three different burnup ranges ( for measured; for predicted).
Table 4: The validation metrics for the fuel centerline temperature predictions.
| Experiment | (-) | II (K) | RMSE (K) | rRMSE (%) |
|---|---|---|---|---|
| 0Bu20 | 0.997 | 33.0 | 13.8 | 1.5 |
| 20Bu40 | 0.998 | 49.6 | 10.4 | 1.2 |
| 40Bu60 | 0.996 | 31.6 | 13.7 | 1.6 |
Rod 17
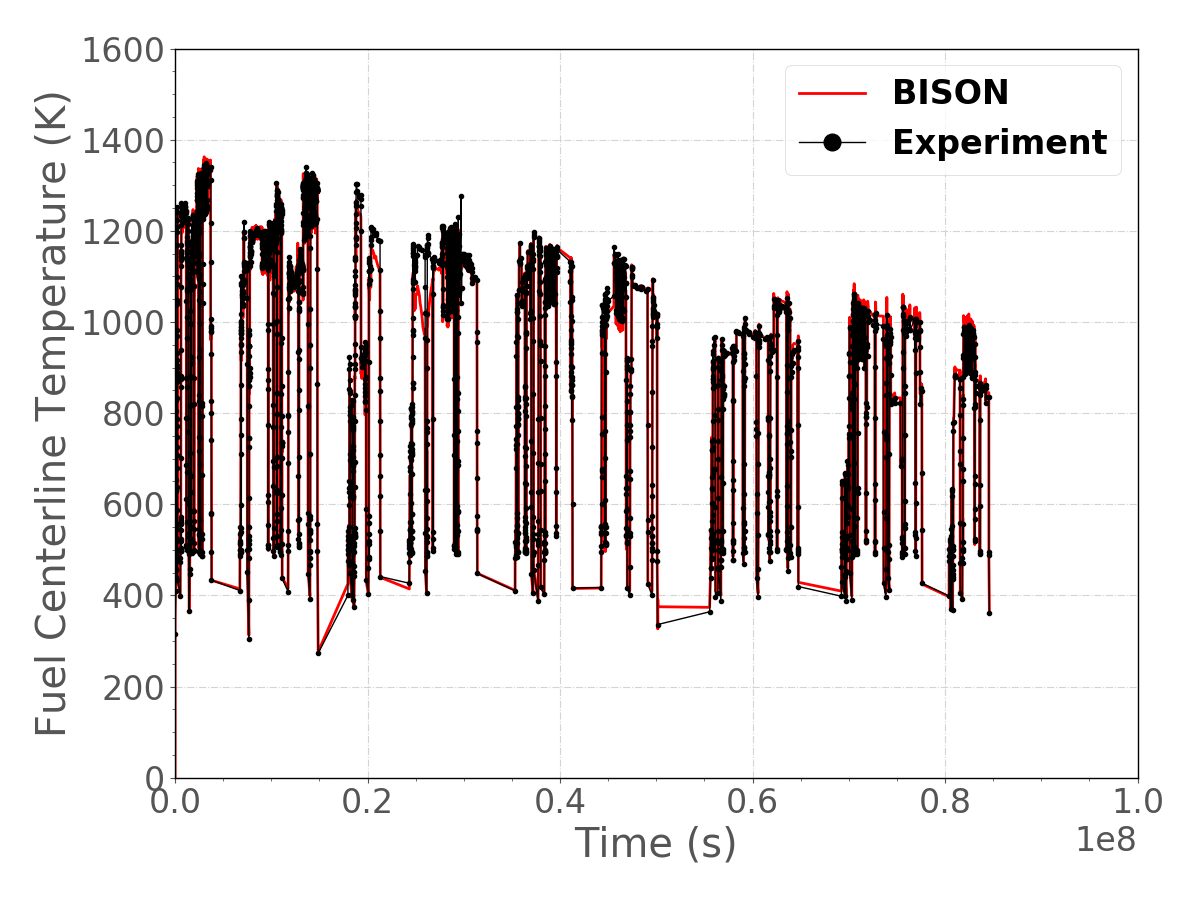
Figure 8: Fuel centerline temperature histories for IFA-562.2 rod 17.
Figure 8 shows the fuel centerline temperature history for IFA-562.2 Rod 17. The measured fuel centerline temperatures are compared against the BISON predictions in Figure 9 at three different burnup ranges (in MWd/kgUO): [0,20), [20,40), and [40,60). Differences between the measurements and the BISON predictions are quantified in terms of the validation metrics. These are tabulated in Table 5. BISON's predictions are in near optimal agreement with the measurements (-score 1.0), within an average relative error of 1.5%.
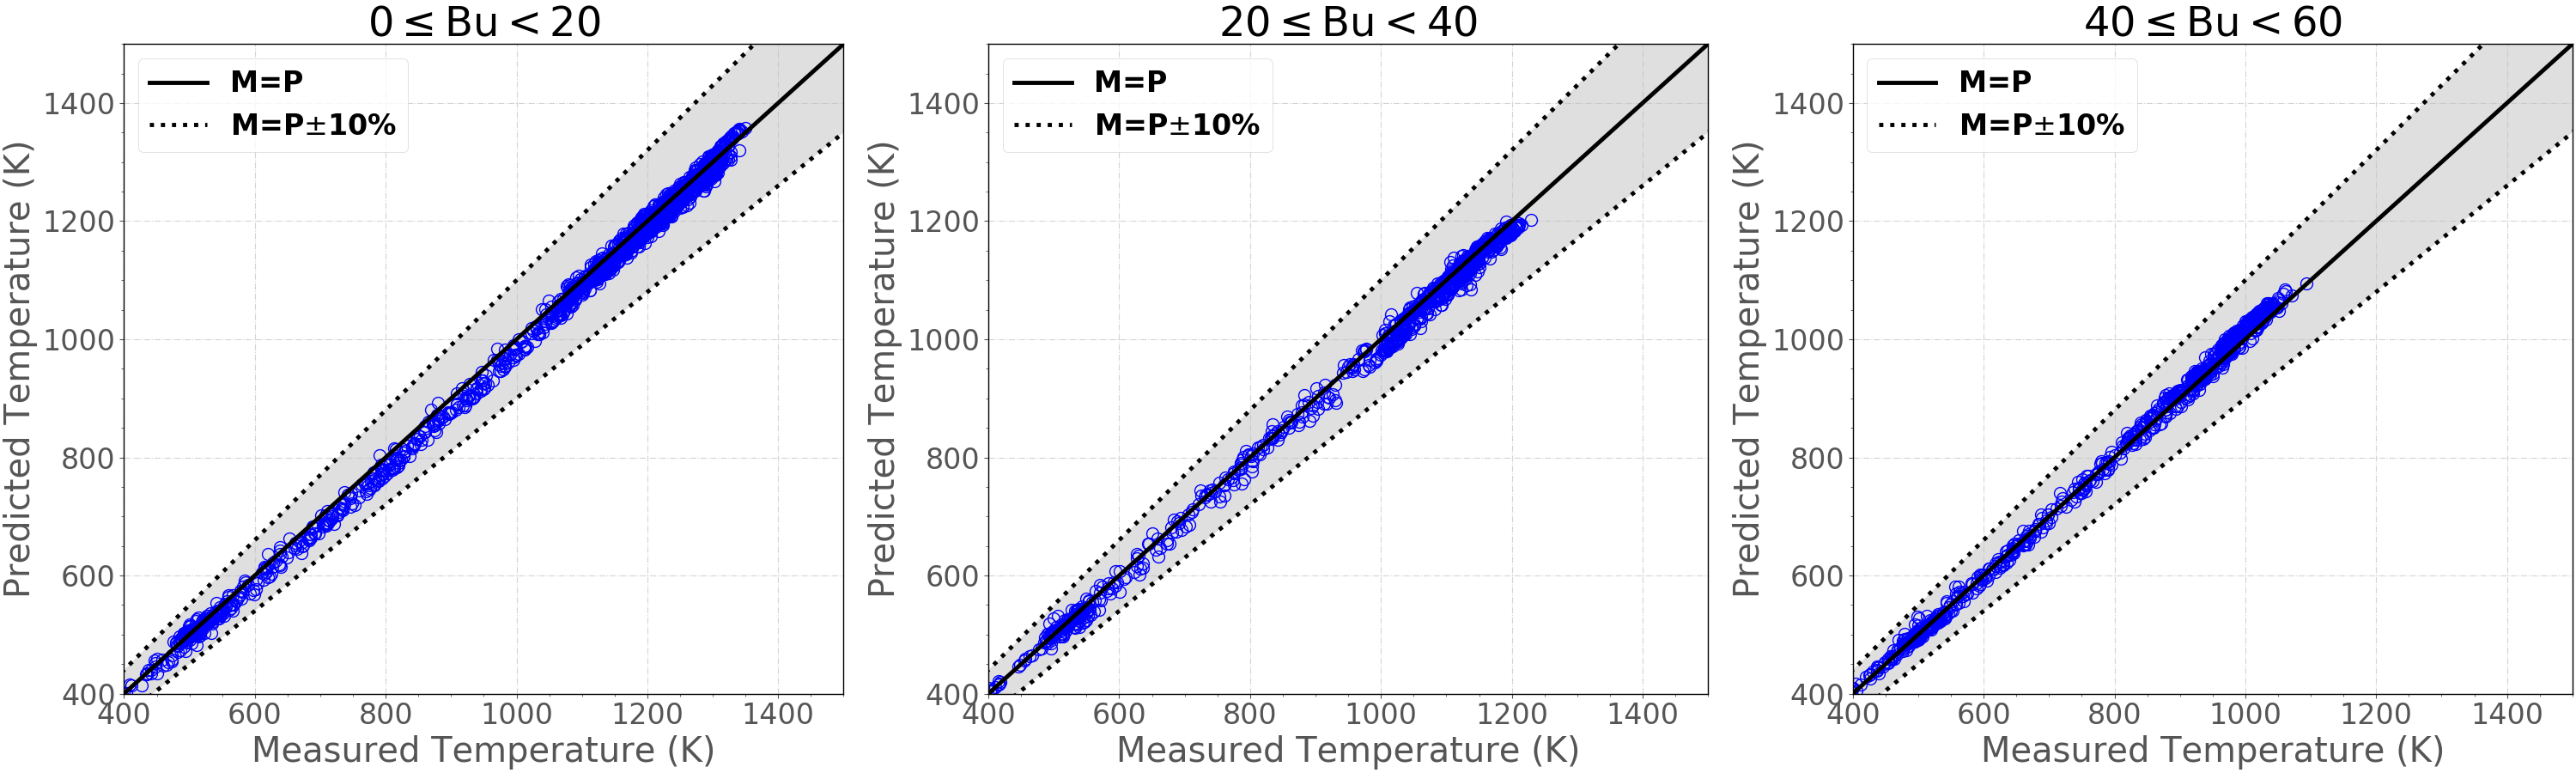
Figure 9: Measured fuel centerline temperatures against the BISON predictions for IFA-562.2 Rod 17 at three different burnup ranges ( for measured; for predicted).
Table 5: The validation metrics for the fuel centerline temperature predictions.
| Experiment | (-) | II (K) | RMSE (K) | rRMSE (%) |
|---|---|---|---|---|
| 0Bu20 | 0.997 | 34.8 | 14.5 | 1.5 |
| 20Bu40 | 0.996 | 53.0 | 14.1 | 1.5 |
| 40Bu60 | 0.996 | 31.0 | 12.9 | 1.5 |
Discussion
Fuel centerline temperature comparisons between BISON and the measured results show near optimal agreement. This can be observed from the -score, which is very close to its ideal score of 1.0. The results indicate that enhanced gap conductance modeling in Toptan et al. (2020) improves the code's temperature predictions as compared to the predictions obtained by the legacy gap conductance modeling in Williamson et al. (2016).
References
- M. Limbäck and T. Andersson.
A model for analysis of the effect of final annealing on the in- and out-of-reactor creep behavior of zircaloy cladding.
In Zirconium in the Nuclear Industry: Eleventh International Symposium, ASTM STP 1295, 448–468. 1996.[BibTeX]
- Aysenur Toptan, Jason D. Hales, Richard L. Williamson, Stephen R. Novascone, Giovanni Pastore, and David J. Kropaczek.
Modeling of gap conductance for LWR fuel rods applied in the BISON code.
Journal of Nuclear Science and Technology, 57(8):963–974, 2020.
doi:10.1080/00223131.2020.1740808.[BibTeX]
- R.L. Williamson, K.A. Gamble, D.M. Perez, S.R. Novascone, G. Pastore, R.J. Gardner, J.D. Hales, W. Liu, and A. Mai.
Validating the BISON fuel performance code to integral LWR experiments.
Nuclear Engineering and Design, 301:232–244, 2016.
doi:10.1016/j.nucengdes.2016.02.020.[BibTeX]
- P. Lösönen.
Early-in-life irradiation of IFA-562.2 (The Ultra High Burn-up Experiment).
Technical Report HWR-247, Halden, December 1989.[BibTeX]