IFA-535.5-6 Rods 809-812
Overview
The IFA-535 experiment was carried out during the Halden reactor project. This particular test examined the effect of pre-pressurization on fission gas release in high burnup BWR-type fuel rods. In this test four rods of identical design and base irradiation history were irradiated up to a burnup of 44 MWd/kg UO. At the end of the base irradiation, the rods were reinstrumented with pressure transducers and clad elongation sensors. Upon refitting, the rods underwent further irradiation to examine the effects of plenum pressure on fission gas release.
Test Description
The four rods were divided between two tests. Rods 809 and 810 were part of the IFA-535.5 test which consisted of a slow power ramp over several days up to 52 kW/m. Fuel rods 811 and 812 comprised test IFA-535.6 which ramped more quickly to 44 kW/m in 24 hours. The base irradiation of the four rods was completed in the upper cluster of IFA-409 from May 1973 to June 1985. During refabrication, the fission gas from the base irradiation was measured; and the rods were pressurized with helium-809/811 and 810/812 to about 0.73 and 3.2 MPa, respectively, at 22 degrees Celsius. The rods were in reactor position 4-10 from November 1985 to February 1986 for the ramp test. The rods were removed from the reactor after reaching a burnup of 48 MWd/kgUO.
Rod Design Specifications
Specifications for the rods in the IFA-535 experiment are summarized in Table 1. The clad thickness includes the 13m niobium linear, as the liner is not modeled for simplicity and is incorporated into the cladding thickness.
Table 1: IFA-535.5-6 Test Rod Specifications
| Fuel Rod | Measurement | Unit |
|---|---|---|
| Overall length | 0.560019 | m |
| Fuel stack height | 0.286 | m |
| Nominal plenum height | 70.166 | mm |
| Base Irradiated Rod | Measurement | Unit |
| Fill gas composition | He | |
| Fill gas pressure | 0.1 | MPa |
| Re-Fabricated Rod 809 | Measurement | Unit |
| Fill gas composition | He | |
| Fill gas pressure | 0.7 | MPa |
| Re-Fabricated Rod 810 | Measurement | Unit |
| Fill gas composition | He | |
| Fill gas pressure | 3.2 | MPa |
| Re-Fabricated Rod 811 | Measurement | Unit |
| Fill gas composition | He | |
| Fill gas pressure | 0.76 | MPa |
| Re-Fabricated Rod 812 | Measurement | Unit |
| Fill gas composition | He | |
| Fill gas pressure | 3.21 | MPa |
| Fuel | Measurement | Unit |
| Material | UO | |
| Enrichment | 9.88 | |
| Density | 94.7 | |
| Inner diameter | - | mm |
| Outer diameter | 10.54 | mm |
| Pellet geometry | flat ends, chamfered | |
| Grain diameter | 9.36 (not given assumed as per (Rossiter, 2012)) | m |
| Pellet Dishing | Measurement | Unit |
| Chamfer width | not given | cm |
| Chamfer depth | not given | cm |
| Cladding | Measurement | Unit |
| Material | Zr-2 | |
| Outer diameter | 12.56 | mm |
| Inner diameter | 10.81 | mm |
| Wall thickness | 0.88 | mm |
Operating Conditions and Irradiation History
The base irradiation's average power history is shown in Figure 1. The average power during the bump test is shown in Figure 2. According to Rossiter (Rossiter, 2012), the base irradiation powers were given as average powers over a time step. Following the same format as Rossiter, the power was therefore ramped to the average power of the step at a rate of 10 kW/m per hour where it then remained at the average power for the remainder of the time step. The ramp test values were given as point values, and the power profile was linearly interpolated between these values. There was a significant axial power profile across the length of the fuel stack through both the base irradiation and the ramp test which underwent minor fluctuations in each. To illustrate the significance of the axial profile, a plot of the profile at the end of base irradiation (prior to refabrication) and at the end of the ramp test (prior to shut down) is provided in Figure 3.
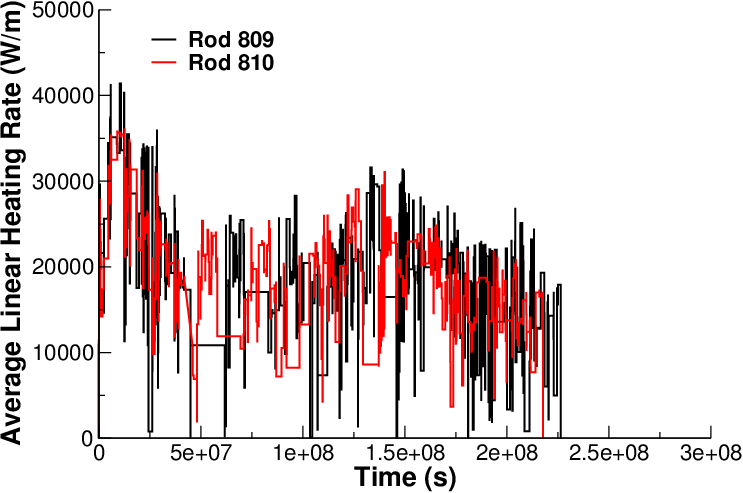
Figure 1: IFA-409 base irradiation used for all IFA-535 tests.
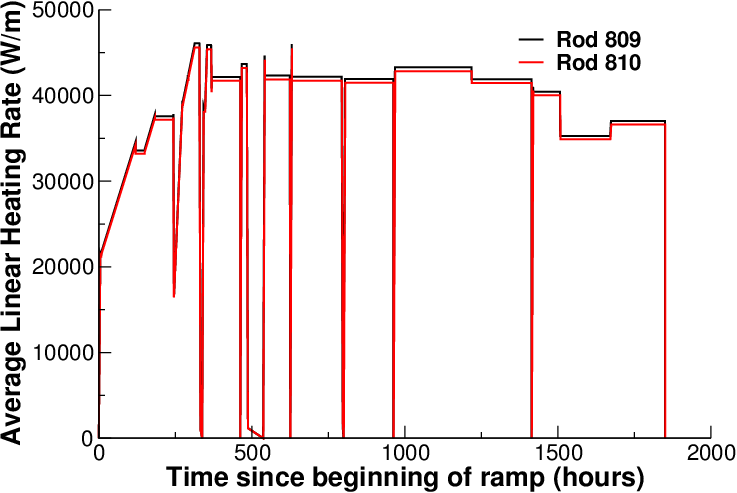
Figure 2: Average power history during the IFA-535.5 ramp test.
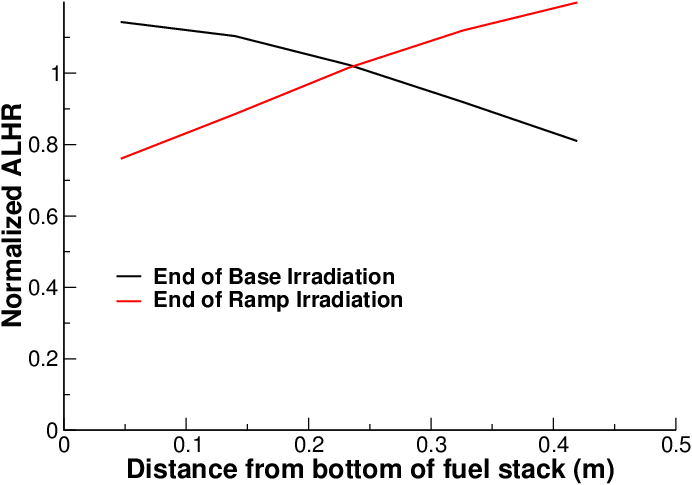
Figure 3: The axial power profile at the end of the base irradiation and the end of the ramp.
The cladding's surface-temperature history was input as a function, as was the fast neutron flux, from data provided in the FUMEX-III data set (IAEA, 2008-2012). The coolant's pressure for the base irradiation and power ramp was 3.2 MPa. The clad temperature, fast flux, and axial peaking factors were modified so that the same ramp rates as in the power history are applied. This ensures that the times used are consistent throughout the model.
Model Description
Geometry and Mesh
The geometric parameters specified in Table 1 were used to create the mesh for this simulation. The fuel was meshed as a smeared fuel rod with 11 radial elements and 135 axial elements. The refabricated rod length was used for the mesh in both the base irradiation and ramp periods.
To account for the correct gas volume, the plenum height was adjusted such that the overall voidage - including radial gap, bottom plenum, and top plenum - was equivalent to the refabricated volume at the beginning of the ramp irradiation. The lower plenum was equal to the length of the insulator pellet that was not modeled.
Material and Behavioral Models
The following material and behavioral models were used for the fuel:
UO2Thermal - NFIR: For temperature and burnup dependent thermal properties.
ComputeFiniteStrainElasticStress and UO2ElasticityTensor: elastic mechanical behavior
UO2VolumetricSwellingEigenstrain: volumetric expansion due to solid and gaseous swelling
UO2RelocationEigenstrain: relocation strains, relocation activation threshold power set to 5 kW/m
ComputeThermalExpansionEigenstrain:thermal expansion with a constant instanteous thermal expansion coefficient
UO2Sifgrs: fission gas release model used with the gaseous swelling model
UO2VolumetricSwellingEigenstrain
For the cladding material, a constant thermal conductivity of 16 W/m-K was used and both thermal and irradiation creep were considered using the Limback model (Limbäck and Andersson, 1996). The following material and thermal behavior models were used for the cladding:
HeatConductionMaterial: Thermophysical material properties
ZryCreepLimbackHoppeUpdate and ZryElasticityTensor: mechanical creep and elastic deformation behavior for Zircaloy-4
ZryIrradiationGrowthEigenstrain: ESCORE model for volumetric swelling due to irradiation exposure
ZryThermalExpansionEigenstrain: thermal expansion of Zircaloy with a constant thermal expansion coefficient
Input files
The BISON input and all supporting files (power histories, axial power profile, fast neutron flux history, etc.) for these cases are provided with the code distribution at bison/assessment/LWR/validation/IFA_535/analysis/.
Results Comparison
In this section the BISON simulation results are compared against the experimental data provided in the FUMEX-III data set. Measurements were provided for the rod internal pressure, fission gas release percentage, and clad elongation. At the present time BISON is unable to predict clad elongation, and therefore clad elongation comparisons are not included.
Rod Internal Pressure
The rod internal pressure results for the four rods are presented in Figure 4 through Figure 7. The initial pressure at the beginning of the ramp was 0.7 MPa and 3.2 MPa for rods 809 and 810, respectively; and rods 811 and 812 were likewise respectively started at 0.76 MPa and 3.21 MPa. It is observed that BISON over-predicts the internal pressure for rods 809 and 812 while it under-predicts the pressure for rods 810 and 811. BISON predicts the correct trends in all cases, and the pressure drops during power decreases are much larger in magnitude than observed in the experimental data.
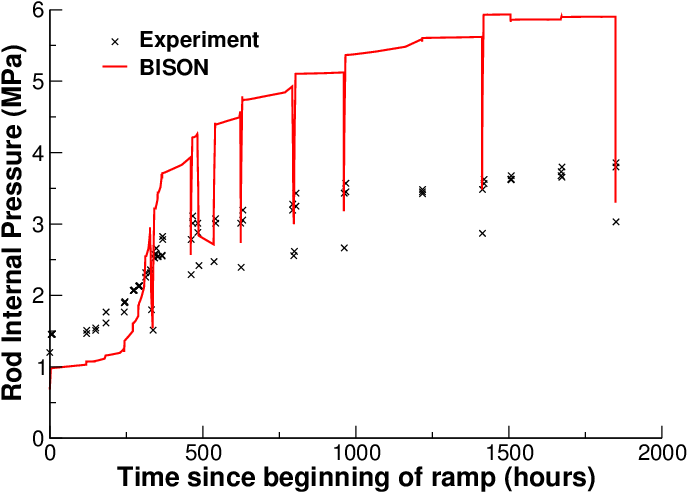
Figure 4: Rod internal pressure experimental comparison of IFA-535 rod 809 during the ramp test.
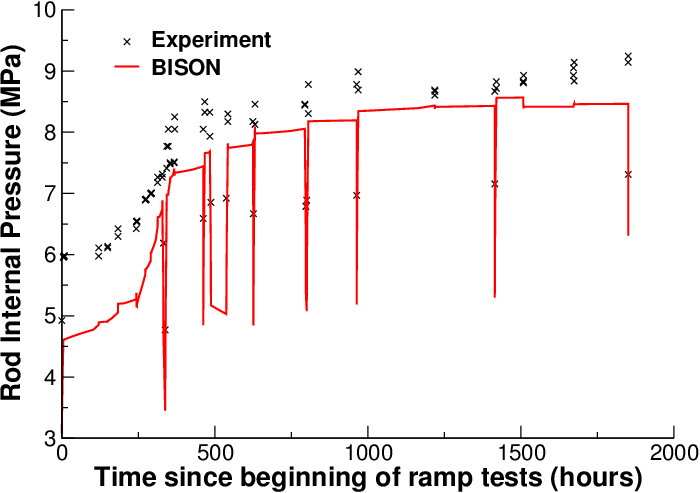
Figure 5: Rod internal pressure experimental comparison of IFA-535 rod 810 during the ramp test.
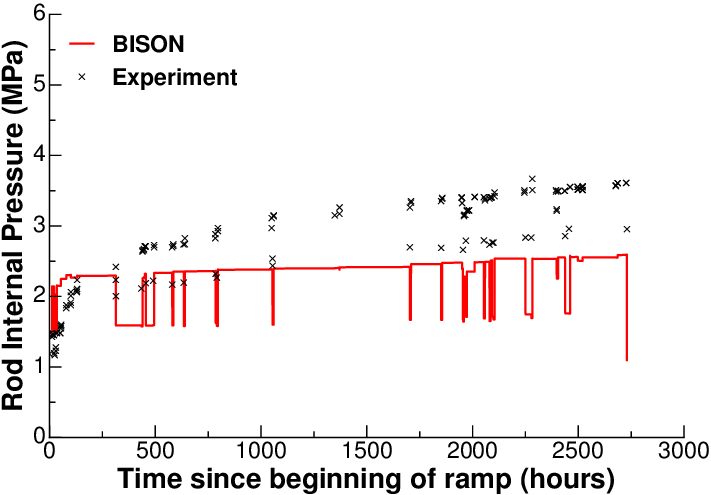
Figure 6: Rod internal pressure experimental comparison of IFA-535 rod 811 during the ramp test.
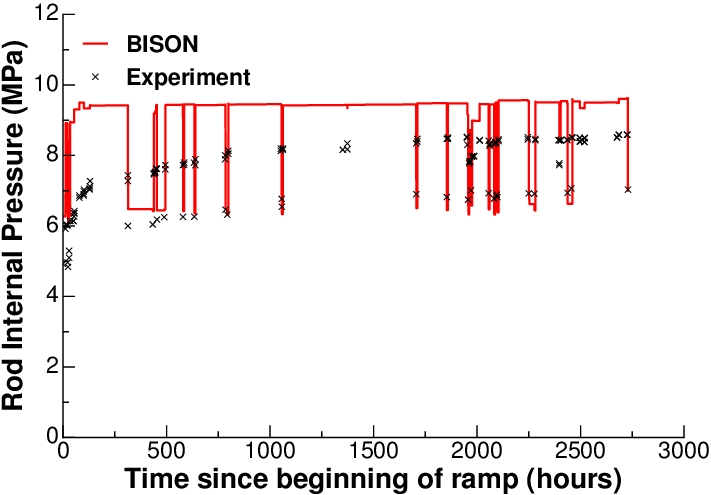
Figure 7: Rod internal pressure experimental comparison of IFA-535 rod 812 during the ramp test.
Fission Gas Release
The fission gas release results for IFA-535 cases 5 & 6 (rods 809-812) are presented in Figure 8 through Figure 11. At the end of the base irradiation, PIE measurements obtained 19.6% and 16.2% fission gas for rods 809 and 810; and PIE measurements for rods 811 and 812 respectively recorded 21.7% and 16.6%. However, the experimental data gives values that are slightly different at the end of the base irradiation (22%, 16.9%, 20.8%, and 16.2% for rods 809-812, respectively). BISON underpredicts the fission gas released in all cases; however, the results are mostly within a factor of 2, which is considered acceptable for fission-gas-release predictions due to the complexity and uncertainties associated with the processes.
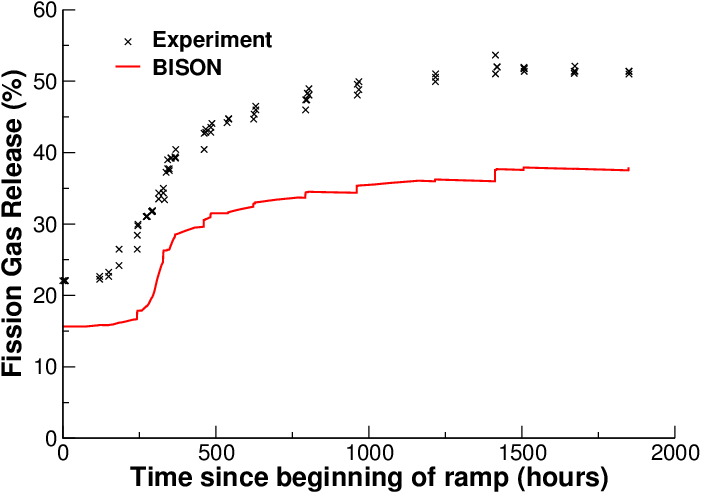
Figure 8: Fission gas release experimental comparison of IFA-535 rod 809 during the ramp test.
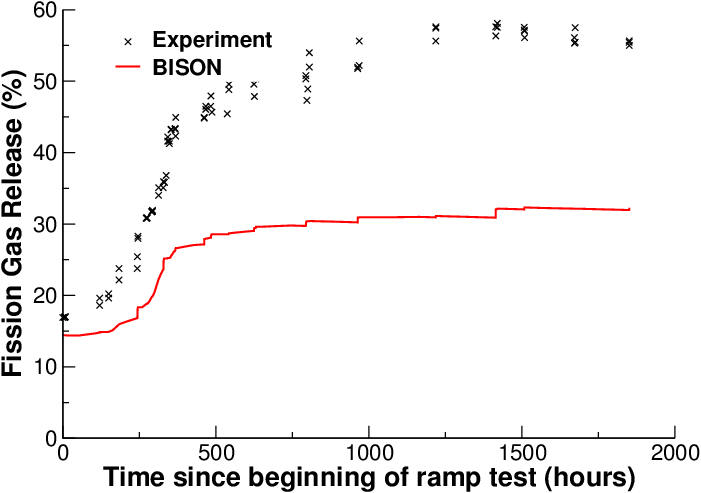
Figure 9: Fission gas release experimental comparison of IFA-535 rod 810 during the ramp test.
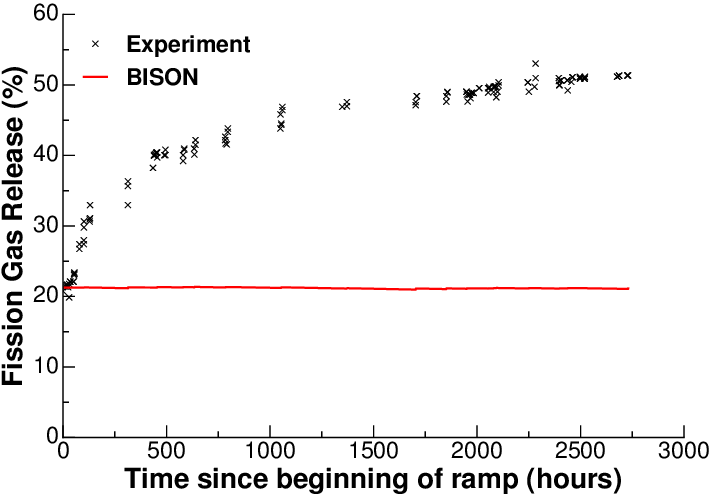
Figure 10: Fission gas release experimental comparison of IFA-535 rod 811 during the ramp test.
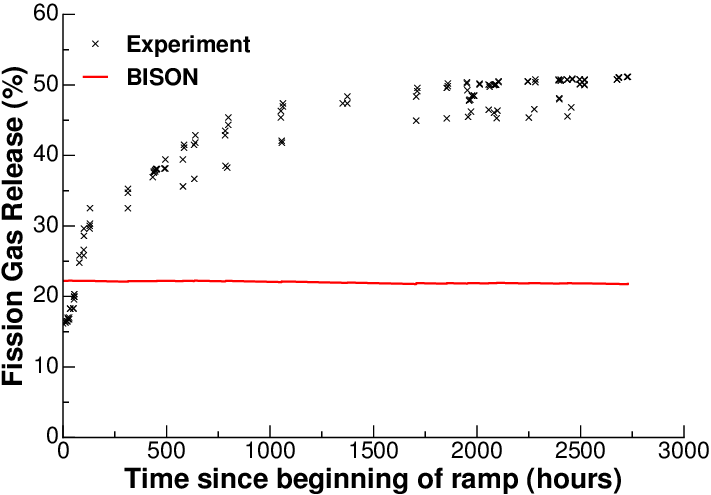
Figure 11: Fission gas release experimental comparison of IFA-535 rod 812 during the ramp test.
Discussion
There are some significant discrepancies in the experimental data provided by the FUMEX-III data files for the IFA-409 base irradiation history. Within the data, the average linear heat rate is tabulated alongside the linear heating rate at five axial locations. The axial peaking factors used within BISON are determined by dividing the values at the axial locations by their respective average on each time step. Therefore, the average of the axial peaking factors should be unity. If strictly using the FUMEX-III base data, this is not the case. In several places the average linear heating rate provided is less than the lowest value reported for the axial zones, which does not make sense. Therefore, to ensure the correct axial profile is applied to the fuel, the average linear heat rate is recalculated by taking the average of the five axial values provided in the data file.
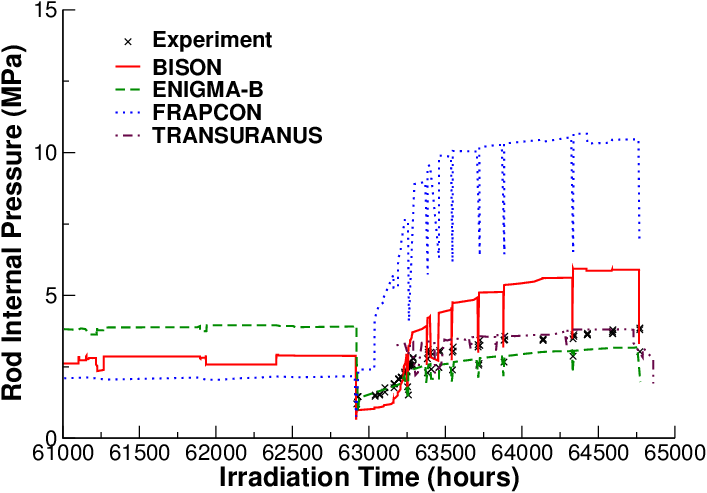
Figure 12: Rod internal pressure comparison of IFA-535 rod 809 during the ramp test.
Moreover, at certain locations in the data files, there are two lines given for a specific time. Usually one lists a delta-time (dt) value of zero and was, therefore, removed. In one case the second data point contains a negative value for power at the fifth axial location. Thus for this data point the axial peaking profile was made completely flat and the average linear heating rate set to zero to remove the unphysical negative power. The effect of this change in the base irradiation data on the final results is expected to be minimal.
The base irradiation given in the data files for rods 809, 810, 811, and 812 were significantly different although they were irradiated in the same IFA-409 rig. Therefore, the corresponding base irradiation provided in the data files for each case was used.
In addition to the experimental data provided in the FUMEX-III dataset, numerous well known codes also completed the simulation of rod 809. Figure 12 compares the rod internal pressure of BISON, TRANSURANUS, FRAPCON, and ENIGMA-B alongside the experimental results. BISON's predictions are within the range predicted by other codes.
References
- IAEA.
Improvement of Computer Codes Used for Fuel Behaviour Simulation (FUMEX-III): Report of a Coordinated Research Project 2008-2012.
Technical Report IAEA-TECDOC-1697, International Atomic Energy Agency, 2008-2012.[BibTeX]
- M. Limbäck and T. Andersson.
A model for analysis of the effect of final annealing on the in- and out-of-reactor creep behavior of zircaloy cladding.
In Zirconium in the Nuclear Industry: Eleventh International Symposium, ASTM STP 1295, 448–468. 1996.[BibTeX]
- Glyn Rossiter.
IAEA FUMEX-III Co-ordinated Research Programme: NNL Final Report.
Technical Report NNL (12) 12172, National Nuclear Laboratory, 2012.[BibTeX]