High Burnup Effects Programme (HBEP) A1/8-4, A3/6-4 and H8/36-4
Overview
The purpose of the High Burnup Effects Programme (HBEP) Task 3 was to provide high burnup effects evaluations, fission gas sampling, and parameter effects (HBEP, 2002). Rods A1/8-4, A3/6-4 and H8/36-4 were selected for the assessment of BISON code; they were irradiated to 48.5 MWd/kgU, 47.8 MWd/kgU and 46.6 MWd/kgU respectively, in the TVO-1 boiling water reactor (BWR) (HBEP, 2002).
Test Description
The three rods in this series, manufactured by ASEA, have similar design characteristics but slightly different pellet and cladding diameter. The fuel stack consisted of solid pellets with an active length of 3.68 meters. This portion of the HBEP experiments designated as Task 3 was to provide well-characterised data on the evaluation of high burnup effects on different fuel characteristics with an emphasis on fission gas release.
Table 1: HBEP Test Rod Specifications (A1/8-4, A3/6-4, and H8/36-4)
| Fuel Rod | Measurement | Unit |
|---|---|---|
| Fuel stack height | 3.68 | m |
| Nominal plenum height | ||
| A1/8-4 | 246 | mm |
| A3/6-4 | 246 | mm |
| H8/36-4 | 244 | mm |
| Number of pellets per rod | 337 | |
| Pellet Height | ||
| A1/8-4 | 10.9 | mm |
| A3/6-4 | 10.9 | mm |
| H8/36-4 | 10.9 | mm |
| Fill gas composition | He | |
| Fill gas pressure | .37 | MPa |
| Fuel | Measurement | Unit |
| Material | UO | |
| Enrichment | ||
| A1/8-4 | 2.33 | % |
| A3/6-4 | 3.08 | % |
| H8/36-4 | 1.36 | % |
| Density | 95.6 | % |
| Outer diameter | ||
| A1/8-4 | 9.939 | mm |
| A3/6-4 | 10.439 | mm |
| H8/36-4 | 9.939 | mm |
| Grain diameter | ||
| All Rods | 6.6 | m |
| Fuel densification | ||
| All Rods | .43 | % |
| Roughness | ||
| All Rods | 1.1 | m |
| Cladding | Measurement | Unit |
| Material | Zr-2 | |
| Outer diameter | ||
| A1/8-4 | 11.73 | mm |
| A3/6-4 | 12.25 | mm |
| H8/36-4 | 11.73 | mm |
| Inner diameter | ||
| A1/8-4 | 10.14 | mm |
| A3/6-4 | 10.65 | mm |
| H8/36-4 | 10.14 | mm |
| Roughness | ||
| All Rods | .35 | m |
Operating Conditions and Irradiation History
Rods A1/8-4, A3/6-4 and H8/36-4 were irradiated in the TVO-1 commercial BWR Cycles 2 through 7 (HBEP, 2002). Reactor operating coditions were, coolant pressure of 7 MPa and coolant inlet temperature of 552 K (HBEP, 2002). Peak-in-life LHGR values occurred during the first and third operating cycles, with maximum rod-average LHGR values being approximately 18 to 27 KW/m. Rod-average burnups ranged from 44 to 50 MWd/kgM with rod-average FGR values ranging from 0.3 to 17.1%. Clad temperatures and local power histories were taken at 12 axial locations and obtained from the IFPE database. The plot below, Figure 1, shows the power histories for the A1/8-4, A3/6-4, and H8/36-4 rods.
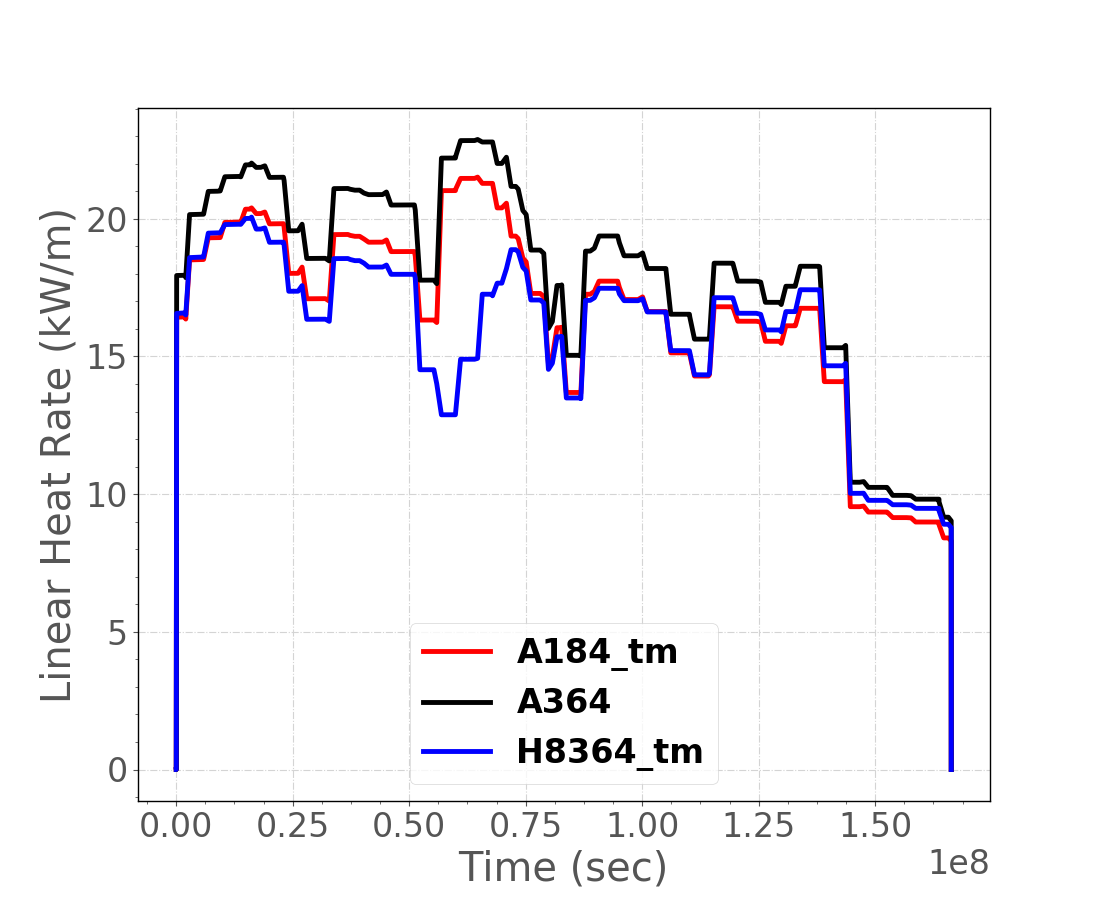
Figure 1: The linear heat rates for A1/8-4, A3/6-4 and H8/36-4.
Geometry and Mesh
All three fuel rods were meshed using 2-D axisymmetric models with eight-node quadratic elements. For simplicity, the pellet stack was modeled as a single continuous fuel column (smeared mesh). The meshes were generated using BISON's automatic mesh generator. The fuel pellets had 200 axial elements and 12 radial elements, and the cladding consisted of 200 axial elements and 4 radial elements.
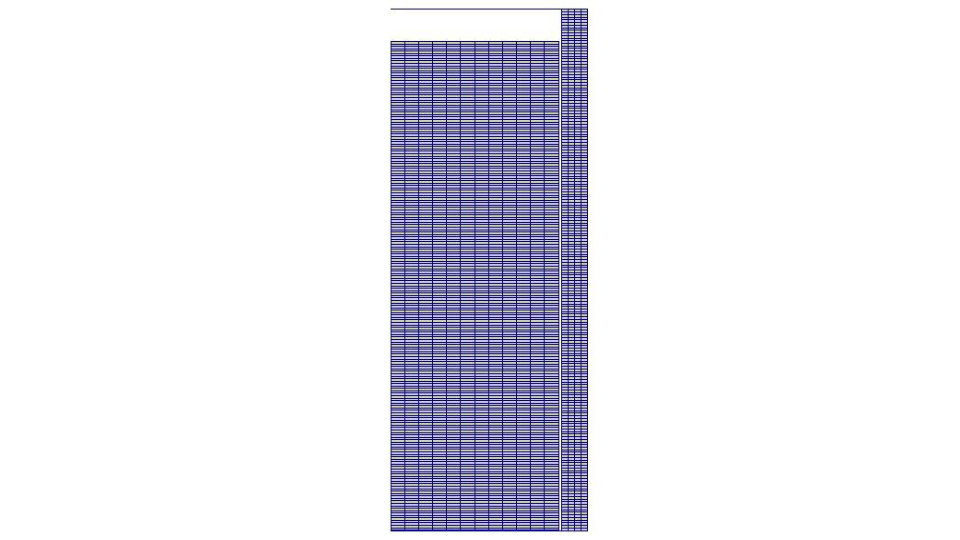
Figure 2: A BISON generated mesh showing the fuel and cladding mesh, axially minimized by 100 for visual purposes.
Material and Behavioral Models
The following material and behavioral models were used for the fuel:
UO2Thermal - NFIR: For temperature and burnup dependent thermal properties.
ComputeFiniteStrainElasticStress and UO2ElasticityTensor: elastic mechanical behavior
UO2VolumetricSwellingEigenstrain: volumetric expansion due to solid and gaseous swelling
UO2RelocationEigenstrain: relocation strains, relocation activation threshold power set to 5 kW/m
ComputeThermalExpansionEigenstrain:thermal expansion with a constant instanteous thermal expansion coefficient
UO2Sifgrs: fission gas release model used with the gaseous swelling model
UO2VolumetricSwellingEigenstrain
For the clad material, a constant thermal conductivity of 16 W/m-K was used and both thermal (primary and secondary) and irradiation creep were considered using the Limback creep model (Limbäck and Andersson, 1996). The following material and thermal behavior models were used for the cladding:
HeatConductionMaterial: Thermophysical material properties
ZryCreepLimbackHoppeUpdate and ZryElasticityTensor: mechanical creep and elastic deformation behavior for Zircaloy-2
ZryIrradiationGrowthEigenstrain: ESCORE model for volumetric swelling due to irradiation exposure
ZryThermalExpansionMATPROEigenstrain: thermal expansion of Zircaloy with the MATPRO model
ZryOxidation: Model for oxidation of Zircaloy
Details and references for all of these models listed above can be found on the linked BISON documentation pages.
Input files
The BISON input and all supporting files (power histories, axial power profile) are provided with the code distribution at bison/assessment/LWR/validation/HBEP/analysis.
Results
HBEP rods A1/8-4, A3/6-4, and H8/36-4 were designed and built to utilize well-characterized data on the effects of fuel temperature, burnup, power history, and different fuel characteristics with an emphasis on FGR. To achieve this the rods were built to the exact specification as described in the report. These rods were irradiated in the TVO-1 reactor for 6 cycles, and were then taken to a hot cell for fission gas characterization and diametral measurements.
Figure 3 and Figure 4 compare BISON calculations for both fission gas release and cladding diametral changes following irradiation. BISON's fission gas calculations slightly over predict for two of the cases and dramatically under predict for the H8/36-4 case. Cladding diametal comparisons vary from 12-55 microns.
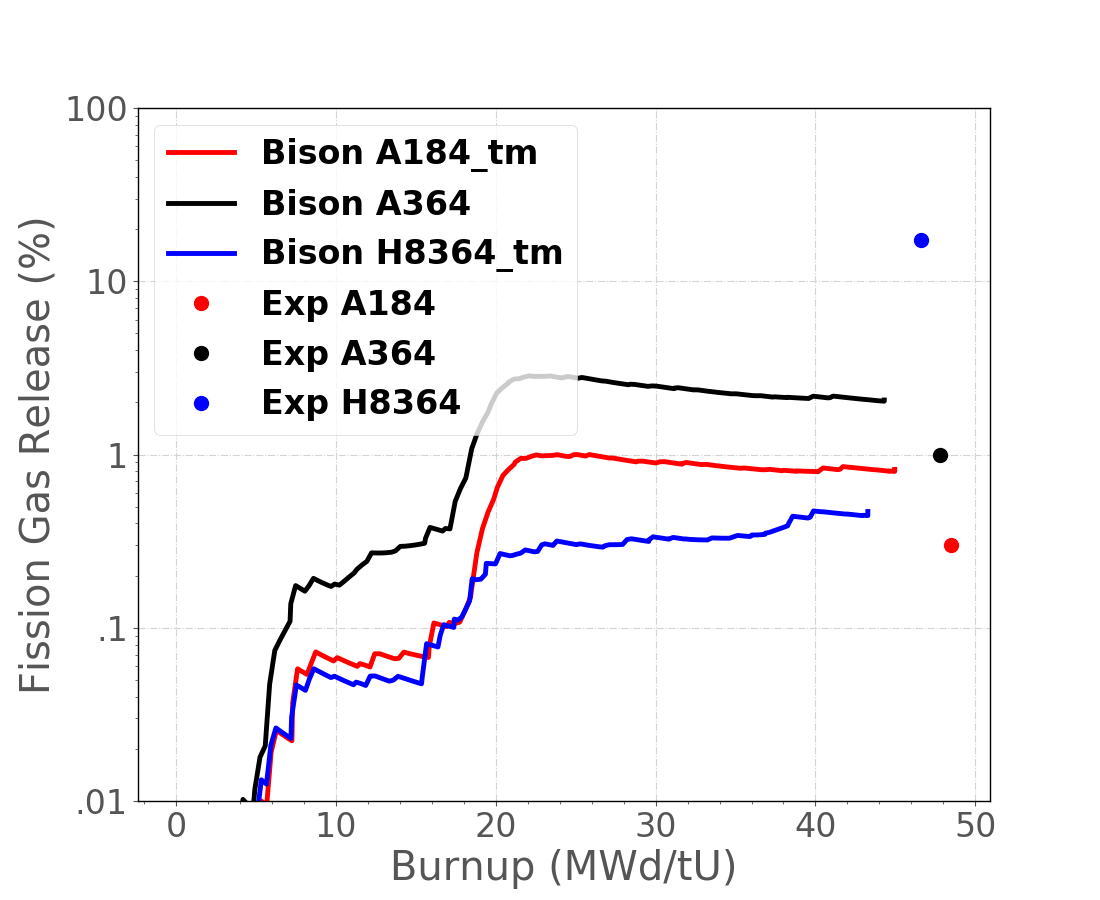
Figure 3: Comparison of measured fission gas release and the BISON calculations
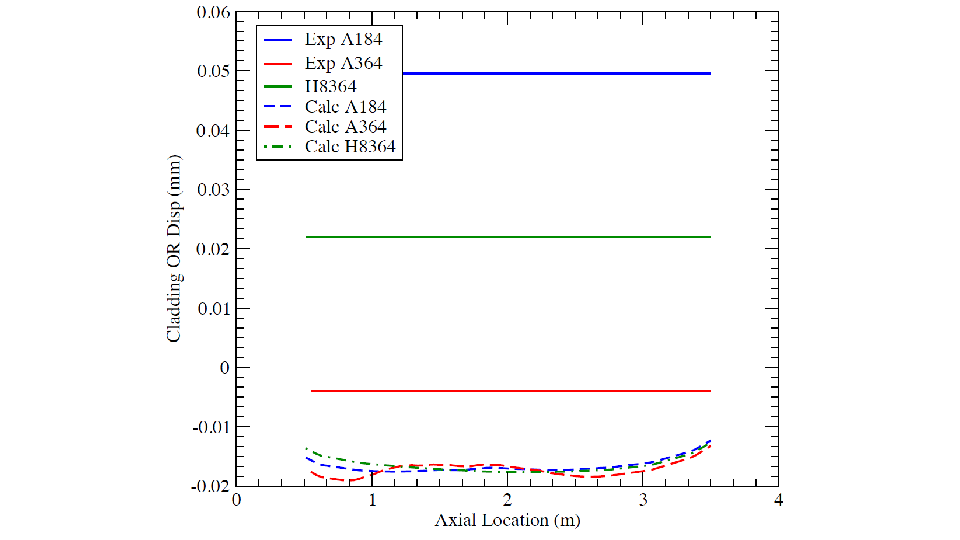
Figure 4: Comparison of measured cladding displacements and the BISON calculation; measured diameterchange was averaged over the region 500 to3500 mm above the bottom of the fuel rod
Table 2 makes comparisons between BISON and measured fission gas, plenum pressure, clad elongation, free gas volume, and burnup. Table 3 and Table 4 compare BISON pellet-cladding gap calculations to the corisponding axilly measured pellet-clad gap values. Furthermore, Table 4 compares pellet OD's between experimental measurements and BISON calculations to better determine the differences between Table 3 pellet-clad gap comparisons.
Table 2: BISON Comparisons to Experimental Results
| A1/8-4 | Experiment | BISON | Units |
|---|---|---|---|
| Fission Gas Release | .3 | 0.54 | % |
| Plenum Pressure | .48 | .7 | MPa |
| Clad Elongation | 3.966 | 3.942 | m |
| Free Gas Volume | 27.9 | 21.1 | cm |
| Burnup | 48.5 | 45.2 | MWd/kgU |
| A3/6-4 | Experiment | BISON | Units |
| Fission Gas Release | 1 | 1.68 | % |
| Plenum Pressure | .64 | .92 | MPa |
| Clad Elongation | 3.967 | 3.942 | m |
| Free Gas Volume | 28.5 | 22.8 | cm |
| Burnup | 47.8 | 44.5 | MWd/kgU |
| H8/36-4 | Experiment | BISON | Units |
| Fission Gas Release | 17.3 | .27 | % |
| Plenum Pressure | 2.86 | .630 | MPa |
| Clad Elongation | 3.964 | 3.938 | m |
| Free Gas Volume | 29.2 | 21.64 | cm |
| Burnup | 46.6 | 43.2 | MWd/kgU |
Table 3: BISON Comparisons to Gap Experimental Measurements
| H8/36-4 | ||
|---|---|---|
| Axial Location (cm) | Avg Exp Gap (microns) | BISON (microns) |
| 220.5 | 24 | 14.3 |
| 170 | 20 | 19.2 |
| 48.2 | 48 | 46.2 |
| 23 | 48 | 55.3 |
| A3/6-4 | ||
| Axial Location (cm) | Avg. Exp Gap (microns) | BISON (microns) |
| 157 | 25 | 13 |
Table 4: BISON Comparisons Pellet OD to Experimental Measurements
| H8/36-4 | |||
|---|---|---|---|
| Axial Location (cm) | Exp (mm) | Exp (mm) | BISON (mm) |
| 220.5 | 10.067 | 10.116 | 10.058 |
| 170 | 10.105 | 10.121 | 10.049 |
| 48.2 | 10.014 | 10.066 | 10.002 |
| 23 | 10.068 | 10.07 | 9.988 |
| A3/6-4 | |||
| Axial Location (cm) | Exp (mm) | Exp (mm) | BISON (mm) |
| 157.5 | 10.536 | 10.554 | 10.577 |
Figure 5 shows the strong axial power dependence at times corresponding to axial control blade movements.
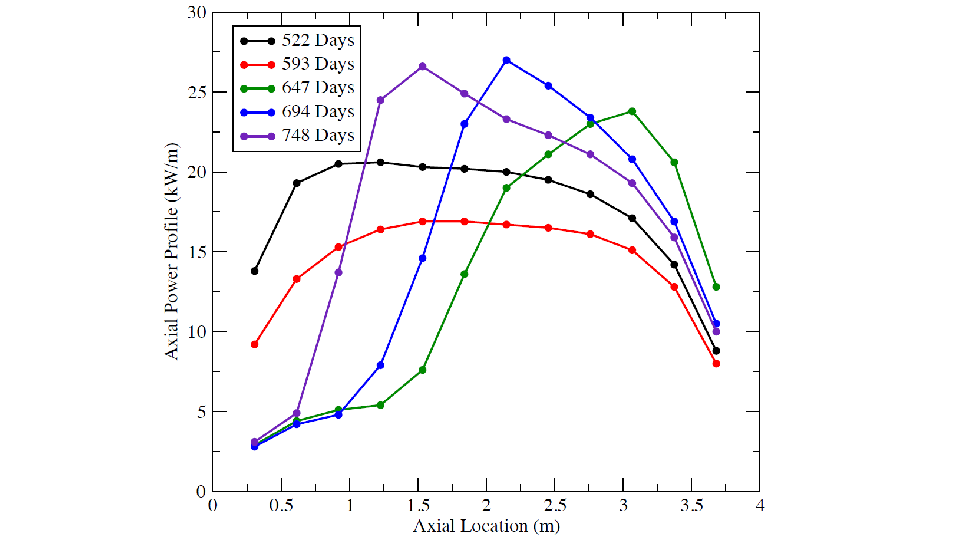
Figure 5: Axial Power Profile for H8/36-4 at selected times during the control blade insertion
Discussion
Modeling these three rods was useful to the BISON development to validate the capability of modeling high burnup fuel rods. The HBEP report (HBEP, 2002) stated, fission gas release was related to the rod location to the control blades. Rods closer to the control blades had significantly higher fission gas release than rods further away. Figure 5 shows, there is significant power changes caused by the blade movement, which could result in high fission gas release. BISON code appears to under calculate FGR under such conditions. Rods A1/8-4 and A3/6-4 were not located near a control blade.
During the PIE the cladding diameter was measured, and this value is the average value from 500-3500 mm. Furthermore, the cladding diameter does include the oxide thickness in the measurement. BISON's calculations are with in .07 to .02 mm of the measured value. There is no oxidation model in BISON to model the oxide growth of BWR fuel cladding, and this could also have implication on the calculations.
BISON calculated a lower free gas volume for all cases, and calulated a higher plenum pressure for A1/8-4, and A3/6-4 and a lower plenum pressure for H8/36-4. The difference between the calculated and measurement data on plenum pressure could be contributed to the difference in fission gas release. As for cladding elongation, BISON calculation is lower on all accounts. BISON currently does not consider the plenum spring or friction between the fuel and cladding. Both areg driving mechanisms for cladding elongation.
References
- HBEP.
Summary of the High Burn-up Effects Programme as abstracted from the Programme Final Report.
Technical Report, High Burn-up Effects Programme, December 2002.[BibTeX]
- M. Limbäck and T. Andersson.
A model for analysis of the effect of final annealing on the in- and out-of-reactor creep behavior of zircaloy cladding.
In Zirconium in the Nuclear Industry: Eleventh International Symposium, ASTM STP 1295, 448–468. 1996.[BibTeX]