IAEA CRP-6
Material presented here is a subset of information in Hales et al. (2021) and Hales et al. (2013). See the JNM papers for more information.
CRP-6 Assessment Cases
As part of an International Atomic Energy Agency (IAEA) Coordinated Research Program (CRP-6) on High Temperature Gas Reactor (HTGR) reactor fuel technology, a set of benchmarking activities were developed to compare fuel performance codes under normal operation and operational transients (IAEA, 2012). Sixteen fuel performance benchmark cases were identified, ranging in complexity from a simple fuel kernel having a single elastic coating layer, to realistic TRISO-coated particles under a variety of irradiation conditions. In each case, the particle geometry, constitutive relations, material properties, and operating conditions were carefully prescribed to minimize differences between the various code predictions; details are given in IAEA (2012). BISON has been applied to these 16 benchmark cases, as summarized in Table 1.
Table 1: IAEA CRP-6 benchmark cases considered in the BISON coated-particle assessment exercise. HRB-22 is a Japanese experiment. HFR-K3 and HFR-P4 are German pebble and fuel element experiments, respectively. NPR-1 is a US experiment.
| Case | Geometry | Description |
|---|---|---|
| 1 | SiC layer | Elastic only |
| 2 | IPyC layer | Elastic only |
| 3 | IPyC/SiC | Elastic with no fluence |
| 4a | IPyC/SiC | Swelling and no creep |
| 4b | IPyC/SiC | Creep and no swelling |
| 4c | IPyC/SiC | Creep and swelling |
| 4d | IPyC/SiC | Creep- and fluence-dependent swelling |
| 5 | TRISO | 350 m kernel, real conditions |
| 6 | TRISO | 500 m kernel, real conditions |
| 7 | TRISO | Same as 6 with high BAF PyC |
| 8 | TRISO | Same as 6 with cyclic temperature |
| 9 | HRB-22 | 4.79% FIMA, 2.110 n/m fluence |
| 10 | HFR-K3 | 10% FIMA, 5.310 n/m fluence |
| 11 | HFR-P4 | 14% FIMA, 7.210 n/m fluence |
| 12 | NPR-1 | 79% FIMA, 3.810 n/m fluence |
| 13 | HFR-EU1 | 20% FIMA, 5.410 n/m fluence |
Original results (Hales et al., 2013) were computed using a two-dimensional mesh with either six or eight quadratic axisymmetric finite elements across the width of each coating layer. A typical two-dimensional mesh with eight elements per layer is shown in Figure 1. Note that, in addition to the axisymmetry condition, a symmetry plane is also assumed along the top of the two-dimensional mesh. For Cases 1 and 2, numerical solutions were also obtained with twelve elements across the coating layer to determine whether the mesh was sufficiently refined. Maximum tangential stresses obtained from the refined mesh models differed at most by 0.1%, demonstrating adequate mesh convergence with the coarser meshes. More recently (Hales et al. (2021)), the models for all benchmark cases used one-dimensional meshes with quadratic elements. Since all of the cases are spherically symmetric, the same results can be obtained using either one-dimensional or two-dimensional elements.
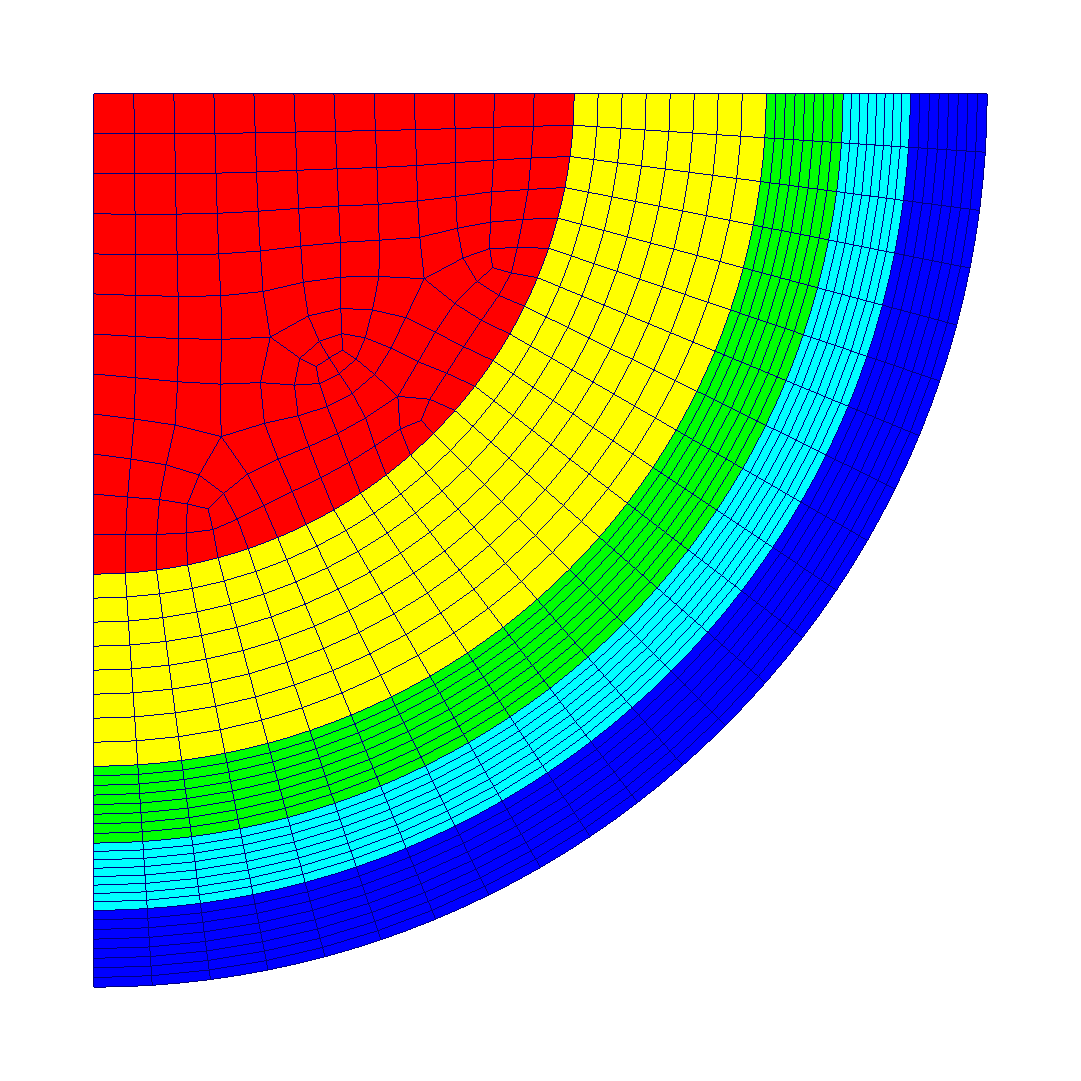
Figure 1: Typical computational mesh used for the IAEA CRP-6 benchmark cases.
The BISON input and all supporting files (mesh, mesh scripts, etc.) for the TRISO fuel performance benchmark cases are provided with the code at bison/assessment/TRISO/IAEA_CRP-6/fuel_performance. For users who wish to run these benchmarks, additional explanation is required. Because the IAEA CRP cases involved comparison of results from a large number and variety of codes, the particle geometry, boundary conditions and material models were prescribed for each case in detail. This was done principally to avoid differences in material models, which can be substantial between the various codes. In some cases these prescribed models differed from the standard BISON TRISO material models.
Fuel Performance Results
Cases 1 to 3 were limited to single and double coating layers and tested simple elastic thermomechanical behavior against analytical solutions. A comparison of the analytical and BISON numerical solutions for the maximum tangential stress, which occurs at the inner surface of the various layers, is shown in Table 2
Table 2: Comparison of the BISON computed maximum tangential stress (MPa) to the analytical solution for Cases 1 to 3.
| Case | Layer | Analytical (MPa) | BISON (MPa) | Error (%) |
|---|---|---|---|---|
| 1 | SiC | 125.190 | 125.13 | 0.048 |
| 2 | IPyC | 50.200 | 50.176 | 0.048 |
| 3 | IPyC/SiC | 8.8/104.4 | 8.7/104.5 | 1.14/0.10 |
Cases 4a to 4d included both IPyC and SiC layers and investigated npyrolytic carbon layer behavior under a variety of conditions. Cases 5 to 8 considered a single TRISO particle with more complexity added with each subsequent case. For Cases 1 to 4d, the internal gas pressure was fixed at 25 MPa while Cases 5 to 8 included a linear pressure ramp. The particle temperature was held uniform at 1273 K for Cases 1 to 7, but for Case 8 was cycled ten times between 873 and 1273 K, characteristic of fuel in a pebble bed reactor. For Cases 4 to 7, Table 3 compares BISON computed solutions to the range of solutions from eight coated-particle fuel codes included in the CRP-6 exercise IAEA (2012). Comparisons are of the tangential stress at the inner surface of both the IPyC and SiC layers, at the end of irradiation. The BISON solutions are always within the range of values computed by the other codes. Note that tabulated values defining the ranges were extracted from plots in IAEA (2012) and are thus not precise.
Table 3: Comparison of the BISON computed tangential stress (MPa) to the range of values computed by the codes included in the CRP-6 exercise. Comparisons are at the inner surface of each layer and at the end of irradiation.
| Case | Layer | CRP-6 codes range (MPa) | BISON (MPa) |
|---|---|---|---|
| 4a | IPyC/SiC | [925, 970]/[-775, -850] | 925/-816 |
| 4b | IPyC/SiC | [-25, -25]/[138, 142] | -25.0/139 |
| 4c | IPyC/SiC | [25, 27]/[83, 92] | 25.8/89.1 |
| 4d | IPyC/SiC | [25, 35]/[71, 88] | 30.3/84.5 |
| 5 | IPyC/SiC | [40, 58]/[-56, -28] | 44.2/-32.1 |
| 6 | IPyC/SiC | [27, 38]/[28, 48] | 31.4/41.9 |
| 7 | IPyC/SiC | [37, 50]/[10, 25] | 42.5/21.7 |
Although code comparisons in Table 3 are provided only at the end of irradiation, comparisons were made at various intermediate times during the irradiation period. The BISON solutions were always within the range of solutions produced by the CRP-6 codes.
Figure 2 compares solutions for Case 8, which involved a cyclic particle temperature, during the full irradiation history. In this figure, BISON solutions of the tangential stress at the inner wall of the IPyC and SiC layers are compared to solutions from three codes from the CRP-6 exercise, namely PARFUME Miller et al. (2009), ATLAS Phelip et al. (2004) and STRESS3 Martin (2002). As above, data for the code comparisons were extracted from plots in IAEA (2012). For the IPyC layer, the four solutions essentially overlay each other during the entire irradiation period. In the SiC layer, the four solutions are quite similar but some differences are evident, particularly for the first four temperature cycles. The BISON solution falls roughly midway between the PARFUME and STRESS3 solutions and is essentially identical to the ATLAS solution.
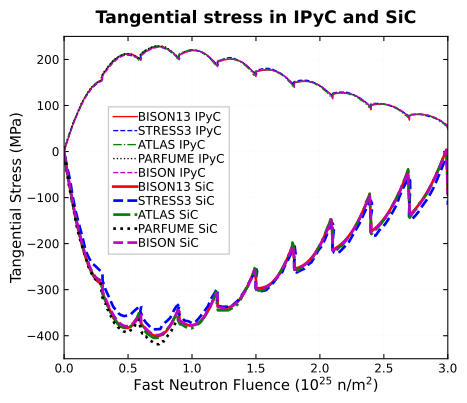
Figure 2: Code comparison for Case 8, which included a ten cycle temperature history. Plotted is the tangential stress at the inner wall of the IPyC and SiC layers.
Cases 9 to 13 in CRP-6 were more complicated benchmarks based on past or planned experiments with TRISO-coated particles. Again, details are provided in IAEA (2012). Although material properties and constitutive relations were prescribed for these cases, they differed from Cases 1 to 8 in two ways: (1) the internal pressure was not fixed but instead determined by fission gas release and CO production and (2) the particle size was prescribed as a population (mean value and standard deviation) rather than a single value. BISON solutions were based on the gas release and CO production models described above; however, for simplicity, only a single particle size was considered based on the mean particle diameter.
Figure 3 provides code comparisons of the total gas pressure (a) and tangential stress at the inner wall of the SiC layer (b) for benchmark Case 9. BISON results are compared to those from three other codes. BISON results are comparable to other results given the differences in models for fission gas.
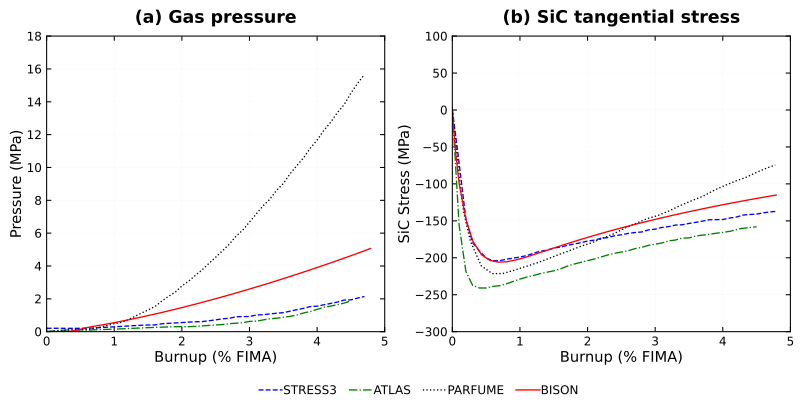
Figure 3: Code comparisons of (a) total gas pressure at the inner wall of SiC layer and (b) the tangential stress at the inner wall of SiC layer for benchmark Case 9.
Figure 4 provides code comparisons of the total gas pressure (a) and tangential stress at the inner wall of the SiC layer (b) for benchmark Cases 10 and 11. Again, BISON is compared to three codes from the CRP-6 exercise. Substantial differences exist in these solutions, particularly for the gas pressure. The BISON solution histories, however, compare well to the range of solutions given by the three well-established codes chosen for comparison.
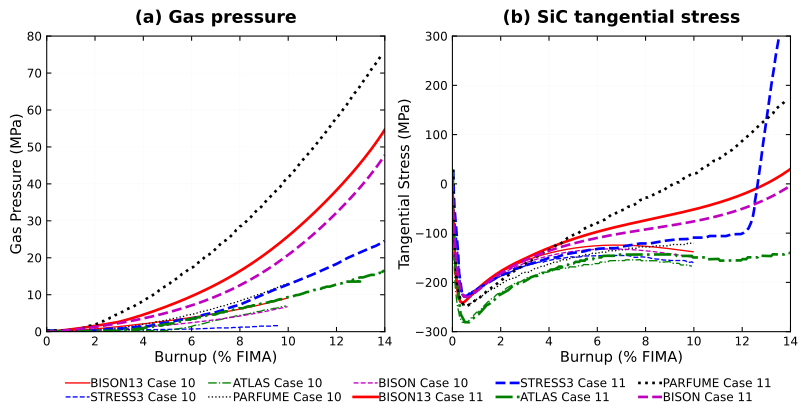
Figure 4: Code comparisons of (a) total gas pressure at the inner wall of SiC layer and (b) the tangential stress at the inner wall of SiC layer for benchmark Cases 10 and 11.
Figure 5 and Figure 6 show results for Cases 12 and 13, respectively.
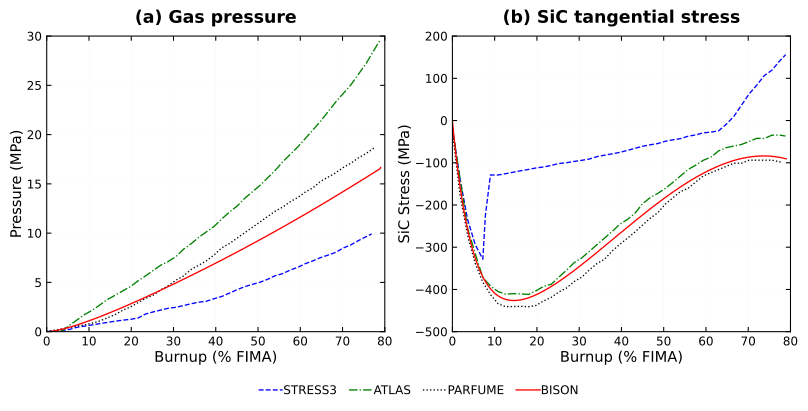
Figure 5: Code comparisons of (a) total gas pressure at the inner wall of SiC layer and (b) the tangential stress at the inner wall of SiC layer for benchmark Case 12.
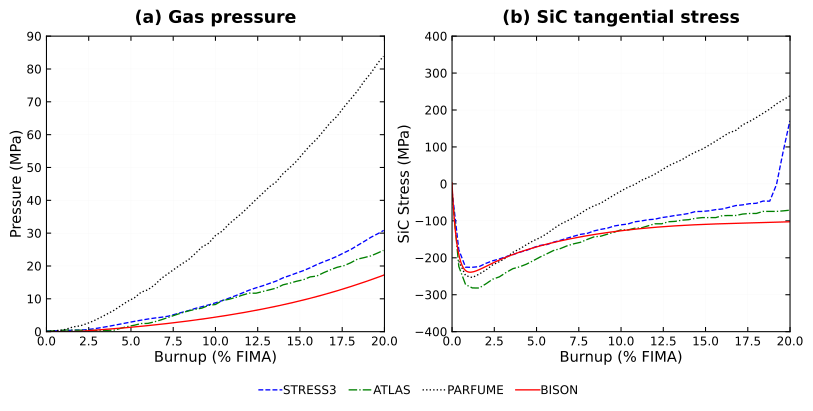
Figure 6: Code comparisons of (a) total gas pressure at the inner wall of SiC layer and (b) the tangential stress at the inner wall of SiC layer for benchmark Case 13.
As stated in IAEA (2012), the differences between various code predictions shown in Figure 3, Figure 4, Figure 5, and Figure 6 can be largely attributed to the models used to calculate fission gas release and CO production in the kernel. A detailed description of these models is not available in IAEA (2012), limiting more detailed investigation. One obvious and significant difference is that both BISON and ATLAS employ the simple Proksch et al. Proksch et al. (1982) empirical model for CO production while PARFUME Miller et al. (2009) uses a detailed thermochemical model.
Diffusion Results
A second set of benchmark Cases in CRP-6 focused on diffusion of fission products, with Cases 1-5 based on standard diffusion conditions and Cases 6-11 based on accident scenarios. Case 1 involves a bare kernel. Case 2 has a kernel and buffer and inner pyrolytic carbon layers. Case 3 has all five typical TRISO components. Cases 1-3 involve diffusion of pre-existing materials. Case 4 reaches 1800 and simulates a cracked silicon carbide layer. Case 5 includes 10 temperature cycles. Results for these cases are in Table 4.
Table 4: Comparison of BISON results for fractional release to those from CRP-6 codes for diffusion Cases 1-5.
| Case | CRP-6 codes range | BISON |
|---|---|---|
| 1a | [0.453, 0.498] | 0.466 |
| 1b | [0.970, 1.000] | 1.000 |
| 2a | [0.006, 0.030] | 0.027 |
| 2b | [0.968, 0.996] | 0.995 |
| 3a | [6.5910, 1.1310] | 1.3310 |
| 3b | [0.203, 0.218] | 0.210 |
| 3c | [0.220, 0.239] | 0.225 |
| 3d | [0.999, 1.000] | 1.000 |
| 3e (Cs) | [0.970, 1.000] | 1.000 |
| 3e (gases) | [0.980, 1.000] | 1.000 |
| 4a (Cs) | [1.6410, 1.4710] | 2.4410 |
| 4b (Cs) | [0.20, 0.23] | 0.20 |
| 4c (Cs) | [0.21, 0.24] | 0.23 |
| 4d (Cs) | [1.00, 1.00] | 1.00 |
| 4a (Ag) | [0.27, 0.55] | 0.38 |
| 4b (Ag) | [0.58, 0.95] | 0.78 |
| 4c (Ag) | [0.92, 0.98] | 0.90 |
| 4d (Ag) | [0.98, 1.00] | 1.00 |
| 5a (Cs) | [2.1910, 1.9210] | 2.4510 |
| 5b (Cs) | [3.0710, 1.2210] | 1.4910 |
| 5a (Ag) | [5.5510, 5.0610] | 6.5110 |
| 5b (Ag) | [0.14, 0.54] | 0.40 |
Cases 6-11 focus on accident scenarios. They involve a base irradiation period followed by a high temperature period. Release fractions are computed for the high temperature period. Results from these cases show a sometimes significant difference in predictions between codes. Where experimental data is available, code predictions from all participants can show a large discrepancy. This is highlighted in Figure 7. (For plots of the other cases, see Hales et al. (2021).) This demonstrates the need for a better understanding of all the mechanisms associated with effective diffusion coefficients and for improved or specialized coefficients.
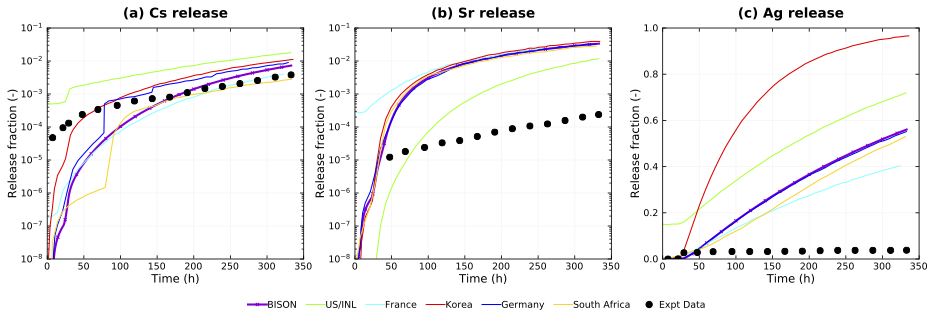
Figure 7: Code comparisons of fractional release of cesium, strontium, and silver release for Case 6b. BISON results are similar to those of other codes. There is a large discrepancy between experimental values and code predictions for strontium and silver.
Summary
Since the IAEA CRP cases involved comparison of results from a large number and variety of codes, the particle geometry, boundary conditions and material models were prescribed in detail for many cases. In other cases, material models were left to the discretion of the code teams. For both fuel performance and diffusion cases, BISON results compare well with results from other codes. As the cases became more complex, differences between codes became larger. Differences between code predictions and experimental results were also obvious in some cases.
References
- J.D. Hales, R.L. Williamson, S.R. Novascone, D.M. Perez, B.W. Spencer, and G. Pastore.
Multidimensional multiphysics simulation of TRISO particle fuel.
Journal of Nuclear Materials, 443(1):531–543, 2013.
doi:10.1016/j.jnucmat.2013.07.070.[BibTeX]
- Jason D. Hales, Wen Jiang, Aysenur Toptan, and Kyle A. Gamble.
Modeling fission product diffusion in TRISO fuel particles with BISON.
Journal of Nuclear Materials, 548:152840, 2021.
doi:10.1016/j.jnucmat.2021.152840.[BibTeX]
- IAEA.
Advances in high temperature gas cooled reactor fuel technology.
Technical Report IAEA-TECDOC-1674, International Atomic Energy Agency, 2012.[BibTeX]
- D. G. Martin.
Considerations pertaining to the achievement of high burn-ups in htr fuel.
Nuclear Engineering and Design, 213:241–258, 2002.[BibTeX]
- G. K. Miller, D. A. Petti, J. T. Maki, and D. L. Knudsen.
PARFUME theory and model basis report.
Technical Report INL/EXT-08-14497, Idaho National Laboratory, 2009.[BibTeX]
- M. Phelip, F. Michel, M. Pelletier, G. Degeneve, and P. Guillermier.
The ATLAS HTR fuel simulation code objectives, description and first results.
In 2nd International Topical Meeting on High Temperature Reactor Technology, 1–10. Beijing, China, September 2004.[BibTeX]
- E. Proksch, A. Strigl, and H Nabielek.
Production of carbon monoxide during burn-up of $\mathrm UO_2$ kerneled HTR fuel particles.
Journal of Nuclear Material, 107:280–285, 1982.[BibTeX]