Gap Conductance
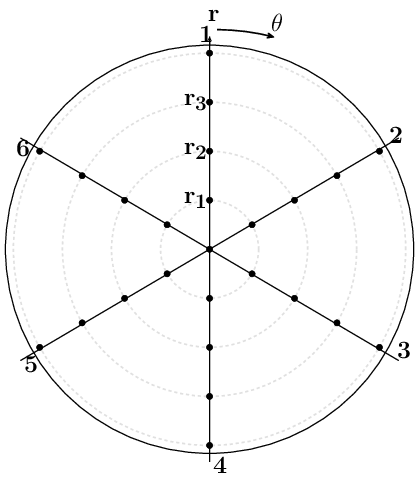
Figure 1: Configuration of the measurement points, regenerated from Garnier and Begej (Garnier and Begej, 1979). Upper plate and bottom plate faces only at those 19 points. Therefore, the data are measured at 19 points including the center point.
Overview
Garnier & Begej performed ex-reactor experiments for determination of thermal gap and contact conductance between depleted uranium dioxide (UO) and Zircaloy-4 (Zr) interfaces. The data include measurements at low gas pressure in 1979 (Garnier and Begej, 1979) and at high gas pressure in 1980 (Garnier and Begej, 1980) using two measurement techniques;
The Modified Pulse Design (MPD), a transient measurement technique.
The Modified Longitudinal Design (MLD), a steady state measurement technique.
Test Description
Separate effects validation tests cases are generated using experiments of Garnier & Begej. The experiments were performed with MPD and MLD measurement techniques. A heat pulse (i.e., laser) was employed with a signal detector to monitor the thermal energy transmitted through sample pairs that were either physically separated or in contact for the MPD experiments. Meanwhile, a constant heat flux was applied in the MLD experiments. Brief information of the experimental data is summarized in Table 1. More information related to the experiments can be found in Ref. (Garnier and Begej, 1979) (Garnier and Begej, 1980).
Table 1: Summary of the experimental data used in this study.
| Source | (Garnier and Begej, 1979) | (Garnier and Begej, 1980) |
|---|---|---|
| Description | low gas pressure | high gas pressure |
| Technique | MPD, MLD | MPD |
| Sample pairs | UO:Zr | UO:Zr |
| AlO:Zr | - | |
| Metallography | optical height gage | optical height gage |
| Data points | 188 (MPD) | 422 (MPD) |
| 74 (MLD) | - | |
| Gas composition | He, Ar, | He, Ar, |
| He:Ar, He:Xe | He:Ar, He:Xe | |
| Gas pressure, (MPa) | 0.0 - 0.172 | 0.102 - 7.11 |
| Contact pressure, (N/m) | 0.0 - 14.48 | 0.0 - 1300 |
| Gas temperature, (K) | 293 - 873 | 283 - 673 |
| Gap width, (m) | 2.7 - 135.0 | 5.9 - 21.3 |
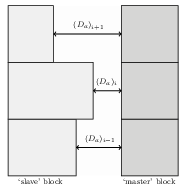
Figure 2: Illustration of the geometry (not to scale). denotes the -th local distance between the sample pairs, and is varied = including all measurement points.
Experiments were performed between two parallel plates with varying local distances between the sample pairs and surface characteristics. An optical height gauge was used in the experiments to determine the average mean-plane of separation between the pairs.
Figure 1 shows the measurement points on each configuration. Measurements are performed at 19 coordinates including the center point.
This benchmark only includes the MLD data that includes temperature difference information, which is required to estimate correct boundary conditions for BISON simulations. The benchmark will be extended to MPD data in the near future.
Model Description
Geometry and Mesh
Figure 2 shows illustration of the problem setup in BISON. For simplicity, circular plate geometry in the experiments was simplified into columnar geometry considering 1-D heat transfer within gap between the plates. The geometry was meshed using quadratic elements.
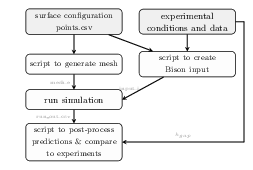
Figure 3: Scheme of automated benchmark. Darker gray boxes represent the gold files for surface configurations (local gap distances) and experimental conditions/data. The gold files are in .csv format.
Material and Behavioral Models
The following material and behavioral models were used for the sample pairs:
Material properties were calculated through pre-processing script from the measured properties in the experiments.
Displacements were used to calculate plenum pressure.
Boundary and Operating Conditions
This benchmark only included the MLD benchmark that had temperature difference information to estimate correct boundary conditions in BISON simulations. The boundary conditions were calculated from the experiments through reported gas temperature () and temperature difference across the gap () since
And, the boundary conditions at the far left and the far right were estimated by adding to the gap surrounding temperatures since the planar thermal resistance is .
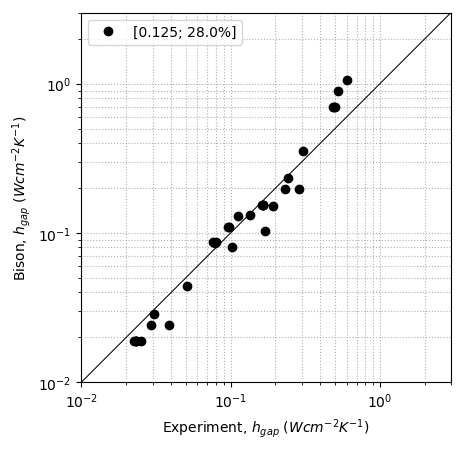
Figure 4: Gap conductance comparison of the BISON predictions against the MLD experimental data.
Automation
The BISON input and all supporting files are provided with the code distribution at bison/assessment/gapHTC_sets/analysis.
Results & Discussion
The results are summarized in terms of the root-mean-square error (RMSE) and relative RMSE (rRMSE) to quantify the total and relative distance between the BISON predictions and experiments as:
(1)
(2)
where denotes the quantity of interest.
Figure 4 shows comparison of the BISON predictions and MLD experimental data (Garnier and Begej, 1979). Metrics to quantify the results are summarized on the following plot.
Acknowledgments
This research is supported by and performed in conjunction with the Consortium for Advanced Simulation of Light Water Reactors, an Energy Innovation Hub for Modeling and Simulation of Nuclear Reactors under U.S. Department of Energy Contract No. DE-AC05-00OR22725.
References
- J. E. Garnier and S. Begej.
Ex-Reactor Determination of Thermal Gap and Contact Conductance Between Uranium Dioxide: Zircaloy-4 Interfaces - Stage I: Low Gas Pressure.
Technical Report NUREG/CR-0330; PNNL-2696; R3, Pacific Northwest Laboratory, April 1979.[BibTeX]
- J. E. Garnier and S. Begej.
Ex-Reactor Determination of Thermal Gap Conductance Between Uranium Dioxide and Zircaloy-4 - Stage II: High Gas Pressure.
Technical Report NUREG/CR-0330; PNL-3232; Vol. 2, Pacific Northwest Laboratory, 1980.[BibTeX]