Griffin-BISON Multiphysics 15 Ȼ Reactivity Insertion Test
This document outlines the approaches to model the 15Ȼ reactivity insertion test conducted in the KRUSTY project. The model is developed based on the steady-state KRUSTY multiphysics model.
Overview
Three reactivity insertion tests were conducted in the KRUSTY warm critical experiments (Poston et al., 2020). The 15 Ȼ test is the simplest and serves as the foundation for the subsequent two transient tests, which involve the insertion of 30 Ȼ and 60 Ȼ, respectively. This VTB model will concentrate on detailing the work related to the 15 Ȼ run only.
In all three reactivity insertion tests, KRUSTY began at a very low power level and at room temperatures. The fission heat generated in the UMo fuel region increased as the radial reflector of KRUSTY was lifted upwards, covering larger portion of the fuel disk. During the warm critical experiments, heat pipes were not in operation, and all heat was passively removed through the reactor’s external boundary. With very effective thermal insulation, the fuel region heated up and thermally expanded, creating negative reactivity feedback to reduce the power. For 15 Ȼ run, the peak power measured was approximately 3.75 kW, and the excess reactivity inserted to the core was estimated to be about 15.7 Ȼ (Poston et al., 2020). This estimate was based on measured reactor period at the earlier stages, before the reactivity feedbacks began to take effect. The fuel temperatures during the transient were recorded by several thermal couples. However, due to the limitations with bounding thermal couples to the fuel disk, the recorded temperature all rise slower compared to the neutron detectors monitoring the fission power. As a result, in this VTB model, only the recorded fission power history (normalized detector readings) was used for evaluating the VTB multiphysics model developed.
Griffin-BISON Multiphysics Model
The multiphysics model to simulate the 15 Ȼ run is very similar to the one in the previous VTB model for steady state calculations. Specifically, it employs a two-level MOOSE MultiApps hierarchy that tightly couples the Griffin neutronics model with the BISON thermo-mechanical model to simulate the transient. The DFEM-SN(2,3) solver with CMFD acceleration in Griffin was used to solve for fission power, and anisotropic scattering was modeled with NA=3. The calculated nuclear heat was transferred to BISON, where it was used to solve for core temperatures and displacement fields resulting from thermal expansions. These temperature and displacement fields were then transferred back to Griffin to update its cross sections and, consequently, the fission power. The coupling of Griffin and BISON was achieved through Picard iterations. To save on computational time and resources, only ¼ of the KRUSTY core was modeled.
In the 15 Ȼ run experiment, although a small adjustment to the radial reflector position was made after the initial shift to achieve a faster power increase, a total reactivity insertion of 14.5 Ȼ at the start of the transient was simulated by moving the radial reflector upward by 1.48 mm within 0.5 seconds. This insertion is slightly smaller than the 15.7 Ȼ specified in the literature. However, according to the ICSBEP benchmark handbook (Smith and others, 2019), the effective beta was not directly measured in the experiment, and a calculated value of 0.0066 was used. The experimental value 15.7 Ȼ was derived from the point kinetics equations by measuring the reactor periods at the early stages of the reactivity insertion test, before the core warmed up and before the reactivity feedback effects took effect. In the KRUSTY VTB model, the effective beta calculated from the simplified Monte Carlo reference model is 0.0069. Thus, using the effective beta from the ICSBEP benchmark, the reactivity insertion from lifting the reflector by 1.48 mm would be greater, approximately 15.2 Ȼ. The reflector position was not further refined in the multiphysics modeling due to the known existing uncertainties in the nuclear data library and the lack of actual experimental data on the actual reflector location. The comparison of the calculated power increase rate with experimental data showed excellent agreement, indicating no further adjustment of the reflector locations were necessary for the simulations.
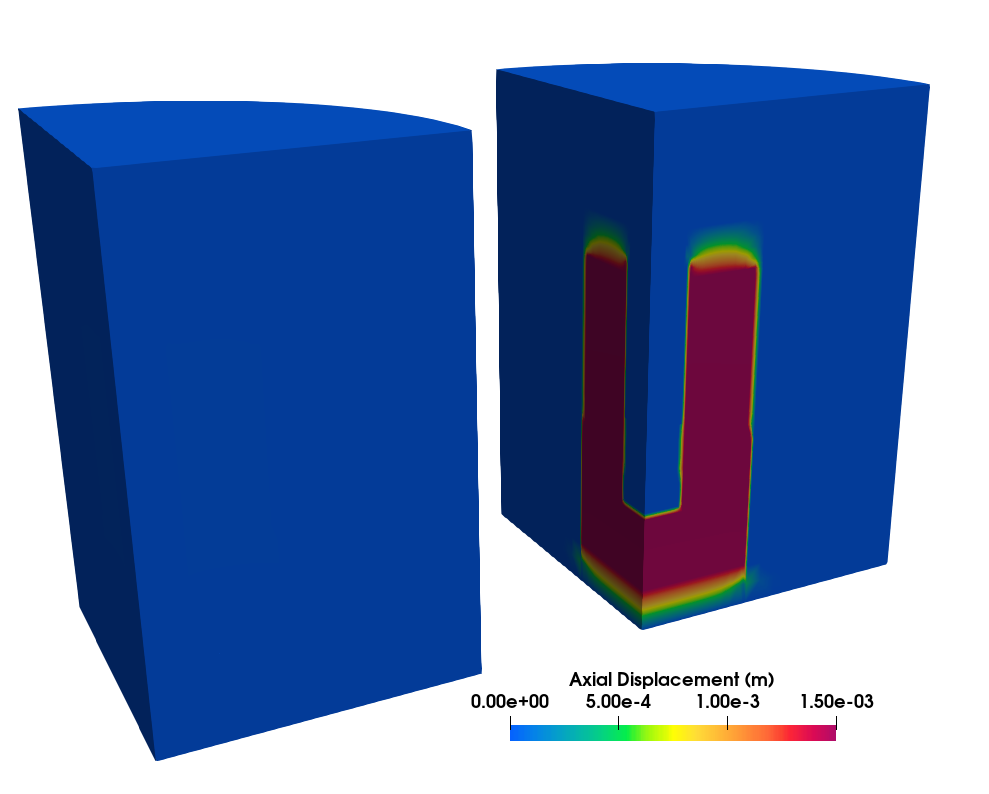
Figure 1: Displacement field caused by lifting the radial reflector to insert the 15 Ȼ reactivity
The upward movement of the radial reflector was modeled in BISON by applying a Dirichlet boundary condition to the bottom surface of the solid assembly. BISON calculated the displacement field by solving the solid mechanics equations. Figure 1 presents the calculated displacement field which is identical to Figure 2 in previous VTB results. To make more efficient use of computer resources (by enabling more cores to be utilized per node), the KRUSTY mesh has been pre-split into chunks and was distributed for parallel computation.
Transient Simulation
Griffin served as the main application for performing transient simulation, loading the steady state, controlling the data transfer between Griffin and the BISON sub-application, and setting time steps and convergence criteria for the Picard iteration. Listing 1, Listing 2, and Listing 3 illustrate the key blocks that differ from those of steady state KRUSTY model in the Griffin main application input file.
Listing 1: The input blocks for Griffin main application to load the steady state
[UserObjects]
  [ss]
    type = TransportSolutionVectorFile
    transport_system = sn
    writing = false
    execute_on = initial
  []
[]Listing 2: The input blocks for Griffin main application to initiate transient calculation
[TransportSystems]
  particle = neutron
  equation_type = transient
  G = 22
  VacuumBoundary = '9527 9528 9529'
  ReflectingBoundary = '1982 1983'

  [sn]
    scheme = DFEM-SN
    family = MONOMIAL
    order = FIRST
    AQtype = Gauss-Chebyshev
    NPolar = 2
    NAzmthl = 3

    NA = 3
    sweep_type = asynchronous_parallel_sweeper
    using_array_variable = true
    collapse_scattering = true
    n_delay_groups = 6

    use_displaced_mesh = true
  []
[]Listing 3: The input blocks for Griffin main application to execute the transient simulation
[Executioner]
  type = TransientSweepUpdate
  verbose = true

  richardson_abs_tol = 1e-6
  richardson_rel_tol = 1e-15

  richardson_max_its = 30
  inner_solve_type = GMRes
  max_inner_its = 100

  cmfd_acceleration = true
  coarse_element_id = coarse_element_id
  max_diffusion_coefficient = 10.0
  diffusion_prec_type = lu
  prolongation_type = multiplicative

  end_time = 7200
  dtmin = ${min_dt}
  dtmax = 10

  [TimeStepper]
    type = IterationAdaptiveDT
    dt = 1e-2
    timestep_limiting_postprocessor = power_limited_dt
  []
[]On the other hand, a time dependent Function is used along with FunctionDirichletBC to apply the upward movement of the radial reflector in the BISON child application input file, as shown in Listing 4 and Listing 5.
Listing 4: The input blocks for BISON child application to define the time dependent upward movement of the radial reflector
[Functions]
  [ref_mov]
    type = ParsedFunction
    symbol_names = 't0 d0'
    symbol_values = '0.5 ${reflector_disp}'
    # Linear insertion within the first 0.5 seconds
    expression = 'if(t<0,0.0,if(t<t0,d0/t0*t,d0))'
  []
[]Listing 5: The input blocks for BISON child application to define boundary conditions for the upward movement of the radial reflector
[BCs]
  [BottomSSFixZ]
    type = FunctionDirichletBC
    variable = disp_z
    boundary = 'ss_bot'
    function = ref_mov
  []
[]Simulation Results
Figure 2 compares the total power calculated by Griffin with the measured total power from neutron detectors. Overall, the agreement between the multiphysics simulation and experimental data is very good. At the beginning of the transient, the power increase rate matched the experimental data very closely, indicating that the initial reactivity insertion used in the simulation was appropriate. The multiphysics model also accurately predicted the time at which the power peaked. The calculated maximum fission power for a quarter of the core is 957.4 W, which is only about 2% higher than the experimental value of 937.5 W. This agreement suggests that the thermal model, coupled with the neutronics model, accurately represented the core thermal expansion. Given that the peak power was slightly overpredicted, the negative reactivity feedbacks of the system may have been slightly underestimated in the multiphysics model.
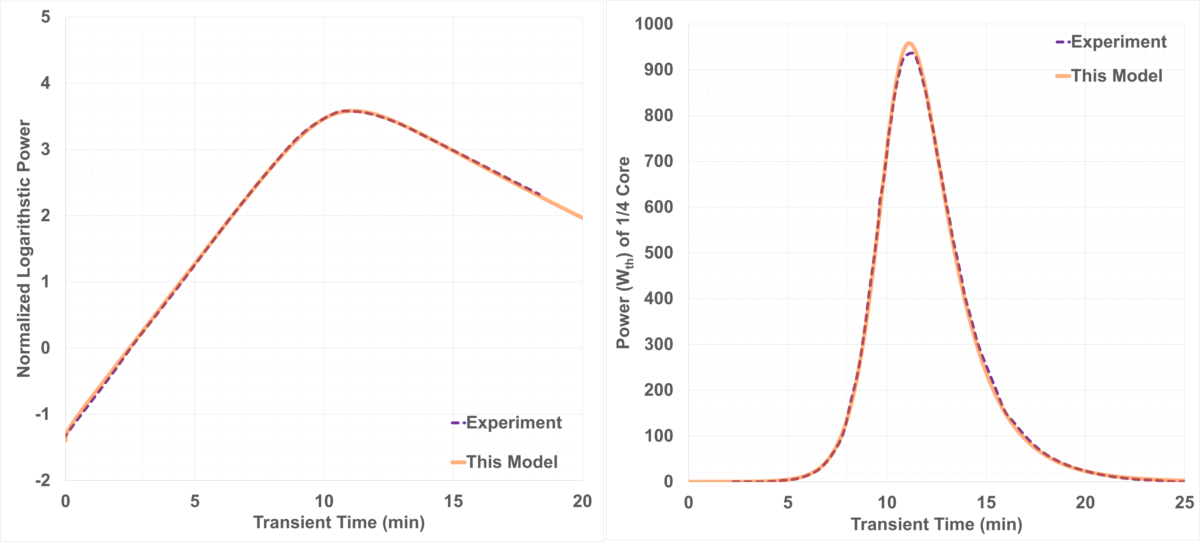
Figure 2: Predicted power evolution vs measurement (15 ₵ test)
References
- David I Poston, Marc A Gibson, Patrick R McClure, and Rene G Sanchez.
Results of the krusty warm critical experiments.
Nuclear Technology, 206(sup1):S78–S88, 2020.[BibTeX]
- KN Smith and others.
Krusty: beryllium-oxide and stainless-steel reflected cylinder of heu metal.
Technical Report, HEU-MET-FAST-101, 2019.[BibTeX]