Neutronic and Multiphysics Steady State Results
Griffin Neutronic Results
The execution line for running the Griffin neutronic model is similar to the line shown in Listing 1. In this demonstration case, Griffin was parallel to 640 CPUs on an HPC cluster. The first line in the Figure 1 is to load the correct MOOSE environment as well as the Griffin application for running the job.
Results from running the Griffin input are shown in Table 1 and Figure 1. The k-effs of the KRUSTY neutronic model are compared with the Serpent reference result when fuel temperature was at 300 K or at 800 K while the temperatures for other regions remained at 300 K. Table 1 shows that good agreements were obtained among the Griffin neutronic model and the Monte Carlo reference model. In addition, the fuel Doppler reactivity calculated by both models also agree reasonably well. For KRUSTY, the dominated reactivity feedback is from the core thermal expansion. The small discrepancies in the calculated reactivity feedback from fuel Doppler will not play significant contributions to the power transient.
The axial power densities within the fuel region were tallied with both the Griffin neutronic model and the Serpent reference model when fuel and structure temperatures were all at 300 K. Figure 1 demonstrated excellent agreements of the Griffin calculations to the reference results in most of the core region. Griffin slightly overestimated the power production in the outermost layer (“”); however, this layer is very thin and its thickness is only about 2.1 mm as described before.
Table 1: Comparison of the Griffin neutronic results with Monte Carlo reference result using the hybrid cross sections
| Serpent Reference | Griffin + hybrid XS | |||
|---|---|---|---|---|
| Tf = 300 K | Tf = 800 K | Tf = 300 K | Tf = 800 K | |
| 1.00592 | 1.00523 | 1.00815 | 1.00752 | |
| (pcm) (–) | -222.6 | -229.1 | ||
| (pcm) (–) | 69.0 | 62.0 |
Listing 1: Griffin execution command
module load use.moose moose-apps griffin
mpirun -n 640 griffin-opt -i krusty_ANL40_endf70_hybrid_SN35_NA3_coarse_CMFD_pd.i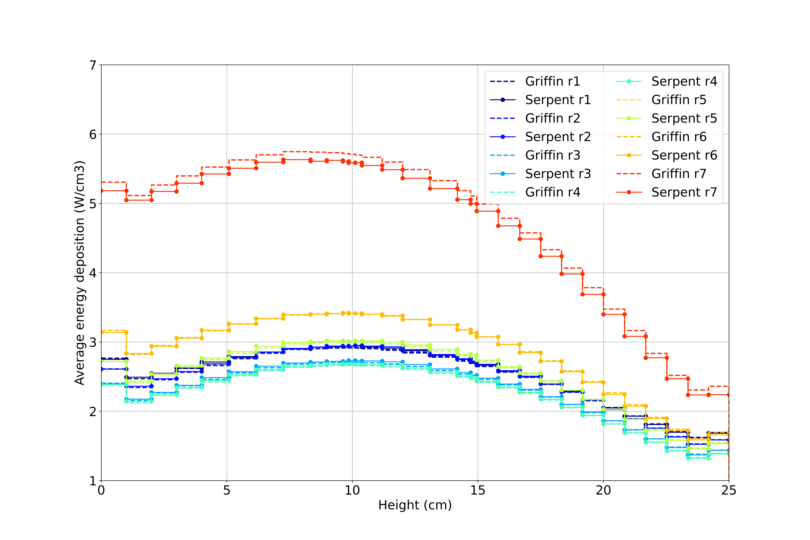
Figure 1: Calculated fission power deposition in the KRUSTY radial regions (: inner first ring of annulus, : outermost ring) using the Griffin model and Serpent generated cross section and compared with reference results (solid line: reference result, dash line: Griffin results)
Steady-State Multiphysics Simulation Result for the 15 ₵ Reactivity Insertion
Two sets of steady-state Multiphysics simulations are performed with the hybrid XS to estimate the height that the axial reflector is moved into the core to introduce 15₵ external reactivity. The displacement field that originates from axial reflector movement calculated by BISON is visualized in Figure 2. As shown in this figure, applying the 1.48 mm shift boundary condition to the bottom of the axial reflector assembly leads to a uniform shift of the structure as expected. The keff values before and after applying the axial reflector shift were calculated to be 1.007003 and 1.008008 using the Multiphysics coupled model. That leads to an increase of by ~100.5 pcm which is about 14.5 ₵ with Serpent calculated β-eff of 690 pcm. Figure 3 shows the axial power distribution within the fuel disk. The upward shift of the axial reflector also slightly moves the power peaking upward within KRUSTY fuel region.
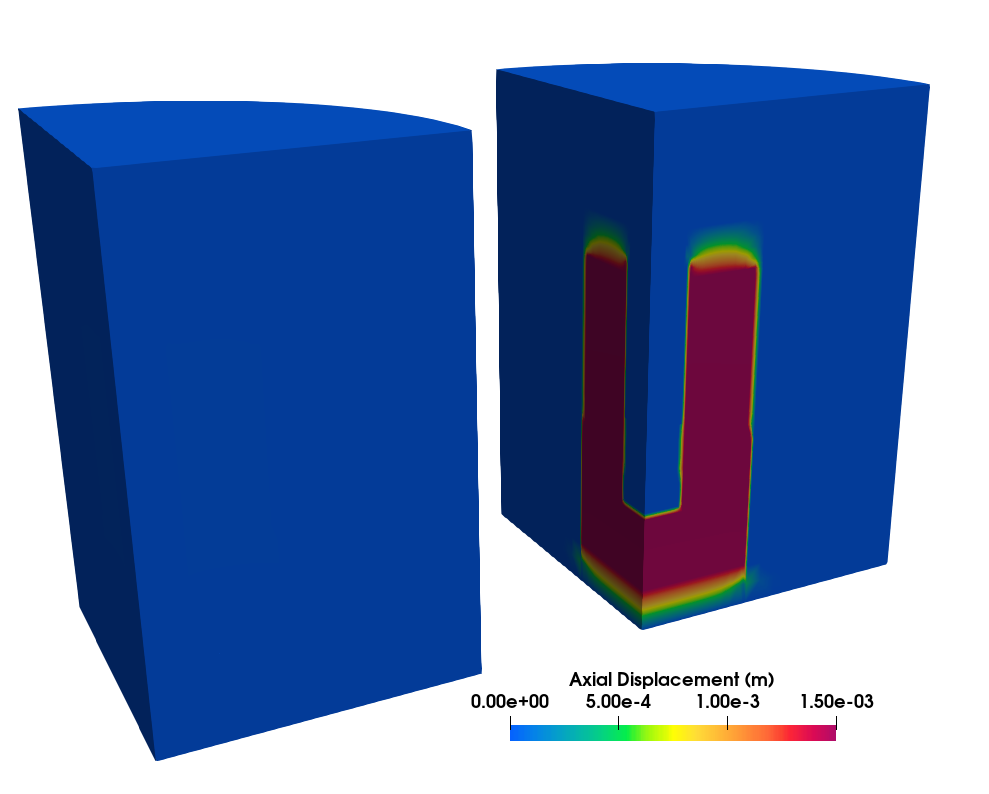
Figure 2: Displacement field caused by axial reflector movement to insert reactivity
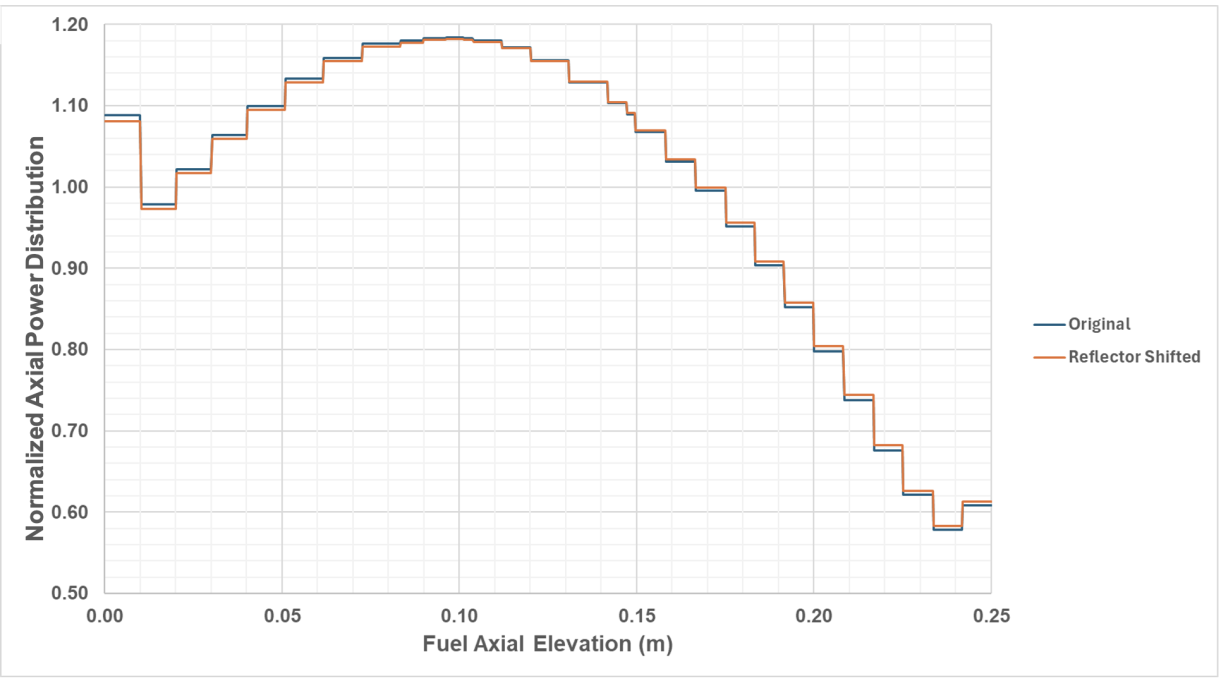
Figure 3: The change in power peaking factor before and after the reactivity insertion caused by axial reflector shifting