Example 8: Seismic risk assessment of a generic nuclear facility using the MASTODON FTA Python module
Model description
This example demonstrates the seismic risk assessment of a generic nuclear facility (GNF) located at the INL site and subject to the INL site seismic hazard. The risk analysis is performed using the MASTODON's FTA Python module that performs fault tree analysis and calculates the seismic risk.
.i filesThis example involves the usage of the MASTODON FTA Python module. This module is separate from the MASTODON finite-element analysis and resides in the mastodonutils package. The files for this package can be found in the mastodon/python/mastodonutils folder.
The generic nuclear facility (GNF) represents a safety-critical facility in the Department of Energy (DOE) complex. The GNF is assumed to host materials at risk (MAR) that need to be contained in the facility and is classified as a Seismic Design category 3 (SDC 3) structure per ASCE 43 (ASCE, 2005). The containment structure of GNF is assumed to be the primary containment and that the collapse of the structure will release the MAR into the atmosphere, resulting in radiation exposure of collocated workers and off-site receptors. Therefore, the seismic risk assessment of the GNF involves the calculation of the collapse risk of the GNF structure.
The inputs for seismic risk assessment of GNF include the seismic hazard at the INL site, the seismic collapse fragility of the GNF structure, and the event tree and fault tree for the structural collapse. For this example, the seismic hazard curve is adopted from the probabilistic seismic hazard analyses performed for the INL site. The seismic fragilities, event tree, and fault trees are gathered from those of similar facilities and are assumed to be representative of safety-critical DOE facilities.
Seismic hazard
The seismic risk assessment of GNF is performed for two seismic hazard curves, both corresponding to the INL site. The first hazard curve is calculated from the PSHA for the INL site performed in 2006, and the second hazard curve corresponds to an updated PSHA performed in 2015 Cox et al. (2016). The updated hazard curve is a result of using new data and models for characterizing the seismic sources and the ground motions at the target site, as described in Payne et al. (2017) and Payne et al. (2017). Figure 1 presents the original and updated seismic hazard curves and shows that the 2015 curve forecasts a smaller seismic hazard than the 2006 curve for most spectral accelerations.
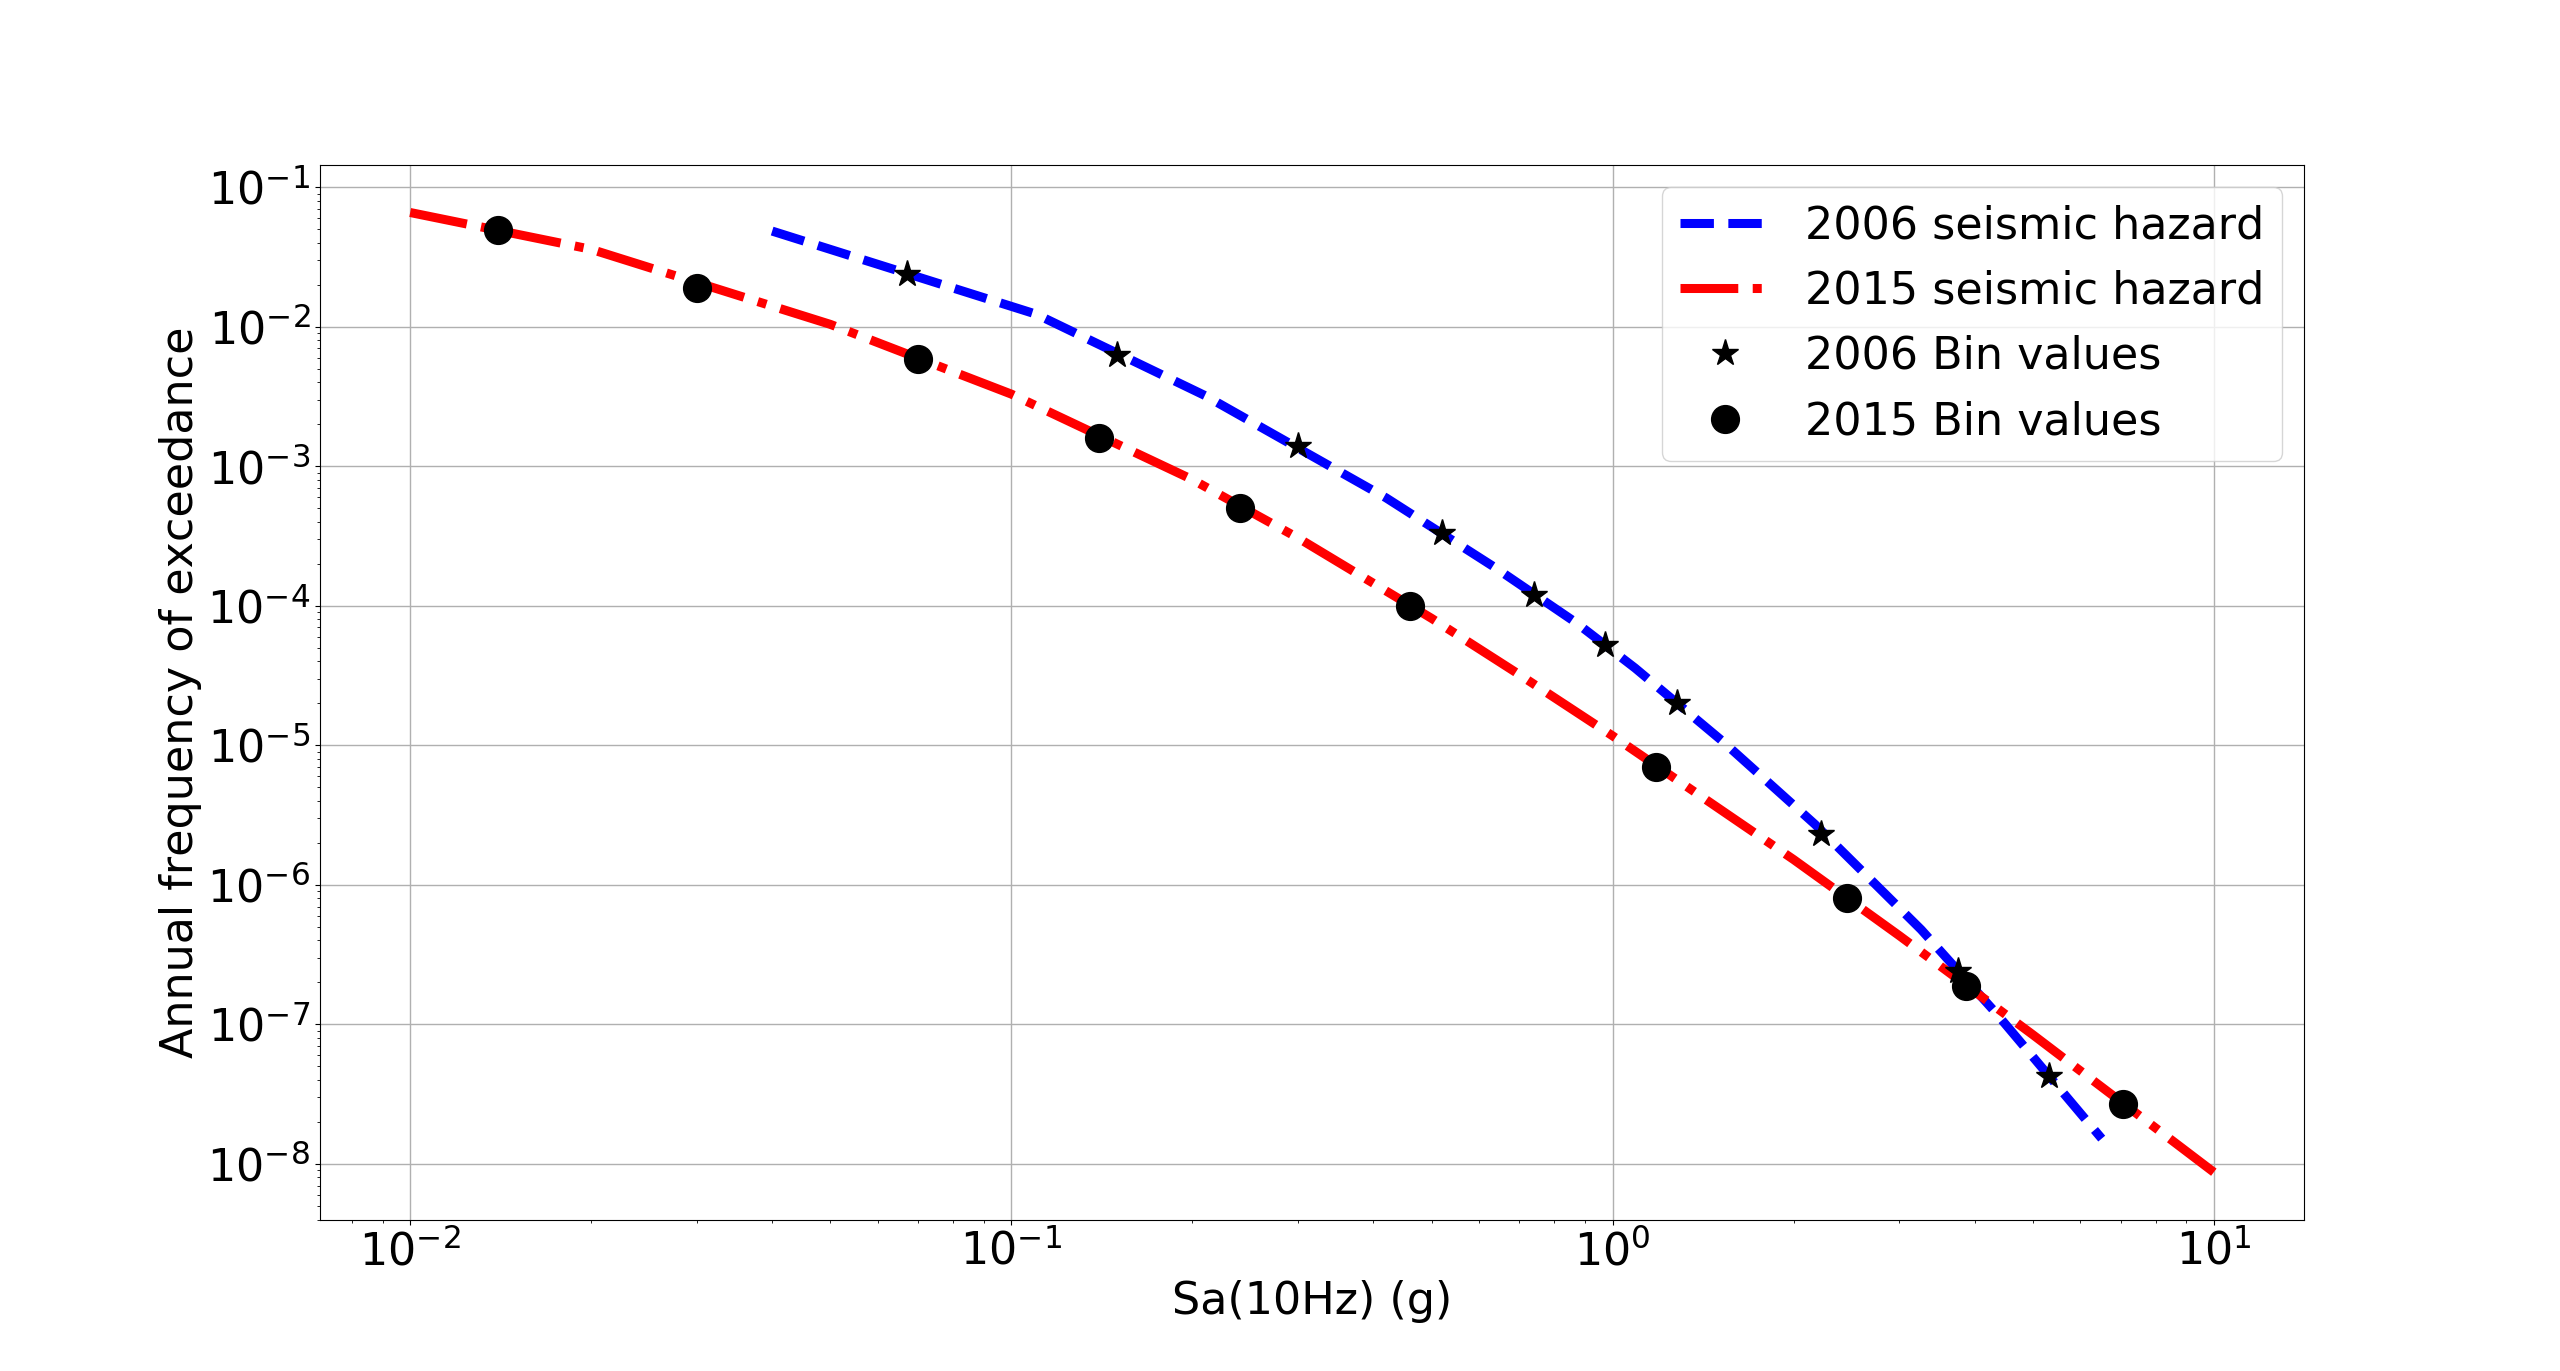
Figure 1: Seismic hazard curves and the corresponding bin values for the 2006 and the 2015 assessments.
Seismic fragility
Seismic fragility here refers to the probability of collapse of the GNF under seismic shaking. It is assumed that the spectral acceleration () at 10Hz is a representative seismic demand for the GNF and therefore, the seismic fragility (as well as the seismic hazard) is expressed in terms of at 10Hz. The fragility curve and its uncertainty are expressed using a double lognormal distribution described by the lognormal median (Am), and logarithmic standard deviations representing randomness and uncertainty, and , respectively. The median fragility function, which is the collapse probability conditioned on the input ground spectral acceleration at 10Hz, is used for the risk assessment in this example. This fragility is calculated as:
(1)
where, is the composite logarithmic standard deviation calculated as and is the standard normal cumulative distribution function.
Note that the seismic fragilities also were updated in 2015 and therefore the seismic fragilities for the 2006 assessment and the 2015 assessment are different. The structural collapse seismic fragility for the 2006 and 2015 hazard are listed in Table 1 below. These fragilities are also plotted in Figure 5 and Figure 6 below.
Table 1: Structural collapse fragilities for GNF.
| Year of assessment | ||||
|---|---|---|---|---|
| 2006 | 1.31 | 0.24 | 0.38 | 0.45 |
| 2015 | 2.11 | 0.29 | 0.41 | 0.50 |
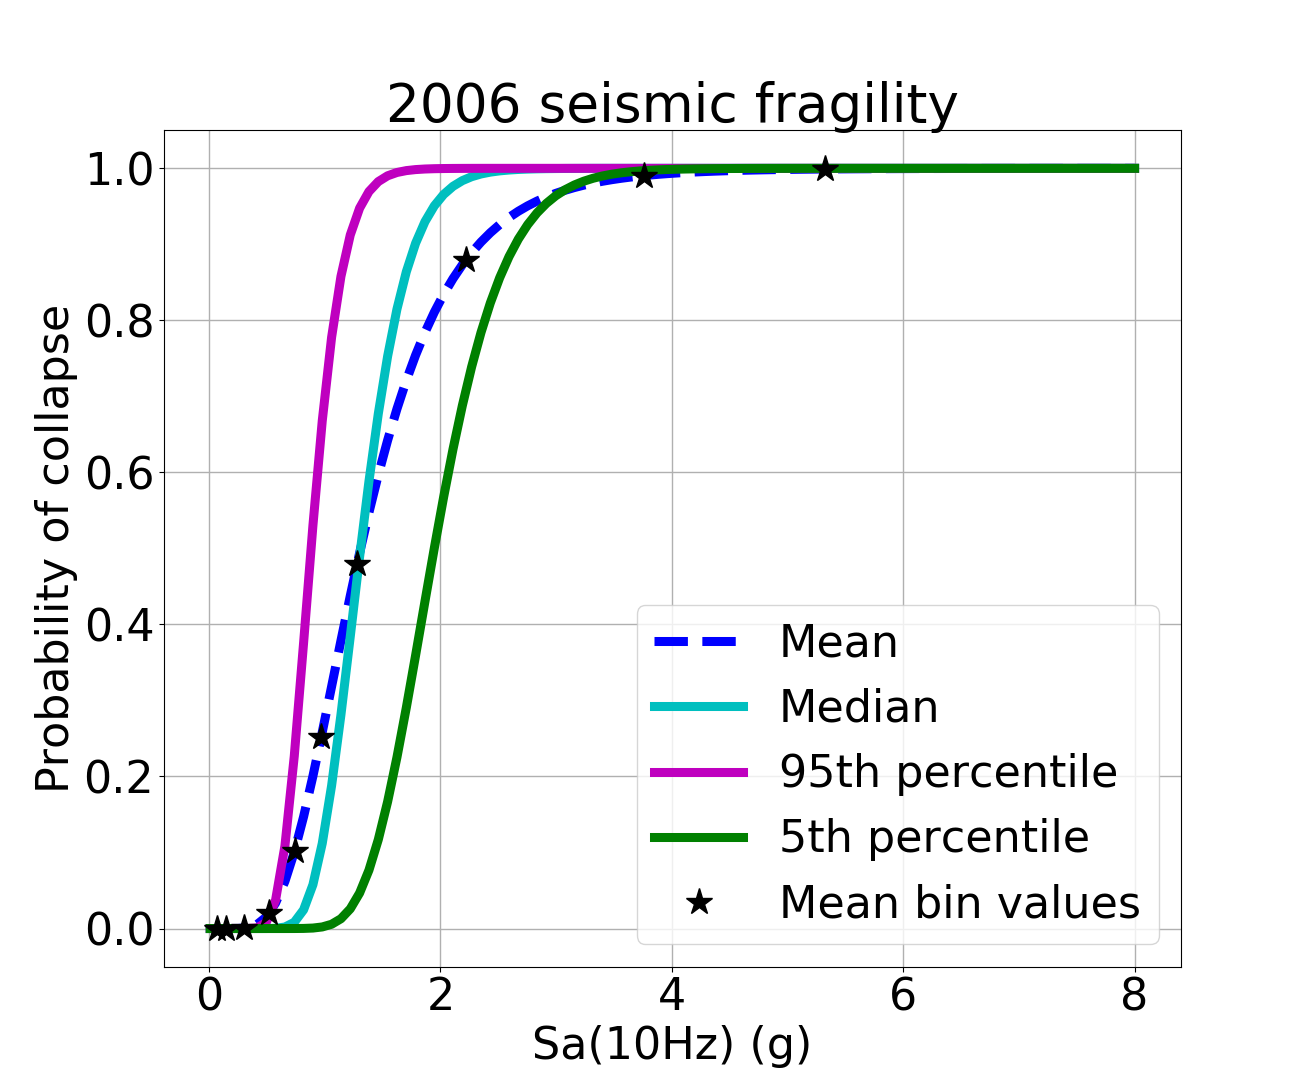
Figure 5: Mean, median, 5th, and 95th percentile fragility functions for the 2006 assessment.
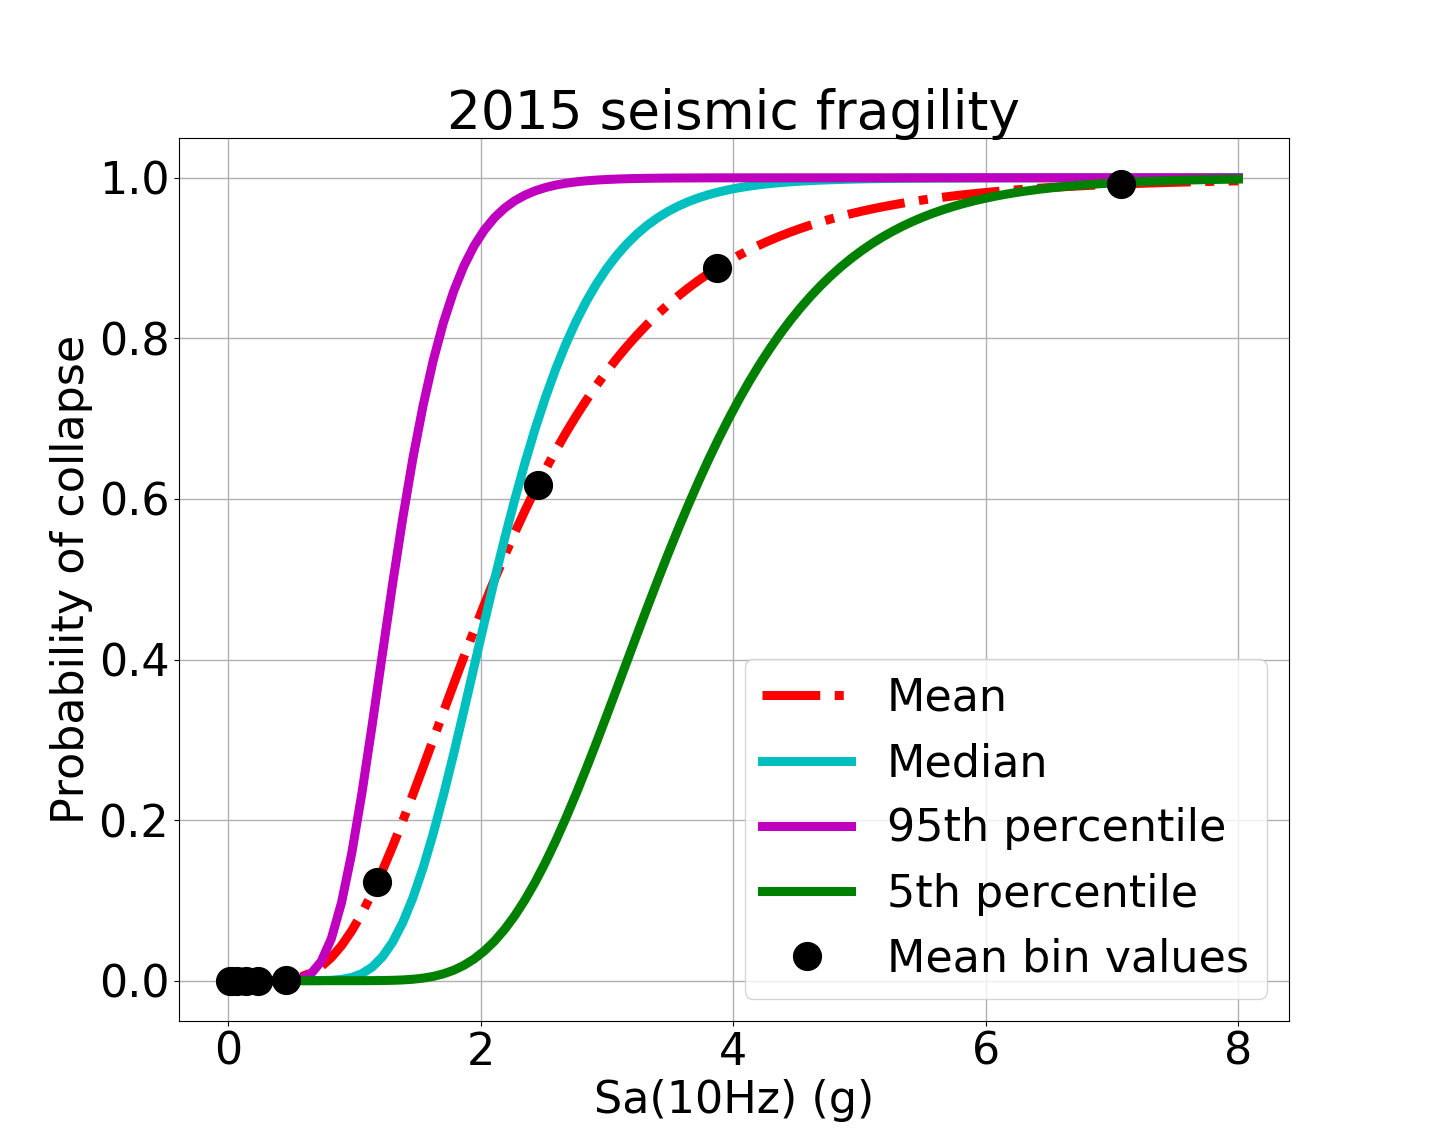
Figure 6: Mean, median, 5th and 95th percentile fragility functions for the 2015 assessment.
Event tree and fault tree for risk evaluation
The event tree and fault tree of the GNF used in this example are presented in Figure 2 and Figure 3, respectively. The seismic failure case of the GNF can be expressed as a simple fault tree with a single basic event, which is the collapse of the structure (named STRUCT_COLLAPSE) from a seismic event. Since the MASTODON FTA module requires at least two basic events, this event is combined with a DUMMY event with a probability of 1.0 as shown in Figure 3. This is described further in the next section. The event tree can also be expressed using a single event, where the collapse of the structure leads to a breach in containment.
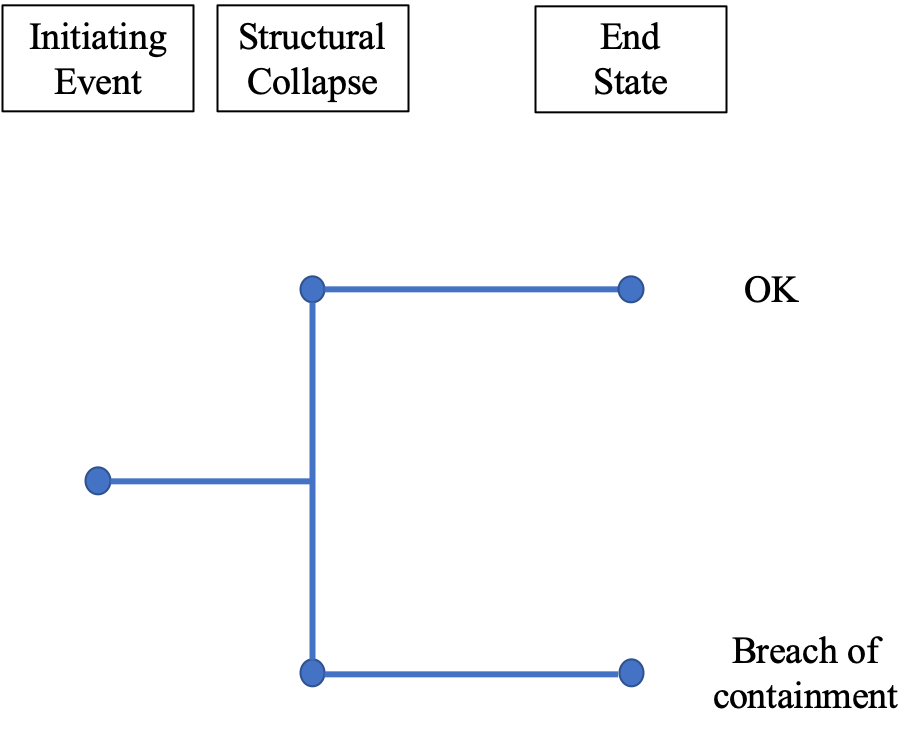
Figure 2: Event tree for each bin of the seismic hazard curve for both the 2006 and the 2015 assessments. The logic of the event trees across the bins is the same except for the initiating event.
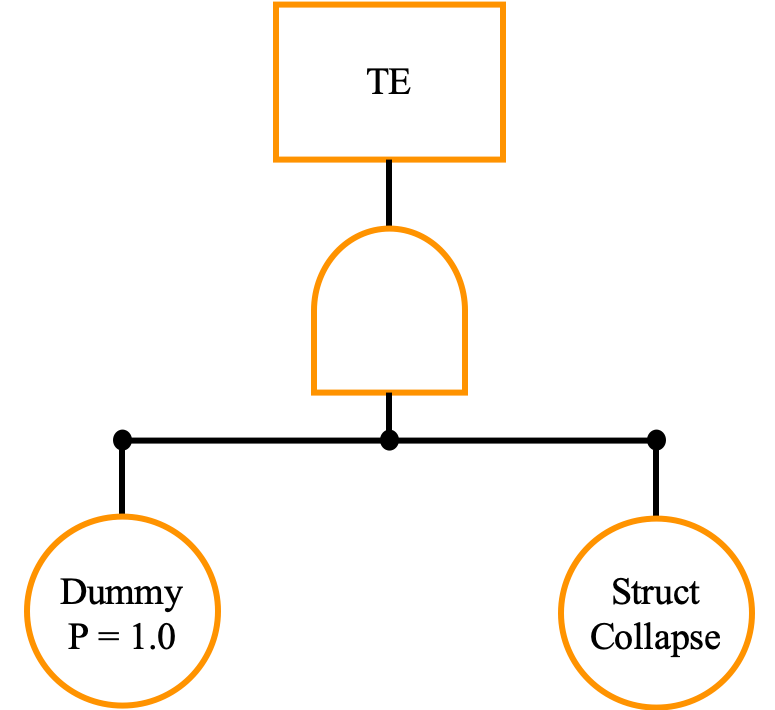
Figure 3: Fault tree used for aggregating the seismic risk for both the 2006 and the 2015 assessments.
Inputs to the MASTODON FTA Python module
Seismic risk assessment of the GNF is performed separately for the two seismic hazard curves. The seismic risk is calculated by splitting the hazard curve into a number of bins, and calculating the risk of collapse for each bin. In this example, both the seismic hazard curves in Figure 1 are split into 10 bins. The spectral acceleration corresponding to each bin is calculated as the geometric mean of the spectral accelerations of the extents of the bin. The corresponding mean annual frequency of exceedance (MAFE) for the bin is calculated through linear interpolation of the hazard curve in the log-log scale.
The inputs required for the seismic risk assessment using the FTA python module include the seismic hazard curve, fault tree logic, and the seismic fragilities of the basic events. The MASTODON FTA module is currently limited to fault tree analyses, and not event tree analyses. Since the event tree in this example comprises of a single event, event tree analysis will not be required. The seismic hazard, fault tree logic, and basic event fragilities can be either input directly as python lists, or as csv files. For this example, they are provided as csv files. The seismic hazard input file for the 2006 hazard is listed below. As seen in the file, the seismic hazard is simply specified as pairs of intensity measure and the corresponding MAFE.
0.04,4.85E-02
0.11,1.23E-02
0.21,3.21E-03
0.42,5.94E-04
0.64,1.86E-04
0.87,7.56E-05
1.09,3.58E-05
1.52,1.08E-05
2.17,2.72E-06
3.26,4.78E-07
4.34,1.21E-07
6.51,1.52E-08
The fault tree analysis in the FTA module cannot be performed with a single basic event, which is the case for this example. Therefore, a dummy basic event with a point estimate probability of 1.0 is included in the fault tree logic along with an AND condition. This is logically equivalent to having the one basic event as shown in Figure 3. The fault tree logic input file is shown below, along with the basic event input file. The two basic events in the files below named STR_COLLAPSE and DUMMY, correspond to the collapse of the structure and the dummy event, respectively. TE in the logic file denotes the top event for which, the probability of failure is being calculated. Note that the structural collapse fragility is expressed as a lognormal distribution (indicated by LNORM in the basic events file) with the median and composite logarithmic standard deviation as described before. The basic event fragility input files for the 2006 assessment is listed below.
TE,AND,STR_COLLAPSE,DUMMY
STR_COLLAPSE,LNORM,1.31,0.4494
DUMMY,PE,1.0
The analysis is performed in Python by simply creating an instance of the FaultTree class in the FTA module. For example, the assessment for the 2006 hazard is performed by the code below.
from mastodonutils import FTA
quant2006 = FTA.Quantification("gnf_2006",
                           logic='logic.csv',
                           basic_events='bas_events_2006.csv',
                           analysis='Fragility',
                           hazard='seismic_hazard_2006.csv',
                           IM=[0.04, 0.11, 0.21, 0.42, 0.64, 0.87, 1.09, 1.52, 3.26, 4.34, 6.51],
                           lite=True,
                           nbins=10,
                           write_output=True)
In this code, note that the logic, basic event fragilities, and the seismic hazard are provided using the input parameters, logic, basic_events, and hazard, respectively. The IM parameter inputs the intensity bins in the hazard curve. In this case, since a list of intensities is provided, MASTODON will assume that they correspond to the extents of the intensity bins. Since 11 intensities are provided here, MASTODON uses these values to divide the hazard curve into 10 bins, and the nbins parameter is ignored. The lite option ensures that Approach 2 is used to calculated the risk. Details of this approach can be found in the documentation in the FTA.py file. The write_output option ensures that the results are saved in csv format.
This code and the code for the 2015 hazard can be found in the Python notebook, risk_calcs.ipynb of the example8 folder. Executing this file will perform the risk analysis for the 2006 and 2015 seismic hazards, and also plot the resulting collapse frequencies for all bins.
Results
The results calculated from the code above will be saved as csv files in the folder, gnf_2006_results/approach_2/. Since the lite version of the analysis is performed, the results from Approach 1 are not calculated. The results file for the analysis in this example is listed below.
bin#,im,mafe,top_failure_prob,delta_mafe,bin_risk
1,0.066332495807108,0.02442437307281398,1.5901919298535245e-11,0.03620000000000001,5.756494786069761e-13
2,0.15198684153570663,0.0062835499520573585,8.213980725502193e-07,0.009089999999999994,7.46650847948149e-09
3,0.29698484809834996,0.0013808475658087685,0.0004792959077495356,0.002616000000000002,1.253838094672786e-06
4,0.5184592558726288,0.0003323913356271492,0.019576537123627977,0.00040799999999999994,7.987227146440214e-06
5,0.7461903242471052,0.0001185816174624044,0.105222948519137,0.00011040000000000011,1.1616613516512736e-05
6,0.9738069623903908,5.202384068866889e-05,0.25465167425006713,3.979999999999995e-05,1.0135136635152659e-05
7,1.287167432776327,1.9663163529808724e-05,0.4843950570487591,2.5000000000000025e-05,1.210987642621899e-05
8,2.226027852476244,2.43933935537395e-06,0.880955471231556,1.0321999999999994e-05,9.093222374052116e-06
9,3.7614358960375753,2.4049532219982994e-07,0.9905391714946518,3.570000000000004e-07,3.536224842235911e-07
10,5.315392741839497,4.288589511715939e-08,0.9990851119160117,1.0579999999999993e-07,1.0570320484071396e-07
The columns names in the results file indicate the following:
bin#: bin numberim: intensity measure ( at 10Hz in this case).mafe: MAFE for the bin.top_failure_prob: failure probability of top event, i.e., the top event fragility. In this case, the collapse probability of the structure given an input ground at 10Hz.delta_mafe: mean annual frequency of occurrence of the intensity measures of the bin. This is calculated as the difference between the MAFE values of the extents of bin.bin_risk: risk corresponding to this bin and is calculated as the product oftop_failure_probanddelta_mafe. In this case, it is the collapse frequency for the bin. The summation of this value across all the bins provides the total risk.
The collapse fragility calculated from the fault tree analysis is convolved with the hazard curve to calculate the final risk of collapse of the facility. In the MASTODON FTA module, the final risk is stored in the `toprisk_2' class variable and can be printed as follows:
print quant2006.toprisk_2
The final collapse risk for the 2006 and the 2015 assessments calculated using MASTODON are listed in Table 2 below.
Table 2: Structural collapse risks for GNF calculated using MASTODON.
| Year of assessment | Risk of collapse |
|---|---|
| 2006 | 5.27e-05 |
| 2015 | 5.20e-06 |
Note that the collapse risk calculated using the updated seismic hazard and fragilities in 2015 is almost an order of magnitude smaller than those calculated in 2006. The collapse frequencies for each bin calculated using MASTODON for the 2006 and 2015 assessment are plotted in Figure 4 below. Note that the collapse frequencies in each bin are also smaller in the 2015 assessment, except for the last bin where the collapse frequencies for the two assessments are almost equal.
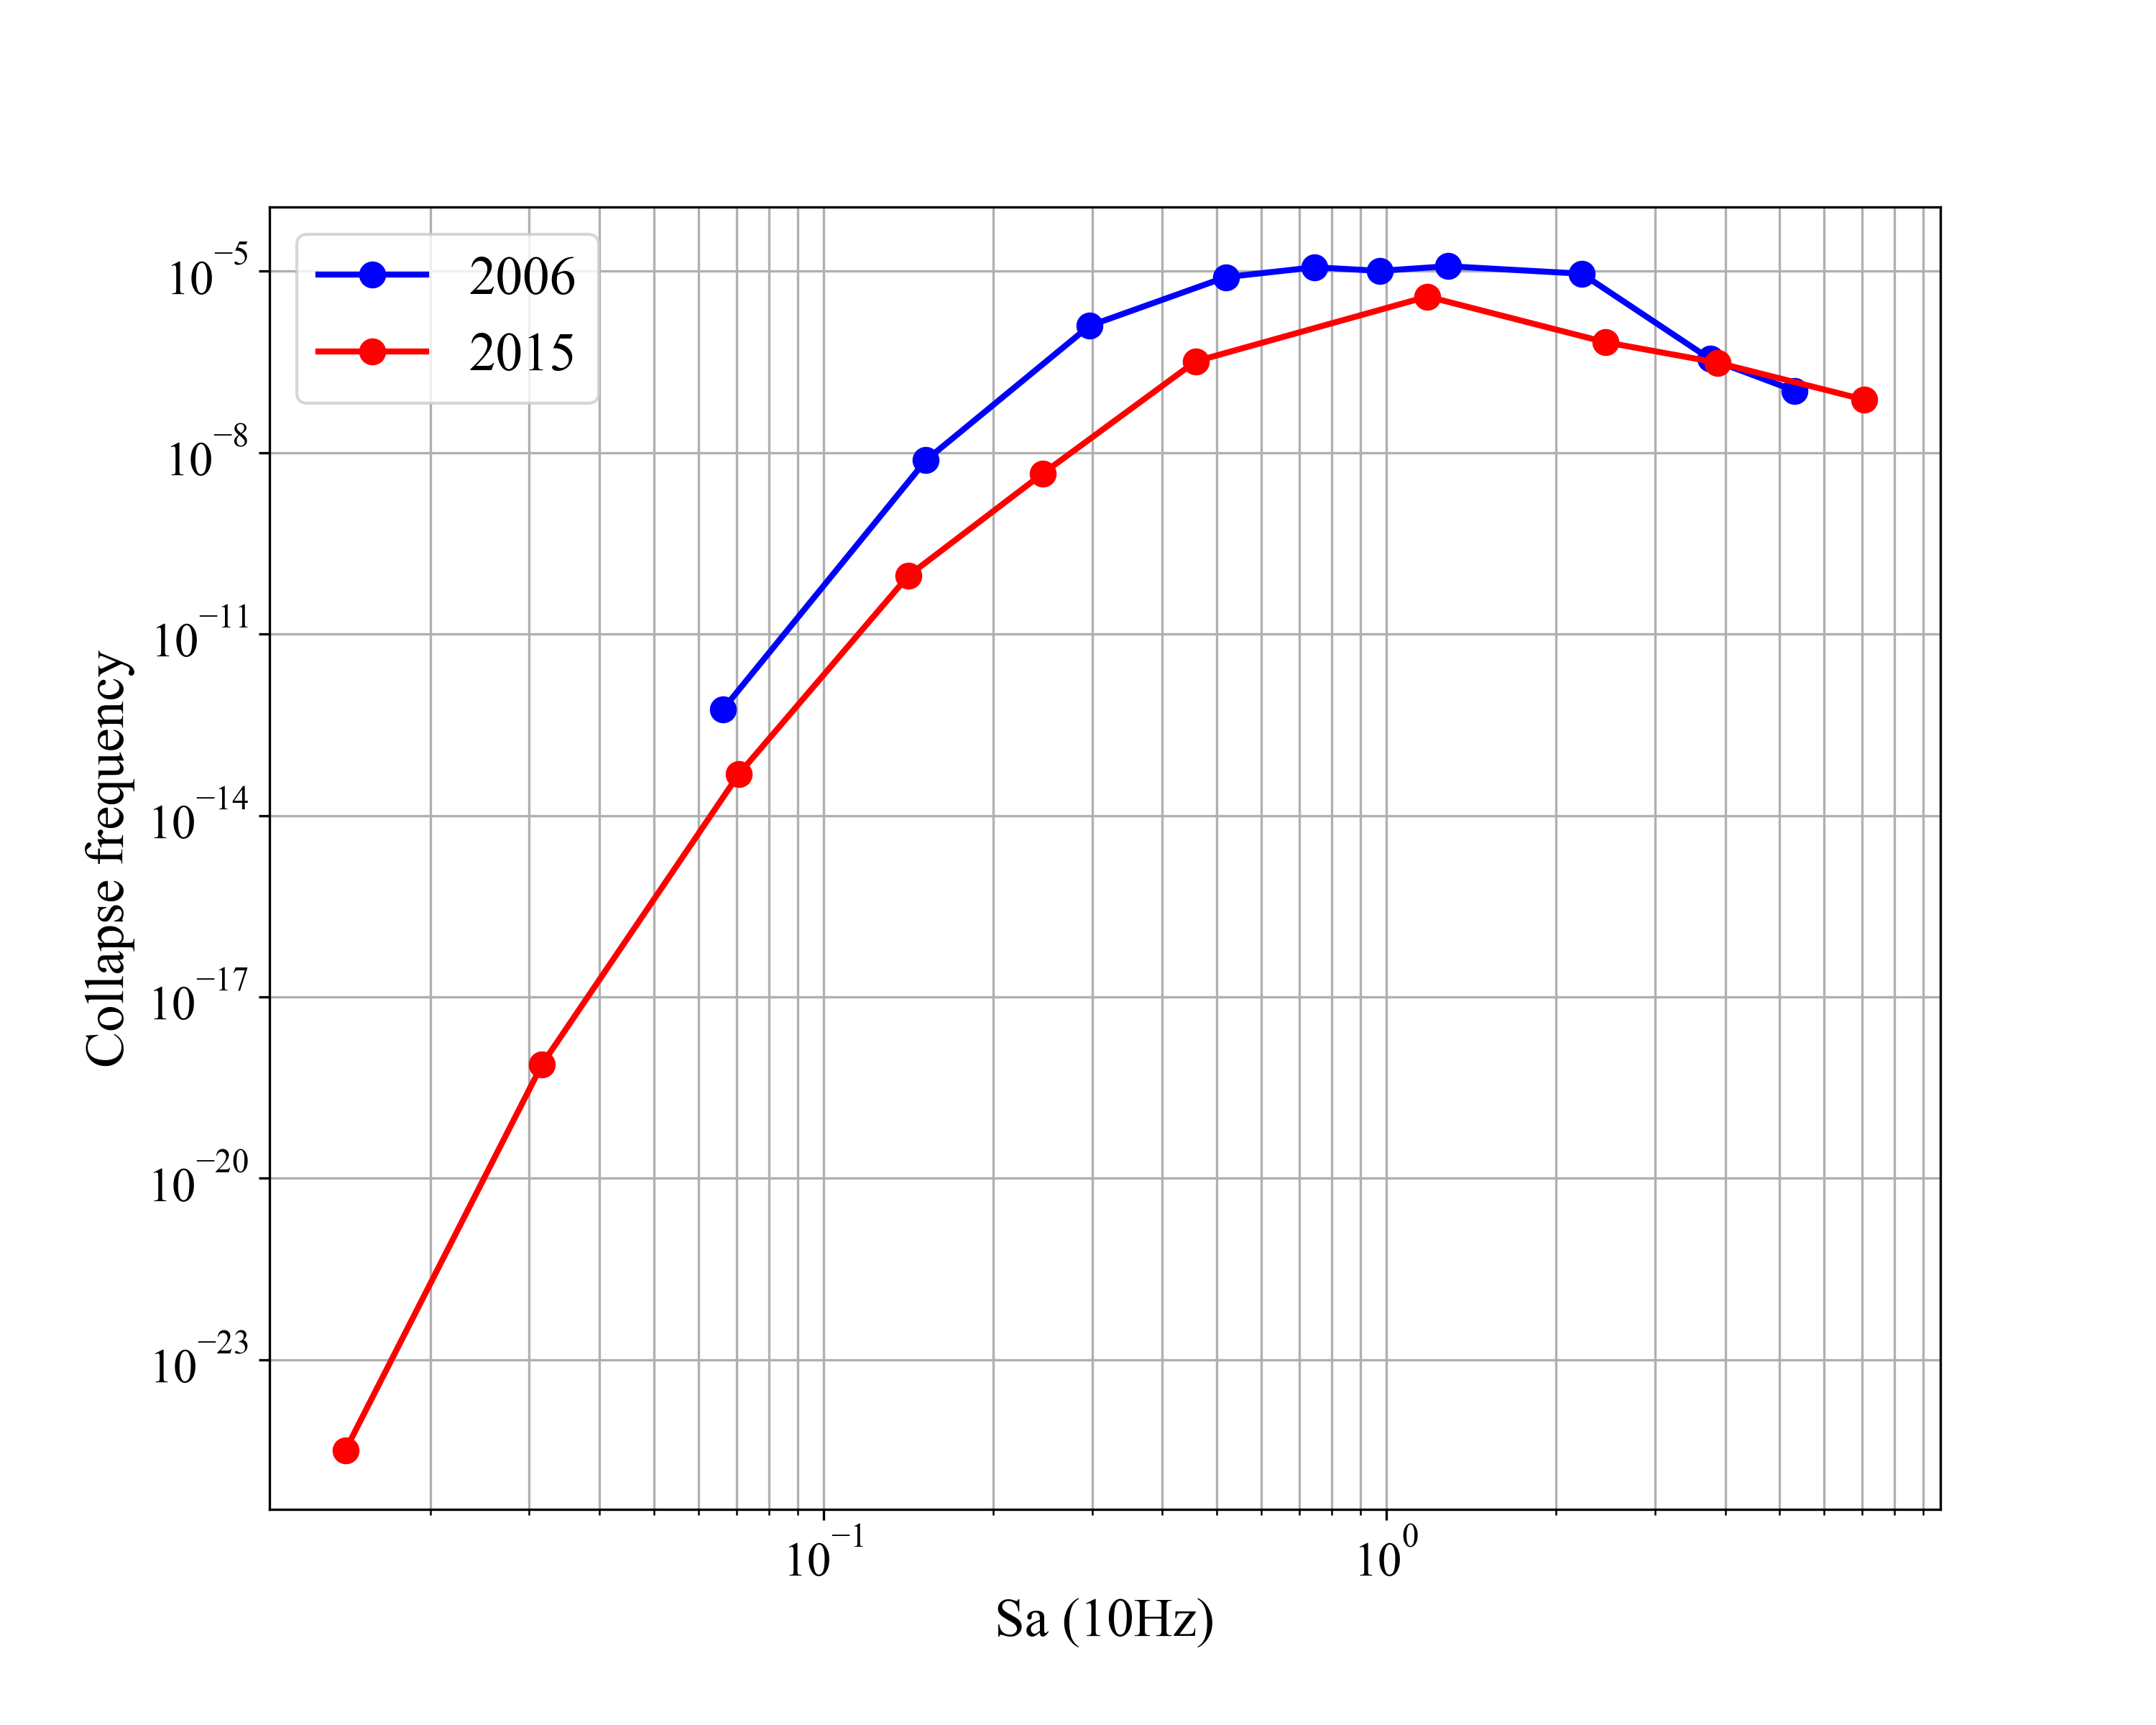
Figure 4: Collapse frequencies for the 2006 and 2015 seismic risk assessments of GNF calculated using MASTODON.
References
- ASCE.
Seismic design criteria for structures, systems and components for nuclear facilities.
Technical Report ASCE/SEI 43-05, American Society of Civil Engineers, 2005.[BibTeX]
- M. Cox, P. Henslee, and J. L. Coleman.
Inl 10 year seismic re-evaluation for fmf and zppr.
Technical Report INL/EXT-16-37751, Idaho National Laboratory, 2016.[BibTeX]
- S.J. Payne, K.J. Coppersmith, R. Coppersmith, V.M. Falero, R. Youngs, A. Rodriguez-Marek, and W. Silva.
Application of the seismic hazard periodic re-evaluation methodology using a SSHAC level 1 study at the Idaho National Laboratory.
In Seismic Lessons Learned DOE Meeting. 2017.[BibTeX]
- S.J. Payne, K.J. Coppersmith, R. Coppersmith, V.M. Falero, R.R. Youngs, A. Rodriguez-Marek, and W. Silva.
Assessing the need for an update of a probabilistic seismic hazard analysis using a SSHAC level 1 study and the seismic hazard periodic re-evaluation methodology.
Nuclear Engineering and Design, 323:103–119, 2017.[BibTeX]