ver-1d
Permeation Problem with Trapping
Test Description
This verification problem is taken from Longhurst et al. (1992), and it has been updated and extended in Simon et al. (2025). It models permeation through a membrane with a constant source in which traps are operative. We solve the following equations
(1) (2) and where and are the concentrations of the mobile and trapped species respectively, is the diffusivity of the mobile species, and are the trapping and release rate coefficients, is a factor converting the magnitude of to be closer to for better numerical convergence, is the fraction of host sites that can contribute to trapping, is the concentration of empty trapping sites, and is the host density.
The breakthrough time may have one of two limiting values depending on whether the trapping is in the effective diffusivity or strong-trapping regime. A trapping parameter is defined by:
(3)
where
= lattice parameter
= Debye frequency ( )
= trapping site fraction
= diffusivity pre-exponential
= diffusion activation energy
= trap energy
= Boltzmann's constant
= temperature
= dissolved gas atom fraction
The discriminant for which regime is dominant is the ratio of to c/. If c/, then the effective diffusivity regime applies, and the permeation transient is identical to the standard diffusion transient, with the diffusivity replaced by an effective diffusivity
(4)
to account for the fact that trapping leads to slower transport.
In this limit, the breakthrough time, defined as the intersection of the steepest tangent to the diffusion transient with the time axis, will be
(5)
where is the thickness of the slab and D is the diffusivity of the gas through the material. The permeation transient is then given by
(6)
Ambrosek and Longhurst (2005) where is defined in Eq. (5)
In the deep-trapping limit, c/, and no permeation occurs until essentially all the traps have been filled. Then the system quickly reaches steady-state. The breakthrough time is given by
(7)
where is the steady dissolved gas concentration at the upstream (x = 0) side.
Using TMAP8 we examine these two different regimes, one where diffusion is the rate-limiting step, and one where trapping is the rate-limiting step. The upstream-side starting concentration of 0.0001 atom fraction, a diffusivity of 1 /s, a trapping site fraction of 0.1, , and a temperature of 1000 K is considered.
Diffusion-limited
For the effective diffusivity limit, we selected K to give . The comparison results are presented in Figure 1 with a root mean square percentage error of RMSPE = 0.96% for s.
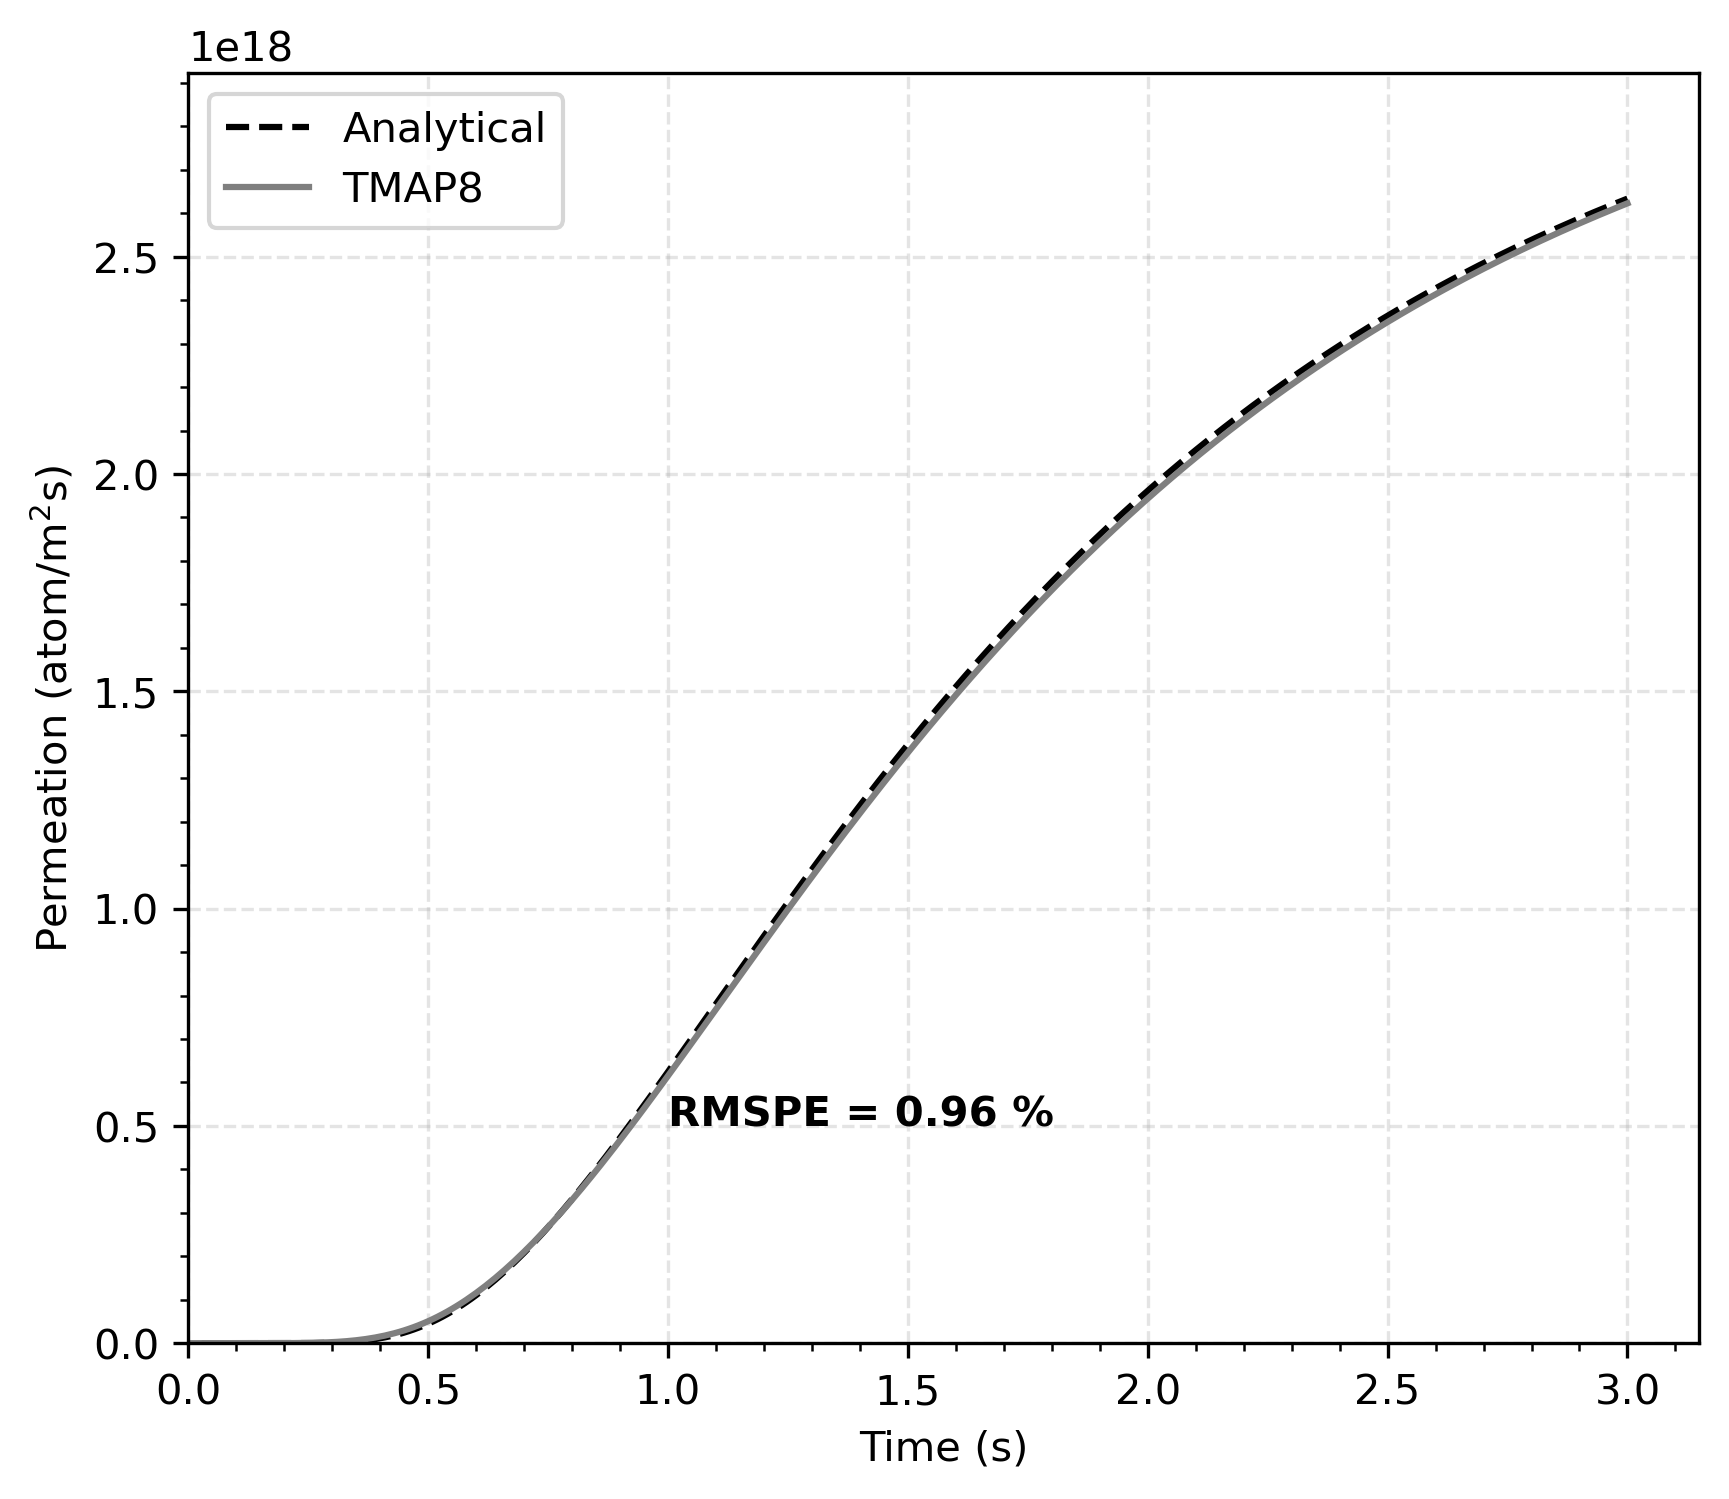
Figure 1: Permeation history of a slab subject to effective-diffusivity limit trapping.
Trapping-limited
For the deep trapping limit we took K to give . The comparison results are presented in Figure 2.
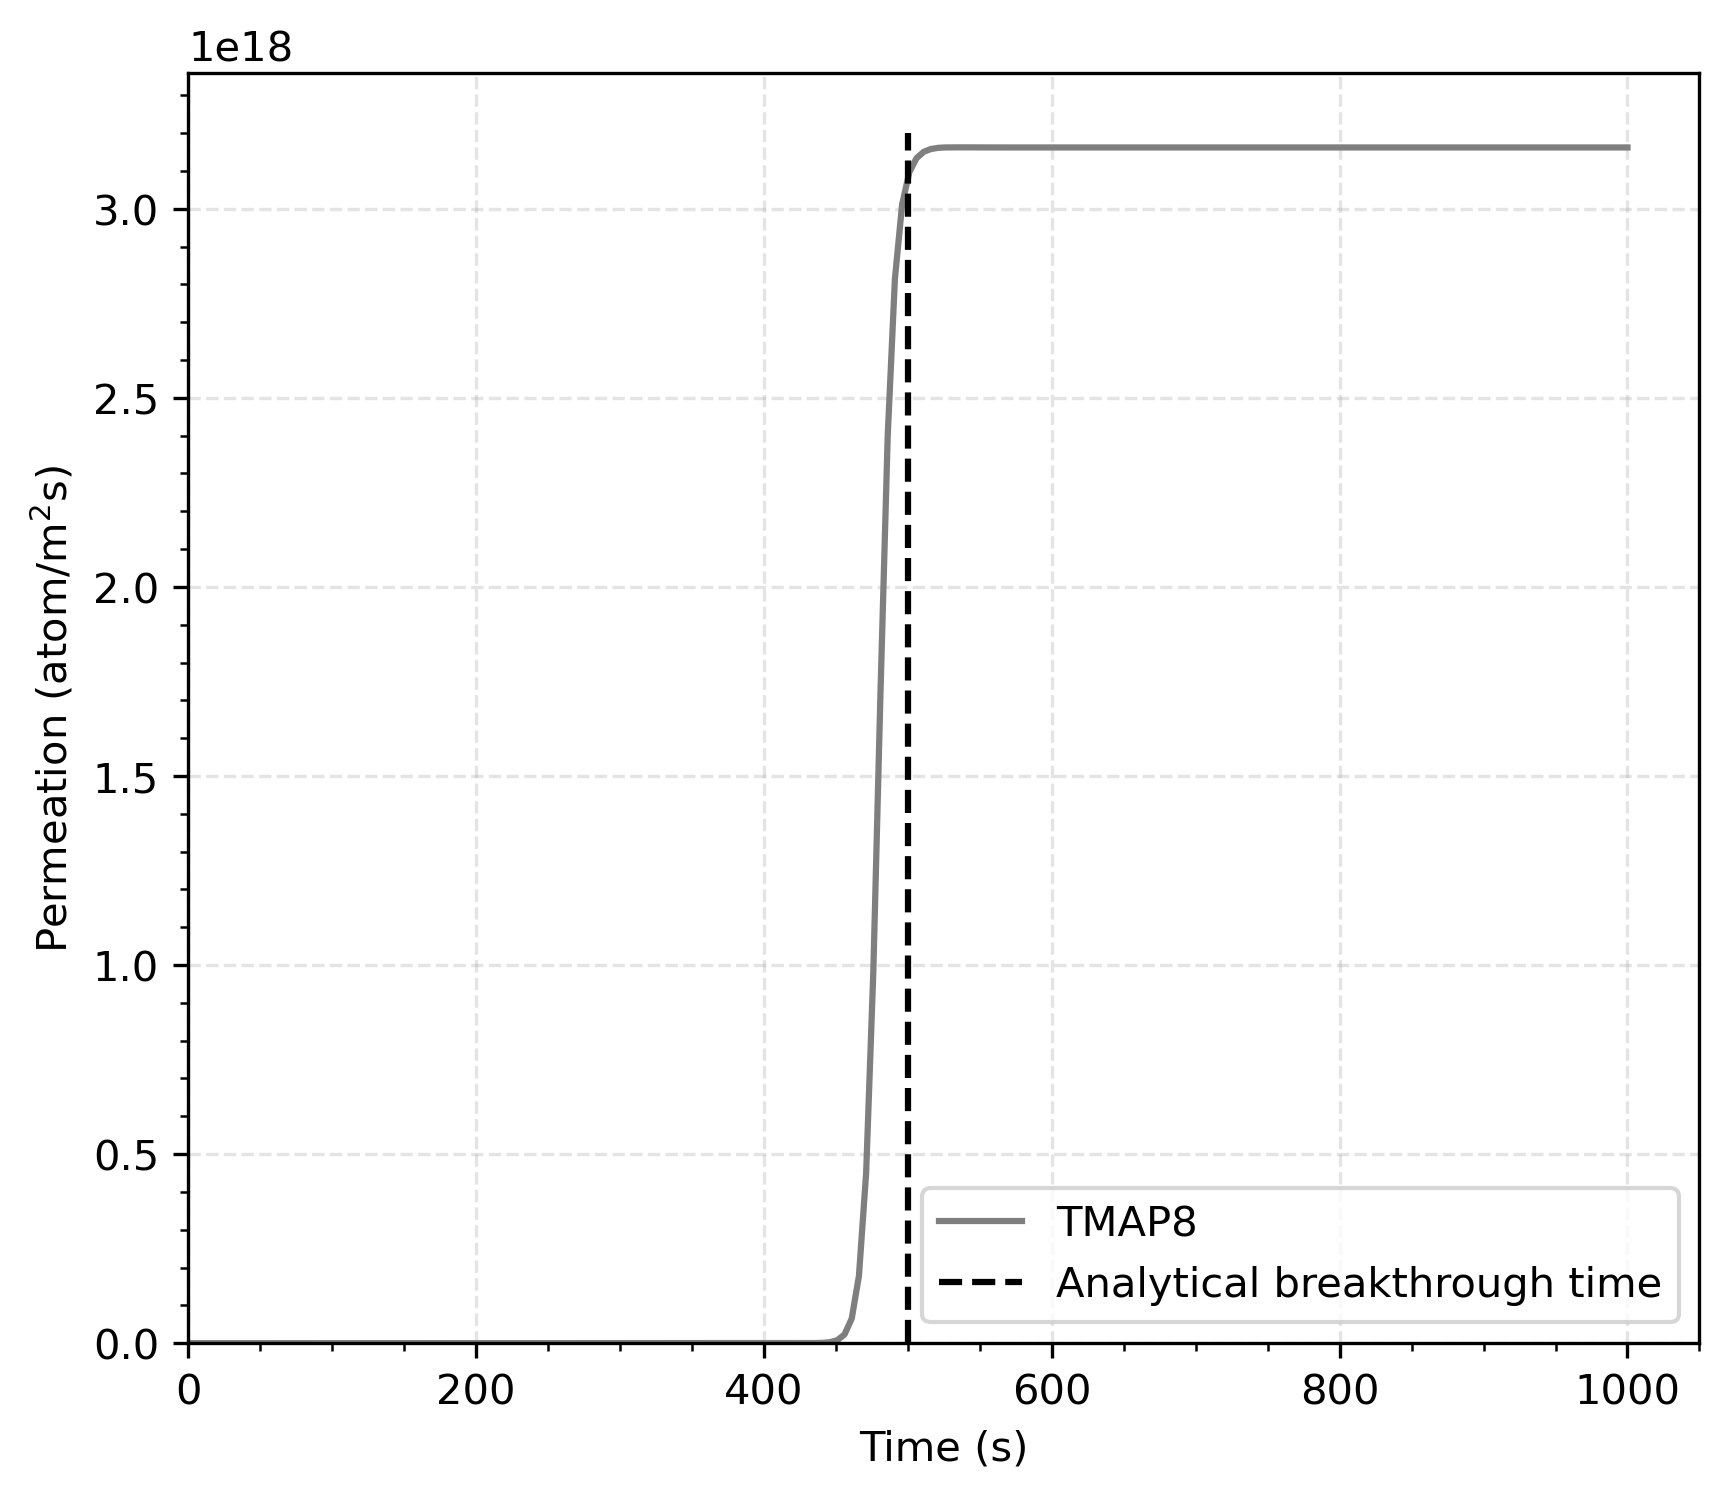
Figure 2: Permeation transient in a slab subject to strong trapping.
Notes
The trapping test input file can generate oscillations in the solution due to the feedback loop between the diffusion PDE and trap evolution ODE. In order for the oscillations to not take over the simulation, it seems that the ratio of the inverse of the Fourier number must be kept sufficiently high, e.g. . Included in this directory are three png files that show the permeation for different h and dt values. They are summarized below:
nx-80.png:nx = 80anddt = .0625nx-40.png:nx = 40anddt = .25nx-20.png:nx = 20anddt = 1
The oscillations in the permeation graph go away with increasing fineness in the mesh and in dt.
To keep the oscillations damped, the verification is run with nx=1000 and an adaptive time stepper with an initial time step of . Additionally, the boundary condition (BC) on the diffusion variable is increased gradually from the initial condition value of the variable (zero) to one over using the function
This takes the BC to 99.5% of its actual value in 3 s, which is a small fraction of the breakthrough time of 500 s. It therefore reduces numerical oscillations without affecting the expected solution.
Input files
The input files for the cases where diffusion and trapping are the rate limiting processes can be found at (test/tests/ver-1d/ver-1d-diffusion.i) and (test/tests/ver-1d/ver-1d-trapping.i), respectively. These input files are different from the input files used as tests in TMAP8. To limit the computational costs of the test cases, the tests run a version of the files with a coarser mesh and fewer time steps. More information about the changes can be found in the test specification file for this case, namely (test/tests/ver-1d/tests).
References
- James Ambrosek and Glen R Longhurst.
Verification and validation of the tritium transport code TMAP7.
Fusion science and technology, 48(1):468–471, 2005.[BibTeX]
- GR Longhurst, SL Harms, ES Marwil, and BG Miller.
Verification and Validation of TMAP4.
Technical Report EGG-FSP-10347, Idaho National Engineering Laboratory, Idaho Falls, ID (United States), 1992.[BibTeX]
- Pierre-Clément A. Simon, Casey T. Icenhour, Gyanender Singh, Alexander D Lindsay, Chaitanya Vivek Bhave, Lin Yang, Adriaan Anthony Riet, Yifeng Che, Paul Humrickhouse, Masashi Shimada, and Pattrick Calderoni.
MOOSE-based tritium migration analysis program, version 8 (TMAP8) for advanced open-source tritium transport and fuel cycle modeling.
Fusion Engineering and Design, 214:114874, May 2025.
doi:10.1016/j.fusengdes.2025.114874.[BibTeX]