ver-1b
Diffusion Problem with Constant Source Boundary Condition
This verification problem is taken from Longhurst et al. (1992), and it has been updated and extended in Simon et al. (2025). Diffusion of tritium through a semi-infinite SiC layer is modeled with a constant source located on one boundary. No solubility or trapping is included. The concentration as a function of time and position is given by where the constant source concentration, erfc is the error function, is the distance from the boundary, is the diffusion coefficient, and is the time.
Comparison of the TMAP8 results and the analytical solution is shown in Figure 1 as a function of time at mm. For simplicity, both the diffusion coefficient and the initial concentration were set to unity. The TMAP8 code predictions match the analytical solution very well.
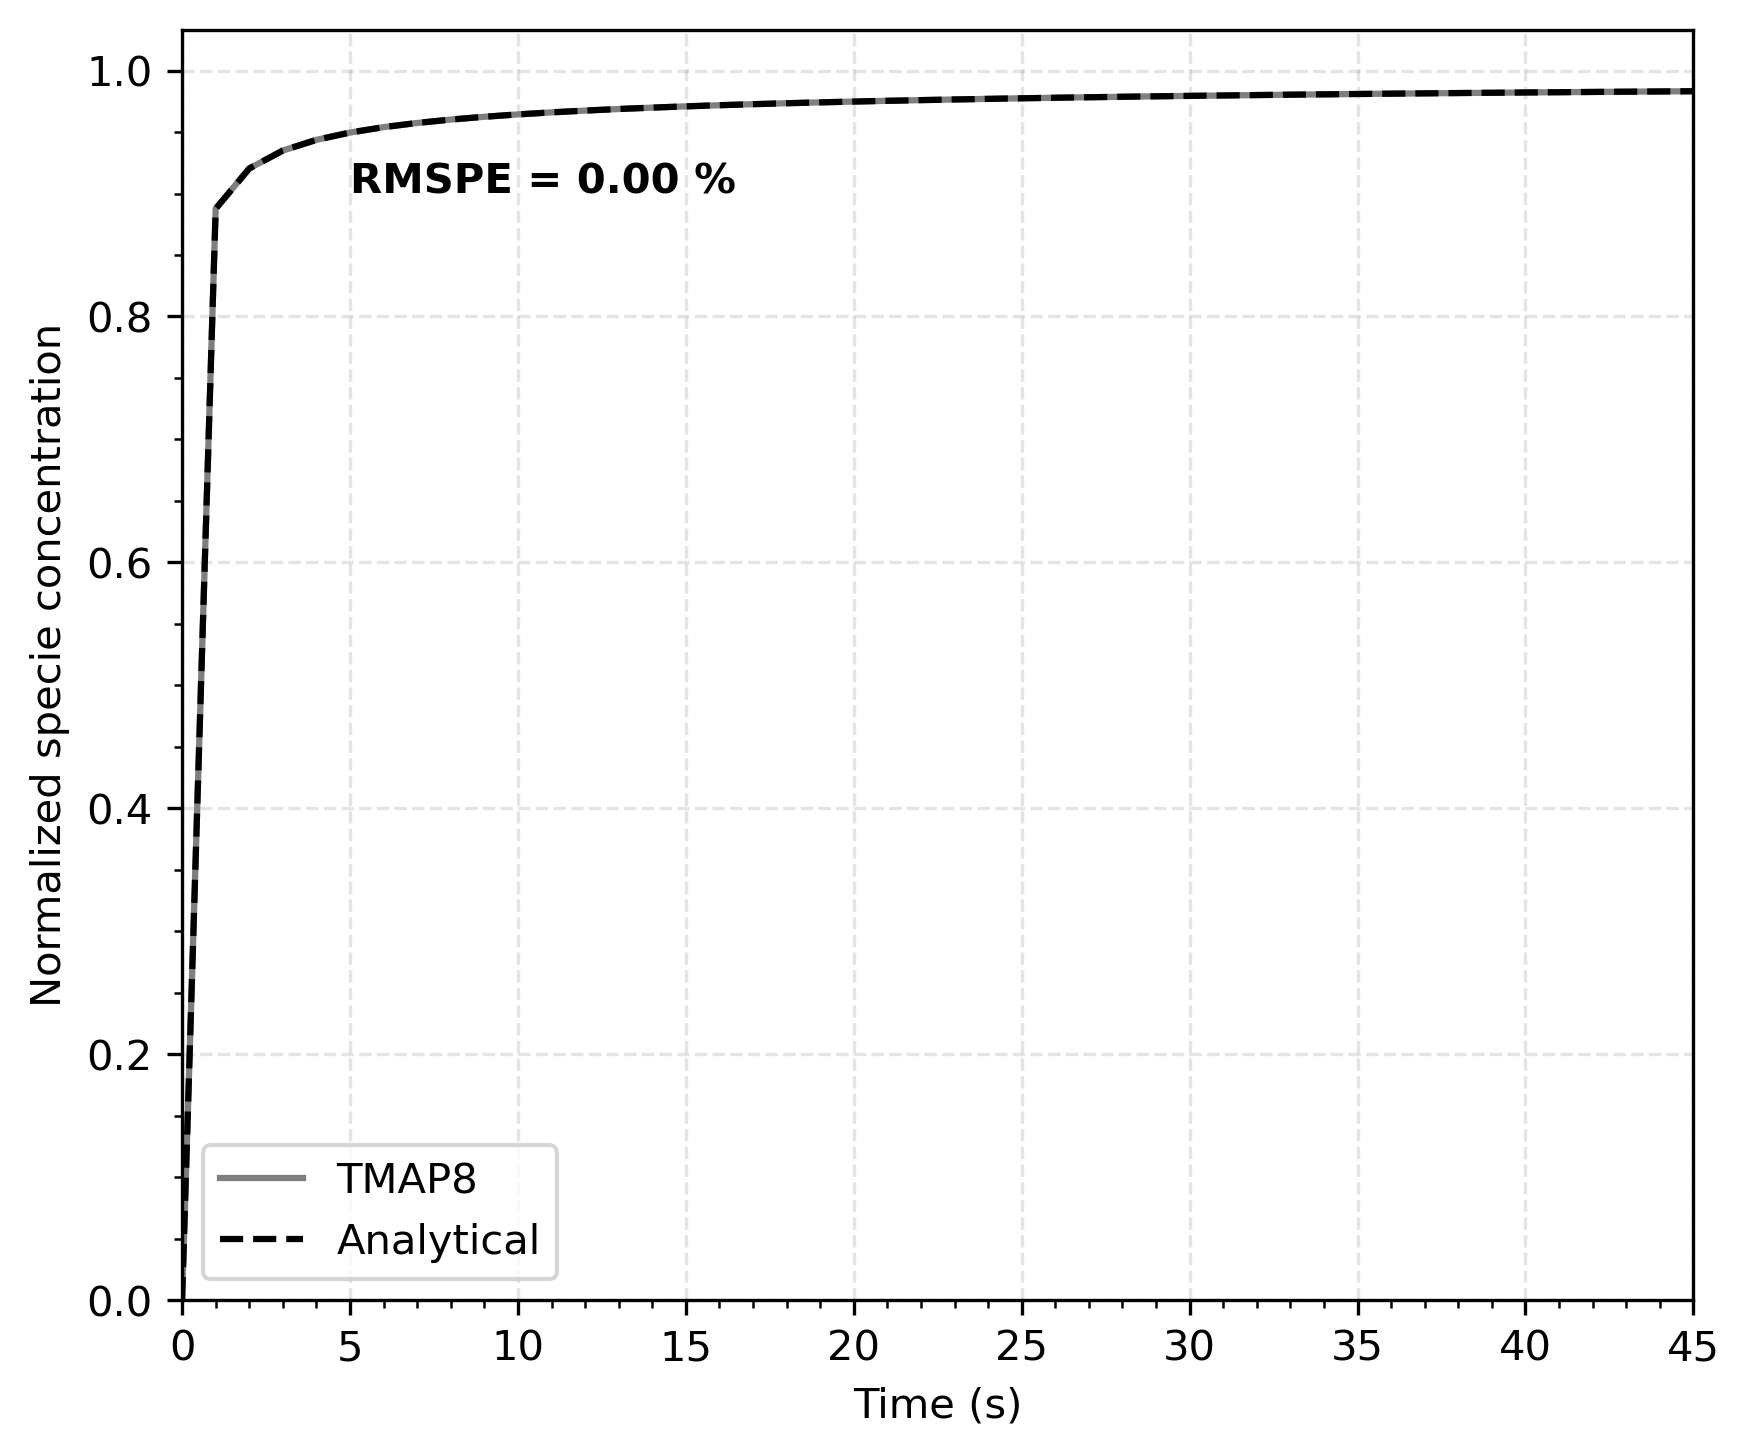
Figure 1: Comparison of concentration as function of time at m calculated through TMAP8 and analytically.
As a second check, the concentration as a function of position at a given time s calculated by TMAP8 was compared with the analytical solution as shown in Figure 2. The predicted concentration profile from TMAP8 is in good agreement with the analytical solution.
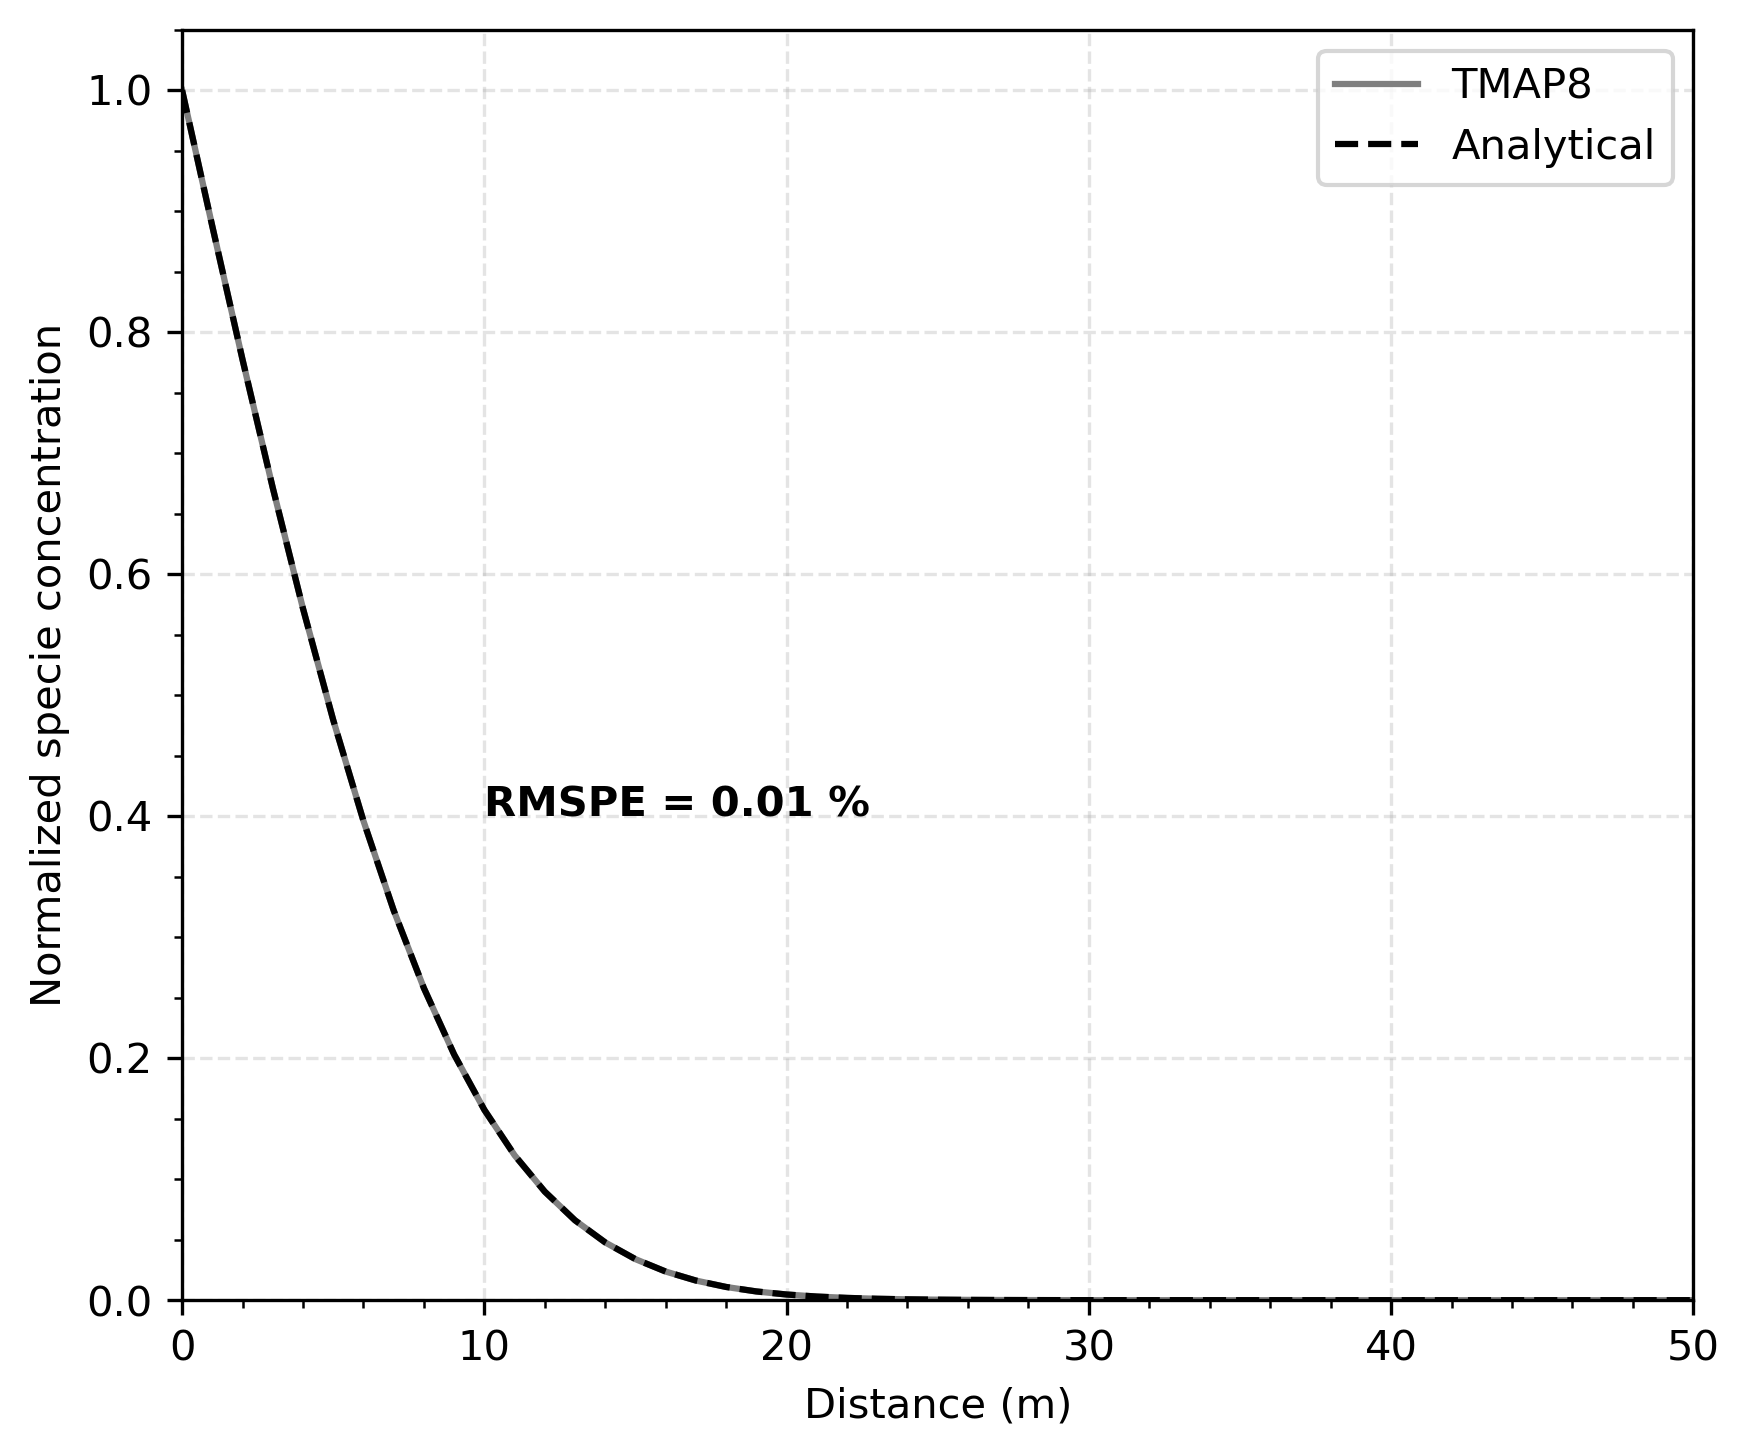
Figure 2: Comparison of concentration as function of distance from the source at s calculated through TMAP8 and analytically.
Finally, the diffusive flux () was compared with the analytic solution where the flux is proportional to the derivative of the concentration with respect to and is given by (1)
The flux as given by Eq. (1) is compared with values calculated by TMAP8. The diffusivity, D, and the initial concentration, , were both taken as unity, and the distance, , was taken as 0.5 in this comparison. TMAP8 initially underpredicts but the results match well subsequently. Comparison results are shown in Figure 3 with a root mean square percentage error of RMSPE = 6.03 %. The error is calculated for s due to infinite value at small .
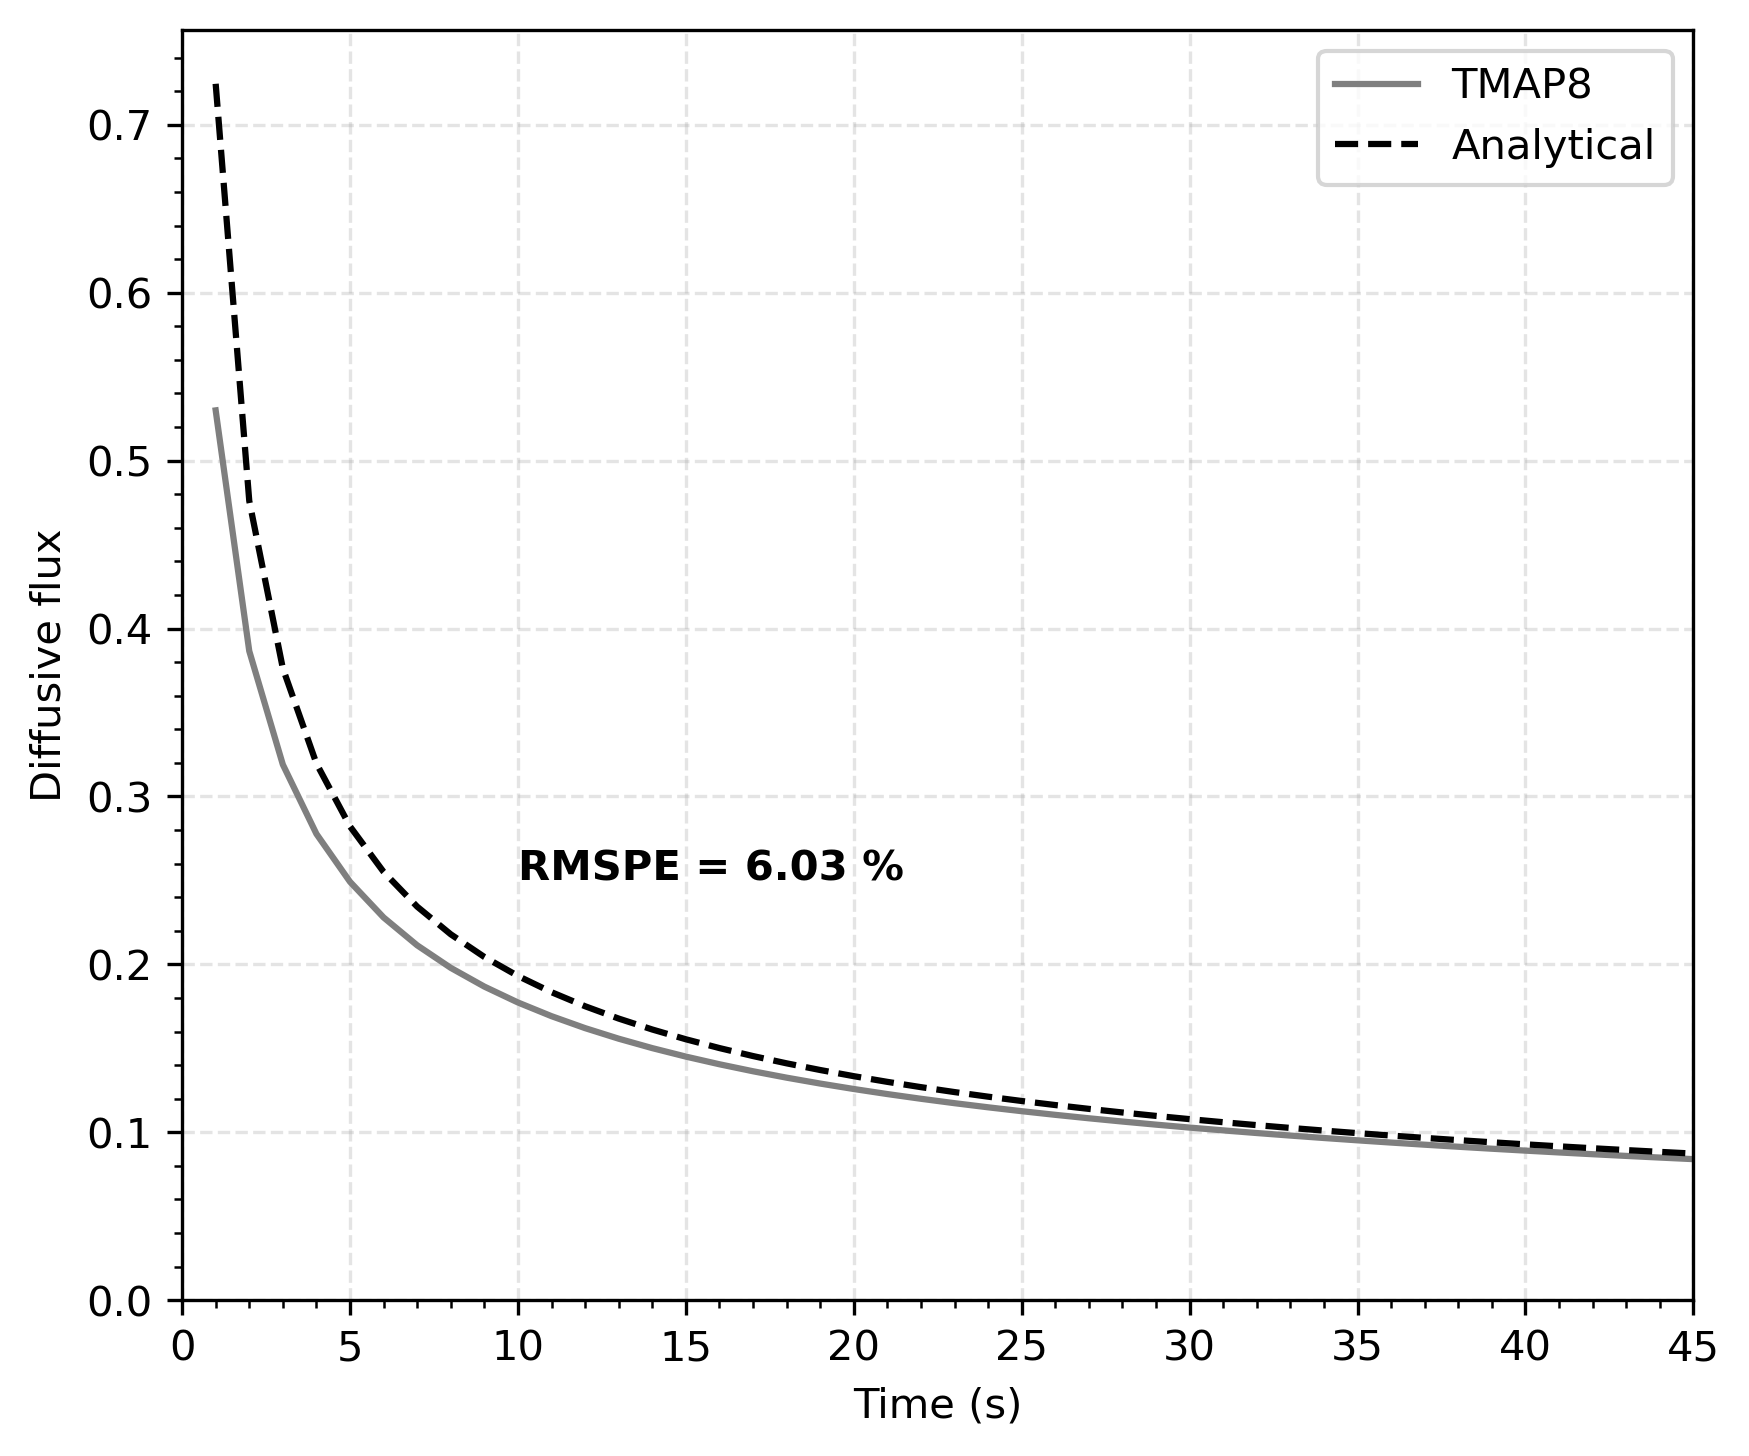
Figure 3: Comparison of flux as function of time at x=0.5m calculated through TMAP8 and analytically.
The oscillations in the permeation graph go away with increasing fineness in the mesh and in the time step dt.
Input files
The input file for this case can be found at (test/tests/ver-1b/ver-1b.i), which is different from the input file used as test in TMAP8. To limit the computational costs of the test cases, the tests run a version of the file with a coarser mesh and larger time steps. More information about the changes can be found in the test specification file for this case (test/tests/ver-1b/tests).
References
- GR Longhurst, SL Harms, ES Marwil, and BG Miller.
Verification and Validation of TMAP4.
Technical Report EGG-FSP-10347, Idaho National Engineering Laboratory, Idaho Falls, ID (United States), 1992.[BibTeX]
- Pierre-Clément A. Simon, Casey T. Icenhour, Gyanender Singh, Alexander D Lindsay, Chaitanya Vivek Bhave, Lin Yang, Adriaan Anthony Riet, Yifeng Che, Paul Humrickhouse, Masashi Shimada, and Pattrick Calderoni.
MOOSE-based tritium migration analysis program, version 8 (TMAP8) for advanced open-source tritium transport and fuel cycle modeling.
Fusion Engineering and Design, 214:114874, May 2025.
doi:10.1016/j.fusengdes.2025.114874.[BibTeX]