val-2d
Thermal Desorption Spectroscopy on Tungsten
Case Description
This validation problem is taken from Hino et al. (1998) with multiple trapping capability. This case is part of the validation suite of TMAP7 as val-2d (Ambrosek and Longhurst, 2008). In this experiment, tritium is implanted at 5 keV and a flux of 1 atom/m/s for 5,000 seconds into a 0.1 mm thick polycrystalline tungsten foil with a surface area of 50 50 mm at room temperature (300 K). The background pressure in the implantation chamber is 10 Pa while the implantation is going on and 10 Pa the rest of the time. Following the implantation, the sample is subjected to thermal desorption spectroscopy by heating under vacuum at 50 K/min to 1,273 K and then held at that temperature for several minutes.
The system is in the structure of Figure 1. The implantation chamber (Enclosure 1) has a volume of 0.1 and is evacuated by a turbo-molecular vacuum pump. The implantation chamber is defined for this problem as a enclosure having a preprogrammed temperature of 300 K for 5,000 seconds followed by a ramp to 1,273 K at a ramp rate of 50 K/min. Gas leakage from the ion source is represented by a enclosure with a pressure of Pa during implantation followed by Pa and flow to the implantation chamber at the vacuum pumping rate. Flow rate from the implantation chamber is taken to be 0.07 m/s on the basis of the stated pressure in the test chamber during implantation, given that nearly all implanted gas re-emerges during that time. The vacuum pump is represented by a enclosure (Enclosure 2) held at 10 Pa.
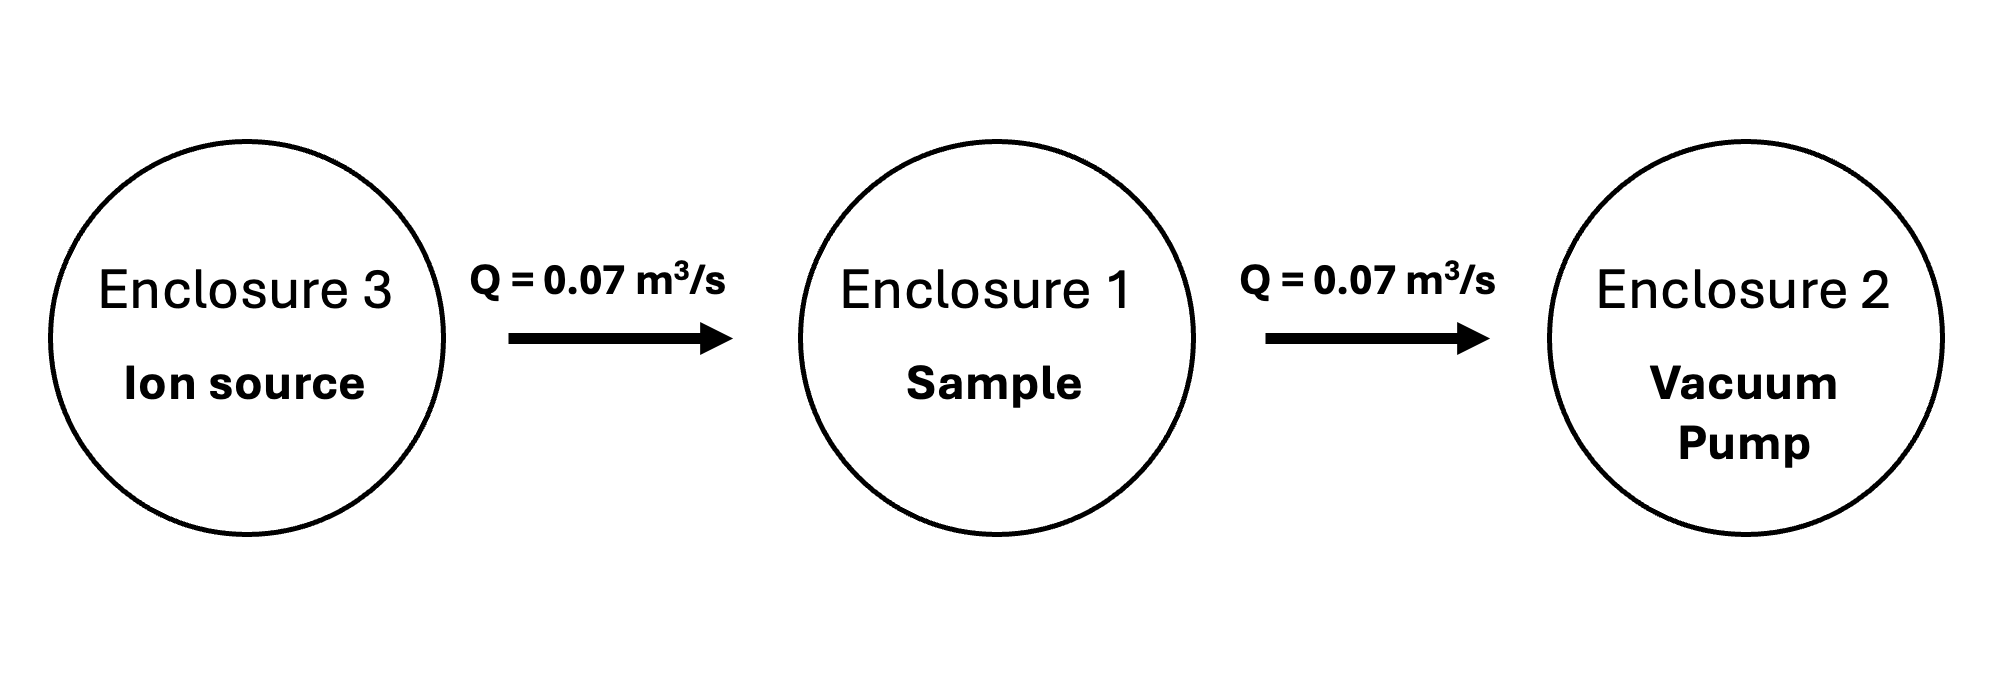
Figure 1: Schematic of the modeled enclosures for val-2d.
Based on TRIM calculations (Eckstein, 2013; Biersack and Ziegler, 1982), implantation in the sample shows a normal distribution, which has a peak at 4.6 nm below the surface and a characteristic half width of 3 nm. Implantation is activated for 5,000 s and then terminated.
Three trapping site populations are accounted for in the sample. Trap concentrations and distributions are considered adjustable parameters while energies were determined by TDS peak temperatures. The first trap is assumed to be associated with implantation (damage and precipitation) and to be normally distributed with a peak at 4.6 nm and a characteristic width of 10 nm, consistent with the observations of Haasz et al. (1999) that damage zone exceeds the implantation depth. Its trap energy is adjusted, based on the temperature of the first peak, to be 1.2 eV, and it is assumed to be 0.086 atom fraction at the peak. Its distribution is defined as:
(1)
where m is the characteristic width of the normal distribution, and m is the depth of the normal distribution from the upstream side. Eq. (1) uses the factor of 0.002156 to correspond to the peak atom fraction of 0.086 from Ambrosek and Longhurst (2008).
The second is a uniform trap associated with dislocations and is assigned a trap release energy of 1.6 eV, typical of but slightly higher than that seen by Anderl et al. (1992). Its concentration is adjusted to 0.00175 atom fraction. The third trap is also assumed to be uniformly distributed and to have a trapping energy of 3.1 eV, nearly the same as the deep trap seen by Frauenfelder (1969) with a concentration of 0.002 atom fraction. It is only marginally filled during the implantation because of the diffusive limitation to flow into the depth of the sample.
Therefore, the diffusion of tritium in sample is described as:
(2)
and, for , , and :
(3)
and
where is the concentration of tritium, is the time, is the source term in sample due to the tritium ion implantation, is the trapped species in trap , and are the trapping and release rate coefficients for trap , is a factor scaling to be closer to for better numerical convergence, is the fraction of host sites that can contribute to trapping, is the concentration of empty trapping sites, and is the host density, and is the tritium diffusivity in tungsten, which is defined as:
(4)
where is the diffusion activation energy, is the Boltzmann’s constant, is the temperature, and is the maximum diffusivity coefficient. TMAP7 (Ambrosek and Longhurst (2008)) assigns two different value, and , for implantation zone ( m) and other zone ( m).
and are defined as:
(5)
and
(6)
where and are pre-exponential factors of trapping and release rate coefficients, respectively, and are the trapping and detrapping energies, respectively.
The thermal diffusion after 5000 s is governing by:
(7)
where is the density of Tungsten, is the specific heat, and is the thermal conductivity.
All the model parameters are taken from Hino et al. (1998), Haasz et al. (1999), Anderl et al. (1992), Frauenfelder (1969), and Ambrosek and Longhurst (2008) and listed in Table 1. Whenever the original values are updated, it is specified in Table 1.
Model Description
In this case, TMAP8 simulates a one-dimensional domain to represent the tritium implantation, diffusion, and trapping and detrapping throughout the thermal history. Note that this case can easily be extended to a two- or three-dimensional case.
The source term in the model is described as a normal distribution in Eq. (8):
(8)
where is the implantation flux provided in Table 1, m is the characteristic width of the normal distribution, and m is the depth of the normal distribution from the upstream side.
The pressures on the upstream and downstream sides are close to vacuum pressures, and do not have a significant impact on tritium desorption. Thus, TMAP8 ignores the pressure in these enclosures for simplification. Also, because both surfdep and Dirichlet boundary conditions have similar desorption performance in the near vacuum environment, we use Dirichlet boundary condition to improve the model efficiency. The concentrations on upstream and downstream sides are defined as:
(9)
Due to the high thermal conductivity in Tungsten, the model simplifies the thermal diffusion as a instantaneous process to increase the model efficiency. The temperature inside the Tungsten sample is consistent with the temperature on surface of Tungsten sample. The temperatures is 300 K during implantation, and the temperature after implantation on the upstream and downstream sides are defined as:
(10)
where K and K are the lowest and highest temperatures, is the heating rate.
The objective of this simulation is to determine the desorption flux on the sample. This case only considers the flux on upstream side due to the marginally filled sample during implantation. The simulation results match the experimental data published in Hino et al. (1998) and reproduced in Figure 2.
Case and Model Parameters
All the model parameters are listed in Table 1:
Table 1: Values of material properties. Note that parameters marked with * are currently not used in the input file.
| Parameter | Description | Value | Units | Reference |
|---|---|---|---|---|
| Boltzmann constant | 1.380649 | J/K | PhysicalConstants.h | |
| implantation flux | 1 | at/m/s | Hino et al. (1998) | |
| maximum diffusivity coefficient when m | 4.1 | m/2 | Frauenfelder (1969) | |
| maximum diffusivity coefficient when m | 4.1 | m/2 | Ambrosek and Longhurst (2008) | |
| activity energy for diffusion | 0.39 | eV | Frauenfelder (1969) | |
| initial concentration of tritium | 1 | at/m | Ambrosek and Longhurst (2008) | |
| host density | 6.25 | at/m | Ambrosek and Longhurst (2008) | |
| initial atom fraction in trap 1 | 0 | - | Ambrosek and Longhurst (2008) | |
| initial atom fraction in trap 2 | 4.4 | - | Ambrosek and Longhurst (2008) | |
| initial atom fraction in trap 3 | 1.4 | - | Ambrosek and Longhurst (2008) | |
| trapping energy for three traps | 0.39 / k_b | K | Ambrosek and Longhurst (2008) | |
| release energy for trap 1 | 1.20 / k_b | K | Ambrosek and Longhurst (2008) and Haasz et al. (1999) | |
| release energy for trap 2 | 1.60 / k_b | K | Ambrosek and Longhurst (2008) and Anderl et al. (1992) | |
| release energy for trap 3 | 3.10 / k_b | K | Ambrosek and Longhurst (2008) and Frauenfelder (1969) | |
| maximum atom fraction in trap 1 | 0.002156 | - | Ambrosek and Longhurst (2008) | |
| maximum atom fraction in trap 2 | 0.00175 | - | Adjusted from Ambrosek and Longhurst (2008) | |
| maximum atom fraction in trap 3 | 0.00200 | - | Ambrosek and Longhurst (2008) | |
| pre-factor of trapping rate coefficient | 9.1316 | 1/s | Ambrosek and Longhurst (2008) | |
| pre-factor of release rate coefficient | 8.4 | 1/s | Ambrosek and Longhurst (2008) | |
| * area of Tungsten sample | 0.0025 | m | Hino et al. (1998) | |
| thickness of Tungsten sample | 1 | m | Hino et al. (1998) | |
| lowest temperature | 300 | K | Hino et al. (1998) | |
| highest temperature | 1273 | K | Hino et al. (1998) | |
| heating rate | 50 | K/min | Hino et al. (1998) |
TMAP7 (Ambrosek and Longhurst (2008)) adjusts the maximum atom fraction as 0.0041 in trap 2 from Anderl et al. (1992) to better correspond to experimental results. Thus, we also adjust it to 0.00175 to correspond to experimental results from Hino et al. (1998).
Results
In this case, there is a general background drift on desorption flux due to an increasing source of atoms going into the gas phase as the heated region spread with time. Thus, we add a ramped signal peaking at 4.87 H/m/s to the results of the TMAP8 during the thermal desorption. Figure 2 shows the comparison of the TMAP8 calculation and the experimental data. There is reasonable agreement between the TMAP predictions and the experimental data with the root mean square percentage error of RMSPE = 32.81 %. Note that the agreement could be improved by adjusting the model parameters and adding more potential traps. TMAP7 is limited to three traps, but TMAP8 can introduce an arbitrarily number of trapping populations. It is also possible to perform this optimization with MOOSE's stochastic tools module.
There are several reasons for the no exact fit with the data from Hino et al. (1998): the most prominent one is the two-dimensionality of the experiment arising from beam non-uniformity and radial diffusion (Anderl et al., 1992). The actual trap energies are probably a little lower than the ones indicated above if the time lag caused by two-dimensionality is significant. Exchange of hydrogen with chamber surfaces, particularly the sample support structure, may also be a factor.
One reason the measured signal falls off after 6300 s while the computed one remains steady is that the source of additional atoms in the experiment may be an expanding area that grow non-linearly, while the sample is being heated but stopped growing and thus stops emitting when the heating stops.
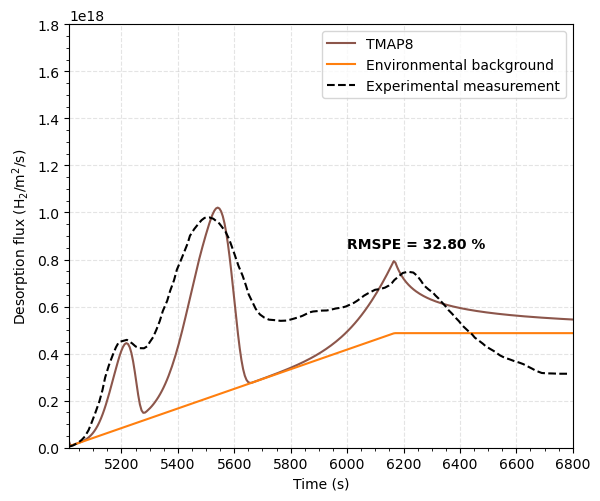
Figure 2: Comparison of TMAP8 calculation with the experimental data on the upstream side of the sample.
Input files
The input file for this case can be found at (test/tests/val-2d/val-2d.i). The input file is different from the input file used as test in TMAP8. To limit the computational costs of the test case, the test runs a version of the file with a coarser mesh and fewer time steps. More information about the changes can be found in the test specification file for this case, namely (test/tests/val-2d/tests).
References
- James Ambrosek and GR Longhurst.
Verification and Validation of TMAP7.
Technical Report INEEL/EXT-04-01657, Idaho National Engineering and Environmental Laboratory, December 2008.[BibTeX]
- RA Anderl, DF Holland, GR Longhurst, RJ Pawelko, CL Trybus, and CH Sellers.
Deuterium transport and trapping in polycrystalline tungsten.
Fusion Technology, 21(2P2):745–752, 1992.[BibTeX]
- JP Biersack and JF Ziegler.
The stopping and range of ions in solids.
In Ion Implantation Techniques: Lectures given at the Ion Implantation School in Connection with Fourth International Conference on Ion Implantation: Equipment and Techniques Berchtesgaden, Fed. Rep. of Germany, September 13–15, 1982, 122–156. Springer, 1982.[BibTeX]
- Wolfgang Eckstein.
Computer simulation of ion-solid interactions.
Volume 10.
Springer Science & Business Media, 2013.[BibTeX]
- R Frauenfelder.
Solution and diffusion of hydrogen in tungsten.
Journal of Vacuum Science and Technology, 6(3):388–397, 1969.[BibTeX]
- AA Haasz, M Poon, and JW Davis.
The effect of ion damage on deuterium trapping in tungsten.
Journal of Nuclear Materials, 266:520–525, 1999.[BibTeX]
- Tomoaki Hino, Kazunori Koyama, Yuji Yamauchi, and Yuko Hirohata.
Hydrogen retention properties of polycrystalline tungsten and helium irradiated tungsten.
Fusion engineering and design, 39:227–233, 1998.[BibTeX]