val-2b
Diffusion Experiment in Beryllium
Test Description
This validation problem is taken from Macaulay-Newcombe et al. (1991) and is part of the validation suite of TMAP4 and TMAP7 (Longhurst et al., 1992; Ambrosek and Longhurst, 2008), which we reproduce here, with some updates. This case has also been updated and extended in Simon et al. (2025).
R.G. Macaulay-Newcombe et al. conducted thermal absorption and desorption experiments, as well as implantation experiments, on wafers of polished beryllium (Macaulay-Newcombe et al., 1991). Of the several data sets presented, the one modeled here is titled "run 2a1" and is represented in Figure 2(a) in their publication (Macaulay-Newcombe et al., 1991). The beryllium sample was 0.4 mm thick and had an area of 104 mm, as illustrated in Figure 1. It was polished to a mirror finish and then exposed to 13.3 kPa of deuterium at 773 K for 50 hours. It was quickly cooled under a vacuum of about 1 Pa. The cooling time constant for the apparatus is taken as 45 minutes, which is consistent with the assumption made in (Longhurst et al., 1992; Ambrosek and Longhurst, 2008). After removing the sample from the charging furnace, it was transferred in the air to a thermal desorption furnace where the temperature was increased from ambient (300 K) to 1073 K at the rate of 3 K/min. This was done under vacuum, and the pressure of the chamber was monitored by the residual gas analysis and calibrated against standard leaks. In that way, the emission rate from the sample could be measured as a function of temperature. The sample pressure and temperature histories are shown in Figure 2. Experimental data from that measurement, given in Figure 2 (a) in Macaulay-Newcombe et al. (1991) are reproduced in Figure 3.
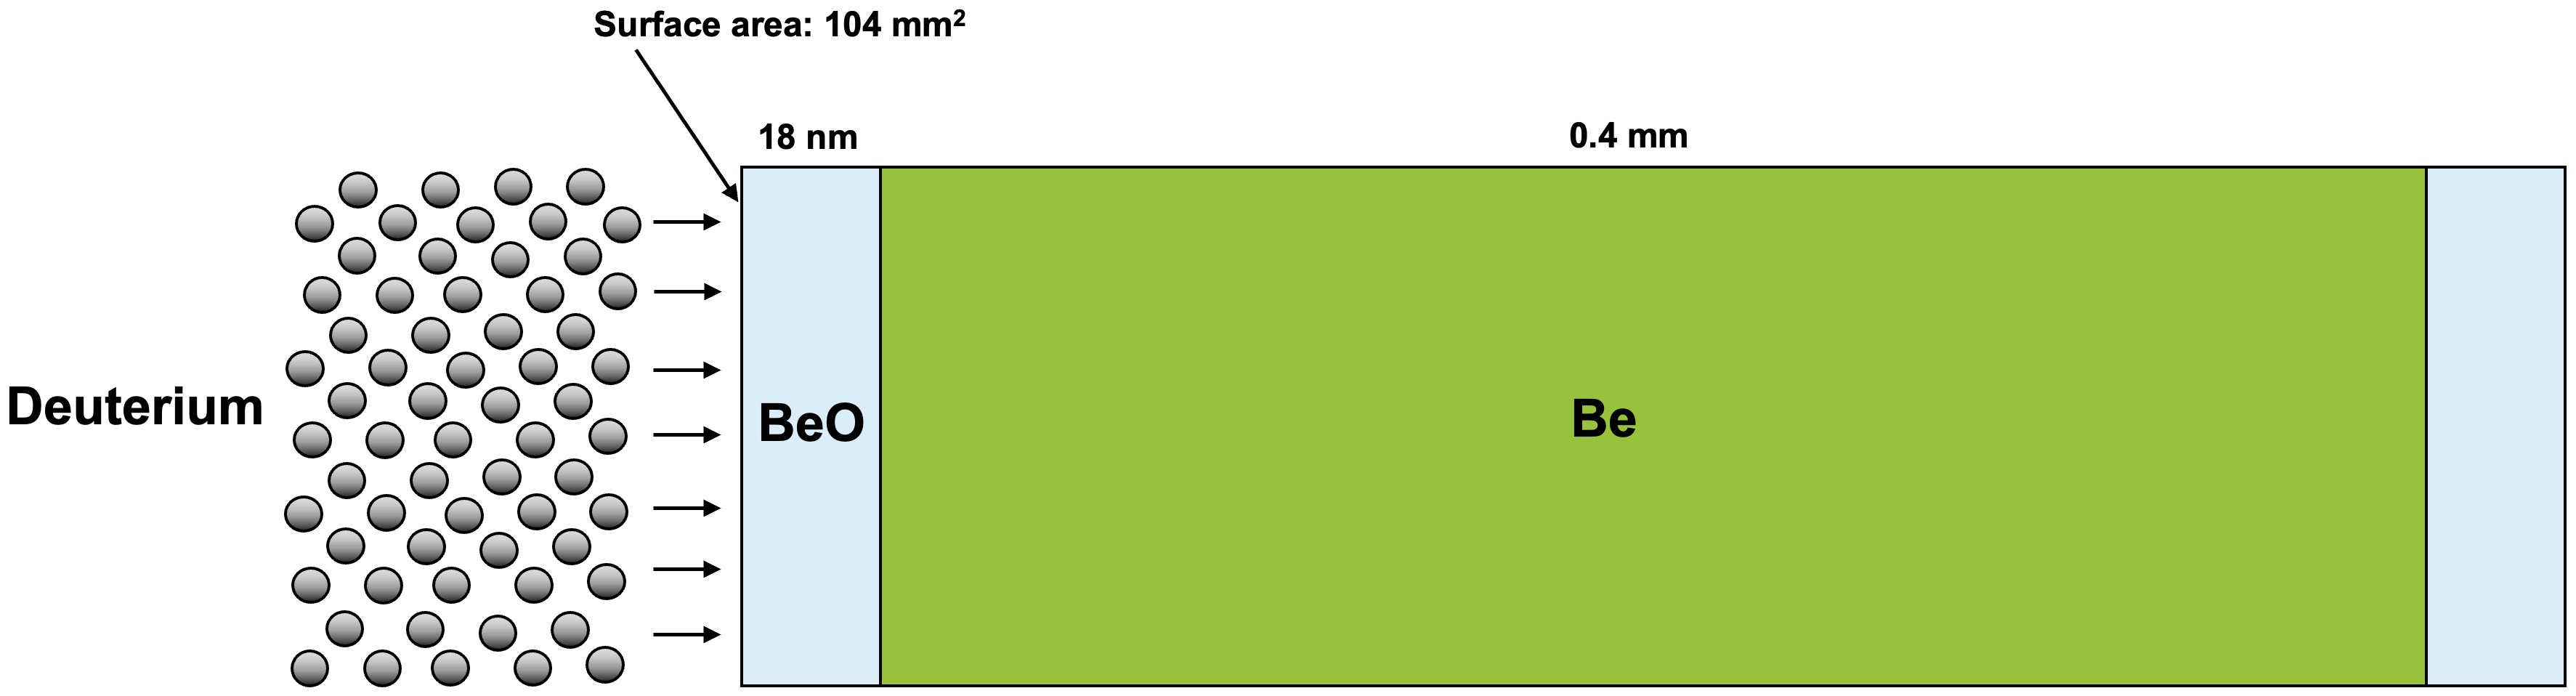
Figure 1: Schematic of the experiment setup (figure elements are not to scale).
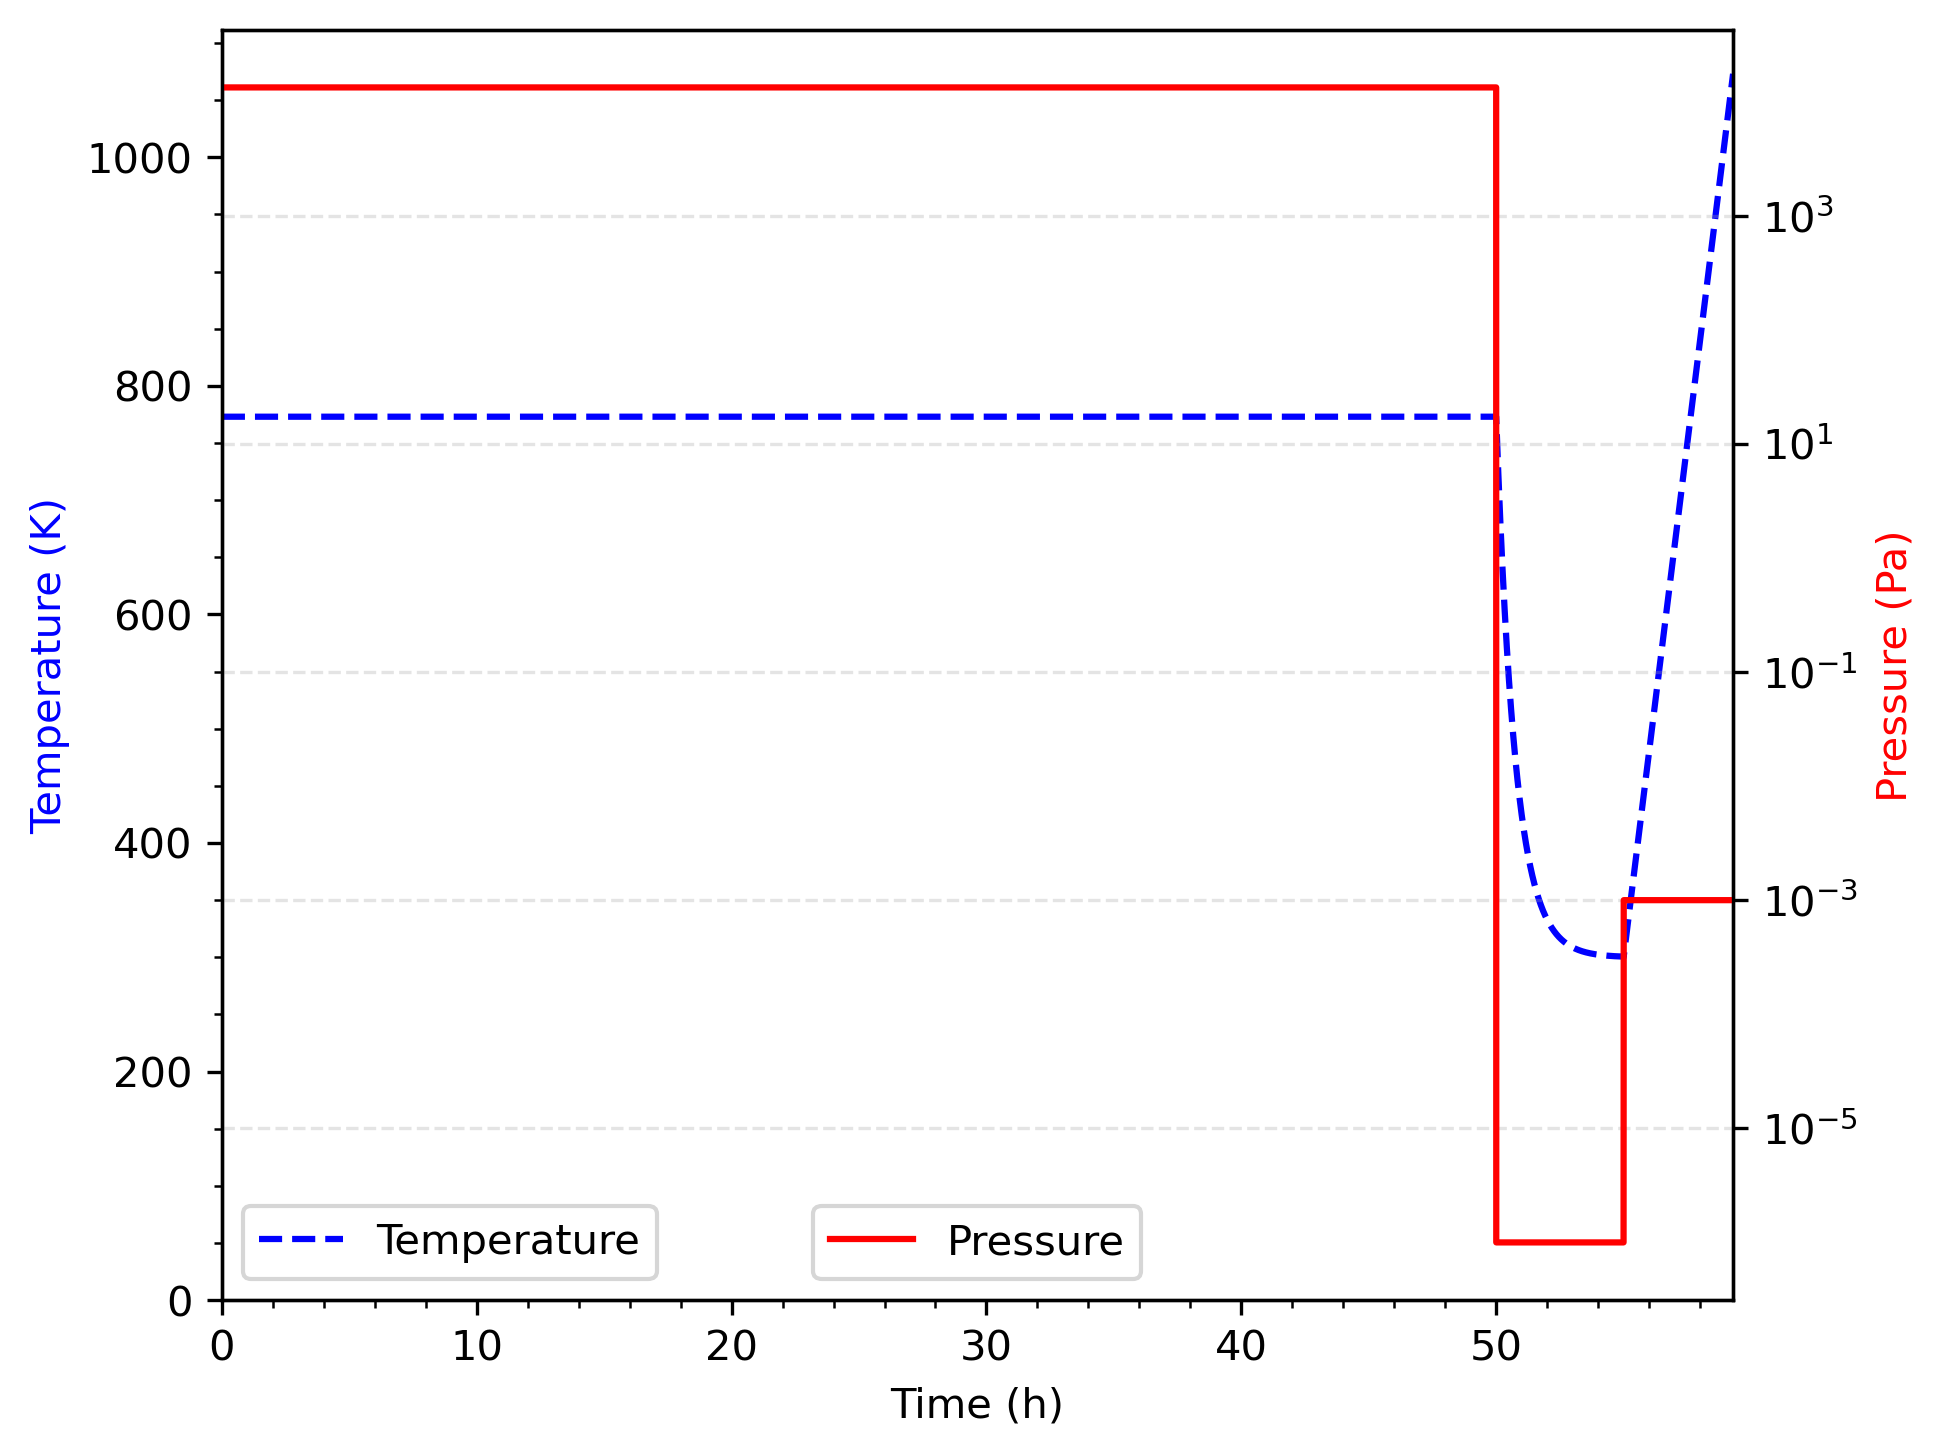
Figure 2: Pressure and temperature histories.
The exact duration of the cooldown period and its temperature history are uncertain. Macaulay-Newcombe et al. (1991) provides information about 24 hour-cooldown cycles, but it is unclear whether this applies to the charging chamber alone or to the sample as well. In parallel, (Longhurst et al., 1992; Ambrosek and Longhurst, 2008) assume that the cooldown lasted for 40 minutes. With an assumed cooling time constant for the apparatus of 45 minutes, this did not enable the sample to cool down to the starting temperature of the desorption phase of the experiment (i.e., 300 K). To model this case in TMAP8, we decided to select a cooldown duration that is long enough to bring the temperature of the sample to around 300 K, but did not unnecessarily increase the length of the history since no significant changes happen to the deuterium distribution at 300 K due to slow kinetics. For these reasons, we selected a cooldown duration of 5 hours, as shown in Figure 2.
From Rutherford backscattering measurements made on the samples before charging with deuterium, they deduced that the thickness of the oxide film was 18 nm. This is typical for polished beryllium. The metal is so reactive in air that the film forms almost immediately after any surface oxide removal. On the other hand, it is relatively stable and would only grow slightly when exposed to air between charging and thermal desorption.
This experiment is modeled using a two-segment model in TMAP8 with the segments linked. The first segment is the BeO film which is modeled using 18 elements, each 1 nm in length. The second segment is the beryllium with reflective boundary condition at the mid-plane. The beryllium segment is modeled using 40 elements, each 50 m thick. The solubility of deuterium in beryllium used was that given by Wilson et al. (1990) at Sandia National Laboratory (SNL) based on the work done by W. A. Swansiger, also of SNL.
The diffusivity of deuterium in beryllium was measured by Abramov et al. (1990). They made measurements on high-grade (99 pure) and extra-grade (99.8 pure). The values used here are those for high-grade beryllium, consistent with Dr. Macaulay-Newcombe's measurements of the purity of his samples.
Deuterium transport properties of the BeO are more challenging. First, it is not clear in which state the deuterium exists in the BeO. However, it has been observed Longhurst (1990) that an activation energy of -78 kJ/mol (exothermic solution) is evident for tritium coming out of neutron-irradiated beryllium in work done by D. L. Baldwin of Pacific Northwest Laboratory. The same value of energy has appeared in other results. It can be inferred from Dr. Swansiger's work cited by Wilson et al. (1990) and by Causey et al. (1990), among others, so one may be justified in using it. Concerning the solubility, measurements reported by Macaulay-Newcombe et al. (1992) and in follow-up conversations indicate about 200 appm of D in BeO after exposure to 13.3 kPa of D at 773 K. That suggests a coefficient of only 1.88 10 d/mPa. Since much of the deuterium in the oxide layer will get out during the cool-down process (and because it gives a good fit), the solubility coefficient is taken to be 5 10 d/mPa.
Deuterium diffusion measurements in BeO were made by Fowler et al. (1977). They found a wide range of results for diffusivity in BeO depending on the physical form of the material, having measured it for single-crystal, sintered, and powdered BeO. The model in (Longhurst et al., 1992; Ambrosek and Longhurst, 2008) uses one expression for the charging phase and another for the thermal desorption phase, believing that the surface film changed somewhat during the transfer between the two furnaces. For the charging phase diffusivity, the model uses 20 times that for the sintered BeO. Thermal expansion mismatches tend to open up cracks and channels in the oxide layer, so this seems a reasonable value. The same activation energy of 48.5 kJ/mol, is retained, however. For the thermal desorption phase, the diffusivity prefactor of the sintered material (7x10 m/sec) and an activation energy of 223.7 kJ/mol (53.45 kcal/mol) are used. These values give results lying well within the scatter of Fowler's data. Exposure of the sample to air after heating should have made the oxide more like a single crystal by healing the cracks that may have developed. Diffusivities and solubilities used in the simulation are listed in Table 1.
Table 1: Model parameter values for the charging and the desorption phases (Longhurst et al., 1992; Ambrosek and Longhurst, 2008). is the temperature in Kelvin.
| Property of deuterium | Value for charging phase | Value for desorption phase | Units |
|---|---|---|---|
| Diffusivity in Be | m/s | ||
| Diffusivity in BeO | m/s | ||
| Solubility in Be | at/m/Pa | ||
| Solubility in BeO | at/m/Pa |
The model applies 13.3 kPa of D for 50 hours and 15 seconds followed by cool down with a 45 minute time constant at 1 Pa for five hour (Longhurst et al. (1992) and Ambrosek and Longhurst (2008) used 40 minutes, but we extend it here to 5 hours to let the temperature go down closer to 300 K - see Figure 2). The deuterium concentrations in the sample have a complex distribution that results from first charging the sample and then discharging it during the cool down. This problem is then restarted with different model parameters (see Table 1) to simulate thermal desorption in a Pa environment that begins at 300 K and goes to 1073 K at 3 K/min.
Results
Figure 3 shows the comparison of the TMAP8 calculation and the experimental data during desorption. There is reasonable agreement between the TMAP predictions and the experimental data with a root mean square percentage error of RMSPE = 22.72 %. Note that the agreement could be improved by adjusting the model parameters. It is also possible to perform this optimization with MOOSE's stochastic tools module.
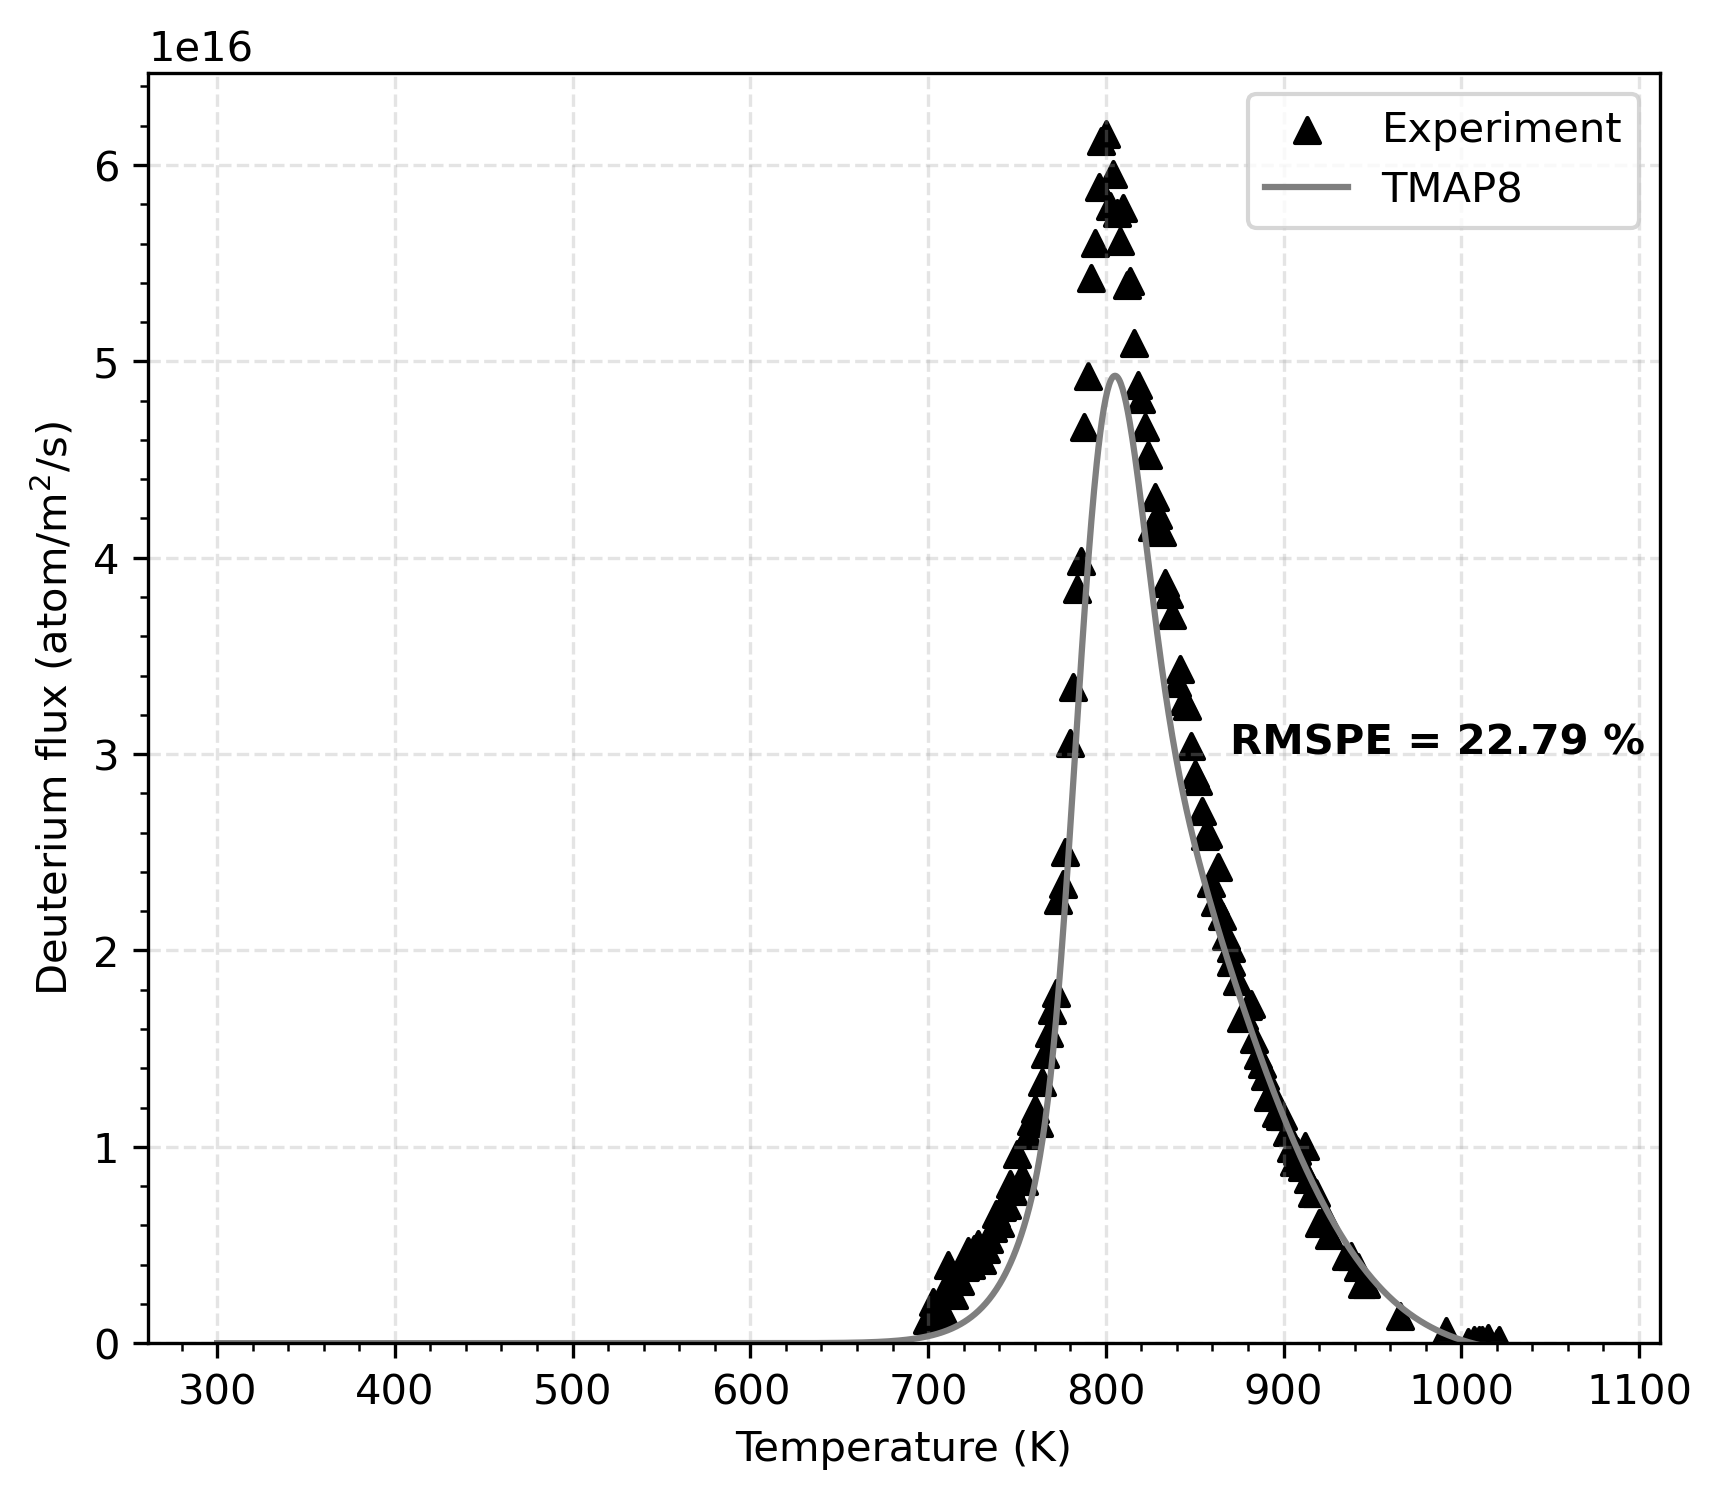
Figure 3: Comparison of TMAP8 calculation against experimental data, which shows TMAP8's ability to accurately model this validation case.
The experimental data used in this case comes directly from Figure (2) in Macaulay-Newcombe et al. (1991). This is in contrast with the data used in Longhurst et al. (1992) and Ambrosek and Longhurst (2008), which, although the scale of the data is very similar, differs slightly. Also, note that the units in Figure (2) from Macaulay-Newcombe et al. (1991) should be atoms/mm/s instead of atoms/mm , which is corrected in Figure 3.
To verify that the solubility ratio at the interface between the beryllium and its oxide is appropriately modeled, Figure 4 compares the known solubility ratio with the calculated deuterium concentration ratio at the interface, and they match, as expected.
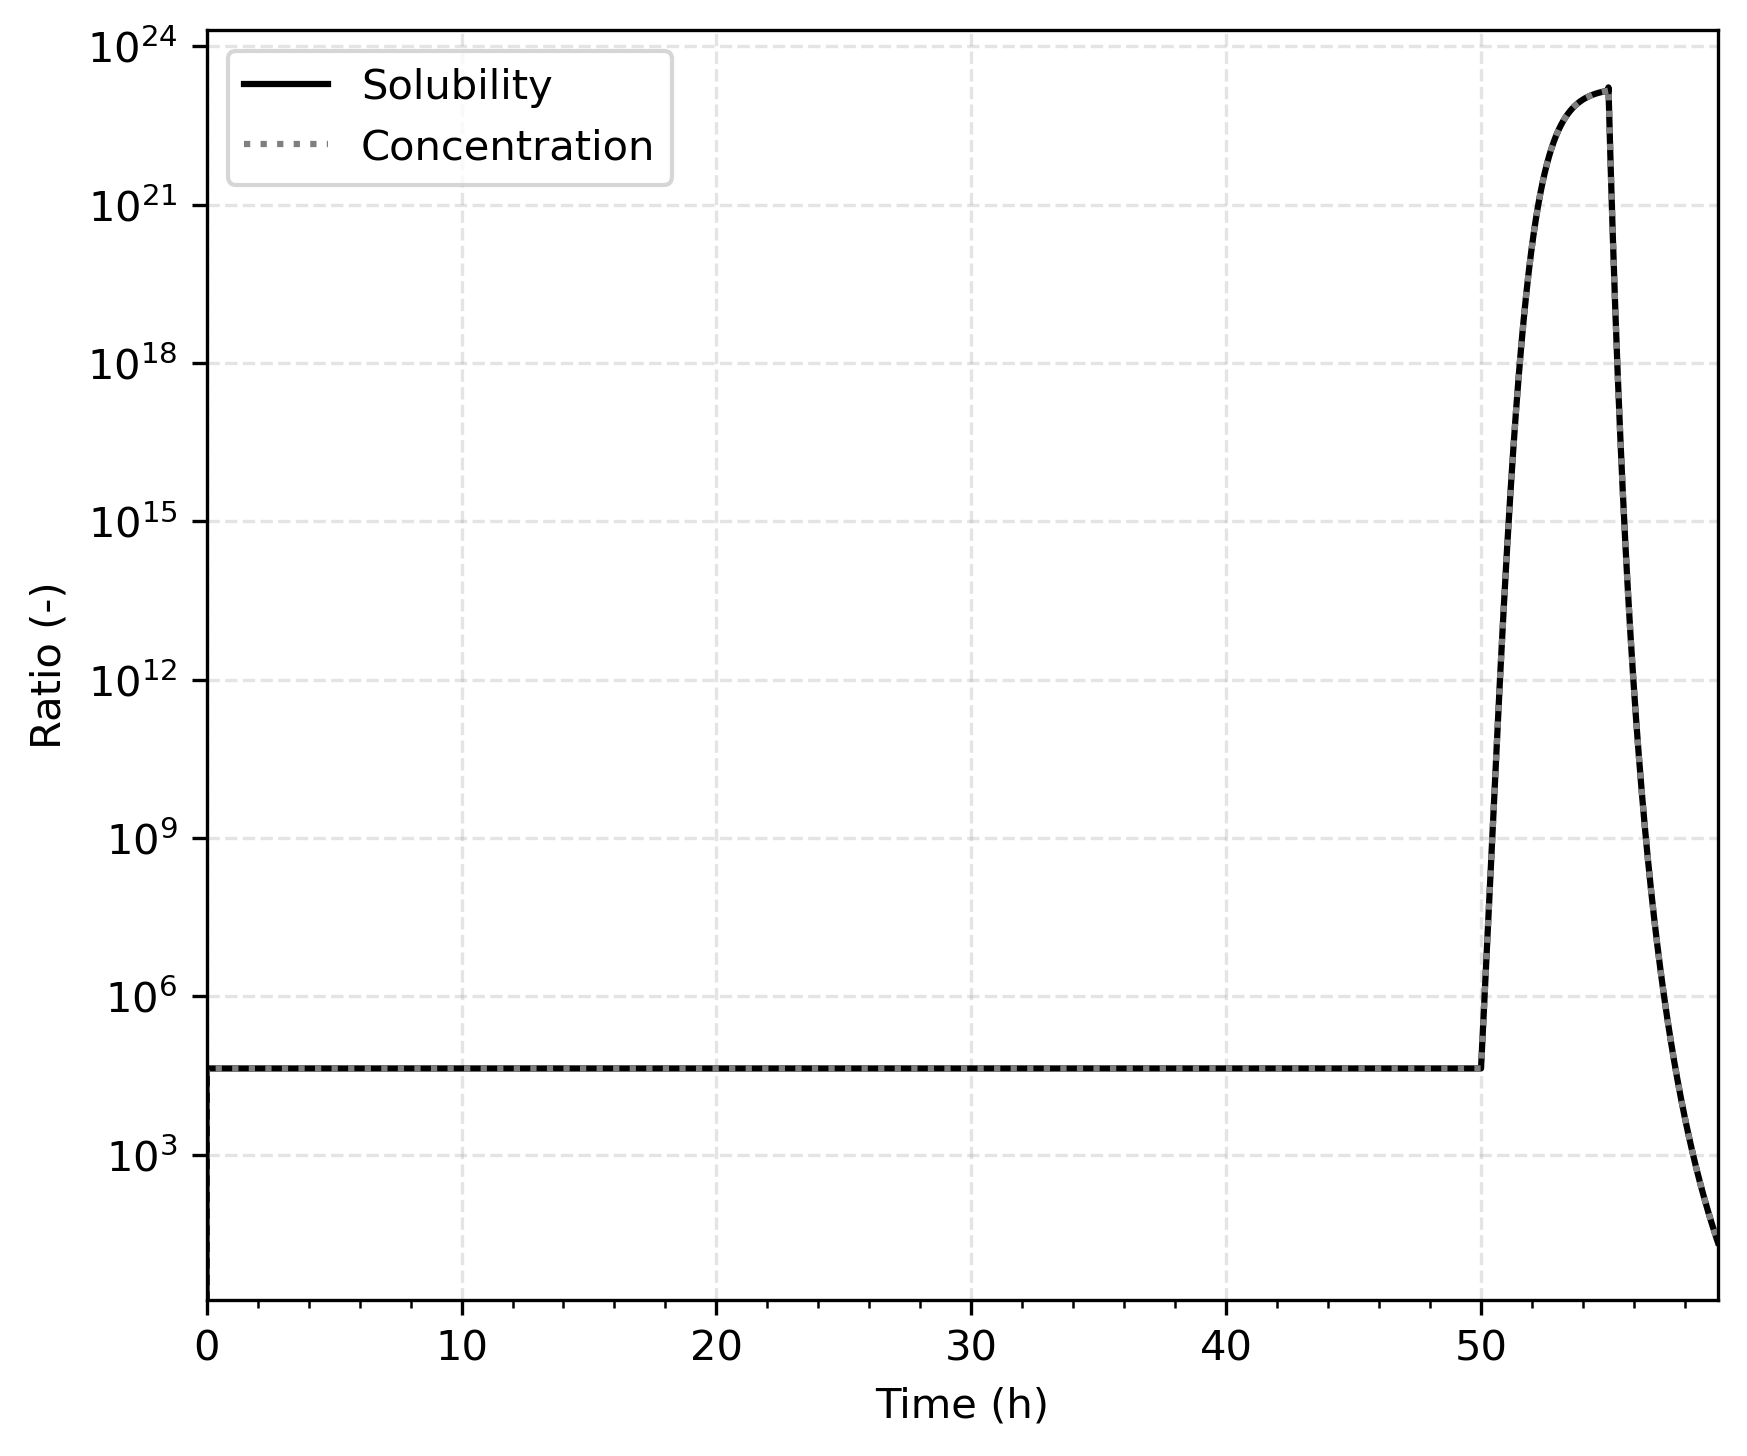
Figure 4: Solubility and concentration ratio at the Be-BeO interface. The match shows that the solubility difference is properly enforced in TMAP8.
Input files
The input file for this case can be found at (test/tests/val-2b/val-2b.i). To achieve short regression tests (under 2 seconds walltime), the tests in (test/tests/val-2b/tests) run a version of the files with a shorter history, looser tolerance, and larger time step. More information about the changes can be found in the test specification file for this case, namely (test/tests/ver-1d/tests).
In TMAP4 and TMAP7, this case was divided in two simulations to accommodate the different model parameters used during charging and desorption (see Table 1 ) (Longhurst et al., 1992; Ambrosek and Longhurst, 2008). In TMAP8, the full history is modeled in one simulation using (test/tests/val-2b/val-2b.i).
References
- E Abramov, MP Riehm, DA Thompson, and WW Smeltzer.
Deuterium permeation and diffusion in high-purity beryllium.
Journal of nuclear materials, 175(1-2):90–95, 1990.[BibTeX]
- James Ambrosek and GR Longhurst.
Verification and Validation of TMAP7.
Technical Report INEEL/EXT-04-01657, Idaho National Engineering and Environmental Laboratory, December 2008.[BibTeX]
- RA Causey, WL Hsu, BE Mills, J Ehrenberg, and V Phillips.
Tritium retention and migration in beryllium.
Journal of nuclear materials, 176:654–660, 1990.[BibTeX]
- JD Fowler, Dipankar Chandra, TS Elleman, AW Payne, and Kuruvilla Verghese.
Tritium diffusion in A12O3 and BeO.
Journal of the American Ceramic Society, 60(3-4):155–161, 1977.[BibTeX]
- Glen R Longhurst.
Tritium behavior in ITER beryllium.
Technical Report EGG-FSP-9304, Idaho National Engineering Laboratory, Idaho Falls, ID (USA), 1990.[BibTeX]
- GR Longhurst, SL Harms, ES Marwil, and BG Miller.
Verification and Validation of TMAP4.
Technical Report EGG-FSP-10347, Idaho National Engineering Laboratory, Idaho Falls, ID (United States), 1992.[BibTeX]
- RG Macaulay-Newcombe, DA Thompson, and WW Smeltzer.
Deuterium diffusion, trapping and release in ion-implanted beryllium.
Fusion Engineering and Design, 18:419–424, 1991.[BibTeX]
- RG Macaulay-Newcombe, DA Thompson, and WW Smeltzer.
Thermal absorption and desorption of deuterium in beryllium and beryllium oxide.
Journal of nuclear materials, 191:263–267, 1992.[BibTeX]
- Pierre-Clément A. Simon, Casey T. Icenhour, Gyanender Singh, Alexander D Lindsay, Chaitanya Vivek Bhave, Lin Yang, Adriaan Anthony Riet, Yifeng Che, Paul Humrickhouse, Masashi Shimada, and Pattrick Calderoni.
MOOSE-based tritium migration analysis program, version 8 (TMAP8) for advanced open-source tritium transport and fuel cycle modeling.
Fusion Engineering and Design, 214:114874, May 2025.
doi:10.1016/j.fusengdes.2025.114874.[BibTeX]
- KL Wilson, RA Causey, WL Hsu, BE Mills, MF Smith, and JB Whitley.
Beryllium—a better tokamak plasma-facing material?
Journal of Vacuum Science & Technology A: Vacuum, Surfaces, and Films, 8(3):1750–1759, 1990.[BibTeX]