Advanced Burner Test Reactor (ABTR)
Contact: Rui Hu, rhu.at.anl.gov
Model link: ABTR Model
ABTR description
A demonstrative system model based on the Advanced Burner Test Reactor (ABTR) conceptual design has been developed with the recent SAM capability enhancement in structure thermal expansion and reactivity feedback modeling. More details can be found in (Hu et al., 2019) regarding the implementation of Point Kinetics model and verifications of thermal expansion models.
The detailed design parameters of the 250 MW pool type design ABTR can be found in (Chang et al., 2008). The primary system is configured in a pool-type arrangement, with the reactor core, primary pumps, intermediate heat exchangers, and direct reactor auxiliary cooling system heat exchangers all immersed in a pool of sodium coolant within the reactor vessel. The reactor core consists of 24 assemblies in an inner enrichment zone and 30 assemblies in the outer zone. A total of nine test locations are provided for fuel (6 assemblies) and material (3 assemblies) tests. On the basis of the reactor physics calculations, a five-channel model was selected to model the reactor core. Channel 1 is used to represent the peak-power inner-core subassembly with fresh fuel. Channels 2 and 4 represent the average subassemblies in the inner and outer enrichment zones respectively, while channel 3 represents the average of the mid-core fuel test assemblies. Channel 5 represents all of the non-fuel subassemblies, including the mid-core materials test assemblies. Figure 1 shows the initial subassembly powers at the beginning of equilibrium cycle conditions, and the average axial power shape for all assemblies. The geometric data and input conditions employed in the multi-channel core model are shown in Table 1.
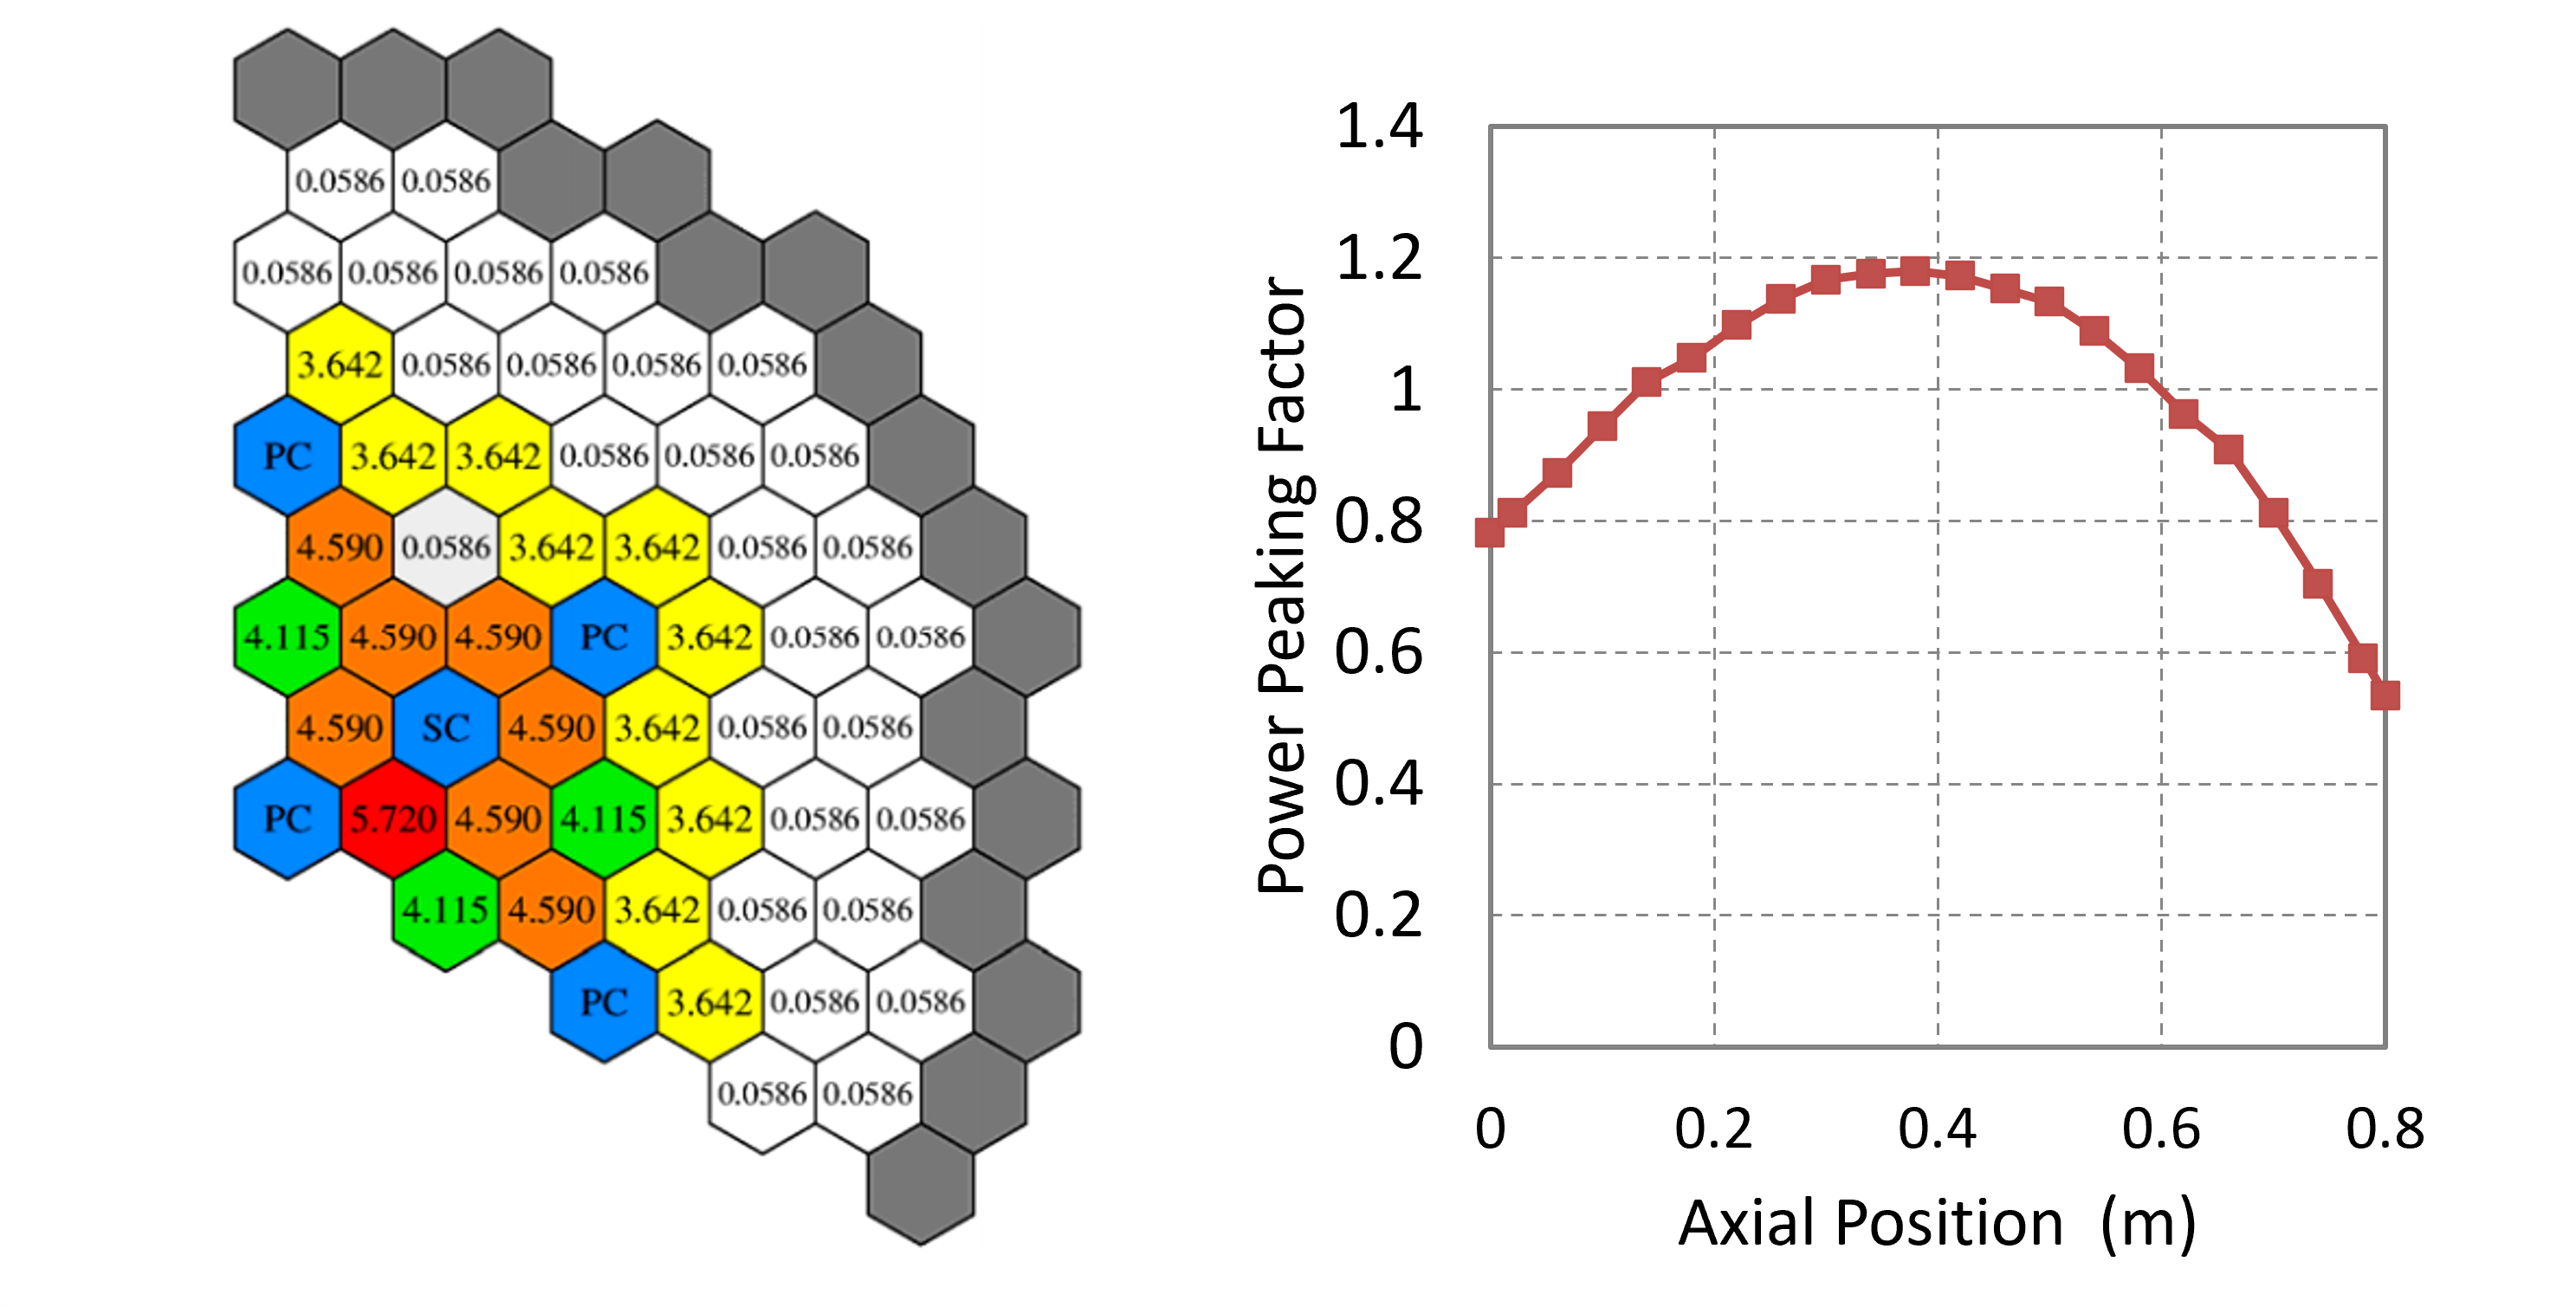
Figure 1: Assembly radial (left) and axial (right) power distribution at BOC.
Table 1: Coolant channel model data.
| Channel 1 | Channel 2 | Channel 3 | Channel 4 | Channel 5 | |
|---|---|---|---|---|---|
| Channel Location | Inner Hot Assembly | Inner Core | Fuel Test | Outer Core | Reflector Channel |
| Assembly number | 1 | 23 | 6 | 30 | 81 |
| Pin number per assembly | 217 | 217 | 217 | 217 | 91 |
| Power per assembly () | 5.62 | 4.56 | 4.105 | 3.59 | 0.0883 |
| Flow Area () | 0.00492 | 0.113 | 0.0295 | 0.148 | 0.154 |
| Hydraulic Diameter () | 2.972 | 2.972 | 2.972 | 2.972 | 1.694 |
| Channel Height () | 0.8 | 0.8 | 0.8 | 0.8 | 0.8 |
| Fuel pellet radius () | 3.48 | 3.48 | 3.48 | 3.48 | 6.32 |
| Cladding thickness () | 0.52 | 0.52 | 0.52 | 0.52 | 0.70 |
| Inlet Orifice Coefficient | 0.5 | 5.15 | 5.76 | 13.2 | 11100 |
Figure 2 shows the schematics of the ABTR model to be analyzed with SAM. The primary coolant system consists of the Downcomers (pump outlet and pump discharge), the Inlet Plenum, the Reactor Core Model, the Outlet Plenum, and the intermediate heat exchanger. Five CoreChannels (flow channels with heat structure attached to each of them) were used to describe the reactor core. A Time Dependent Volume component is used to represent the cover gas above the outlet plenum. Different components are connected with Branches. The intermediate loop, the secondary loop, and the DRACS loop are modeled with great simplicities. Single-phase counter current heat exchanger models are implemented to mimic the function of the intermediate loop heat exchanger (IHX), DRACS heat exchanger (DHX), and secondary loop heat exchanger (SHX) to transfer heat among the primary, intermediate, secondary, and the DRACS loops. The geometric data of the non-core components employed in the ABTR model are shown in Table 2 and Table 3.
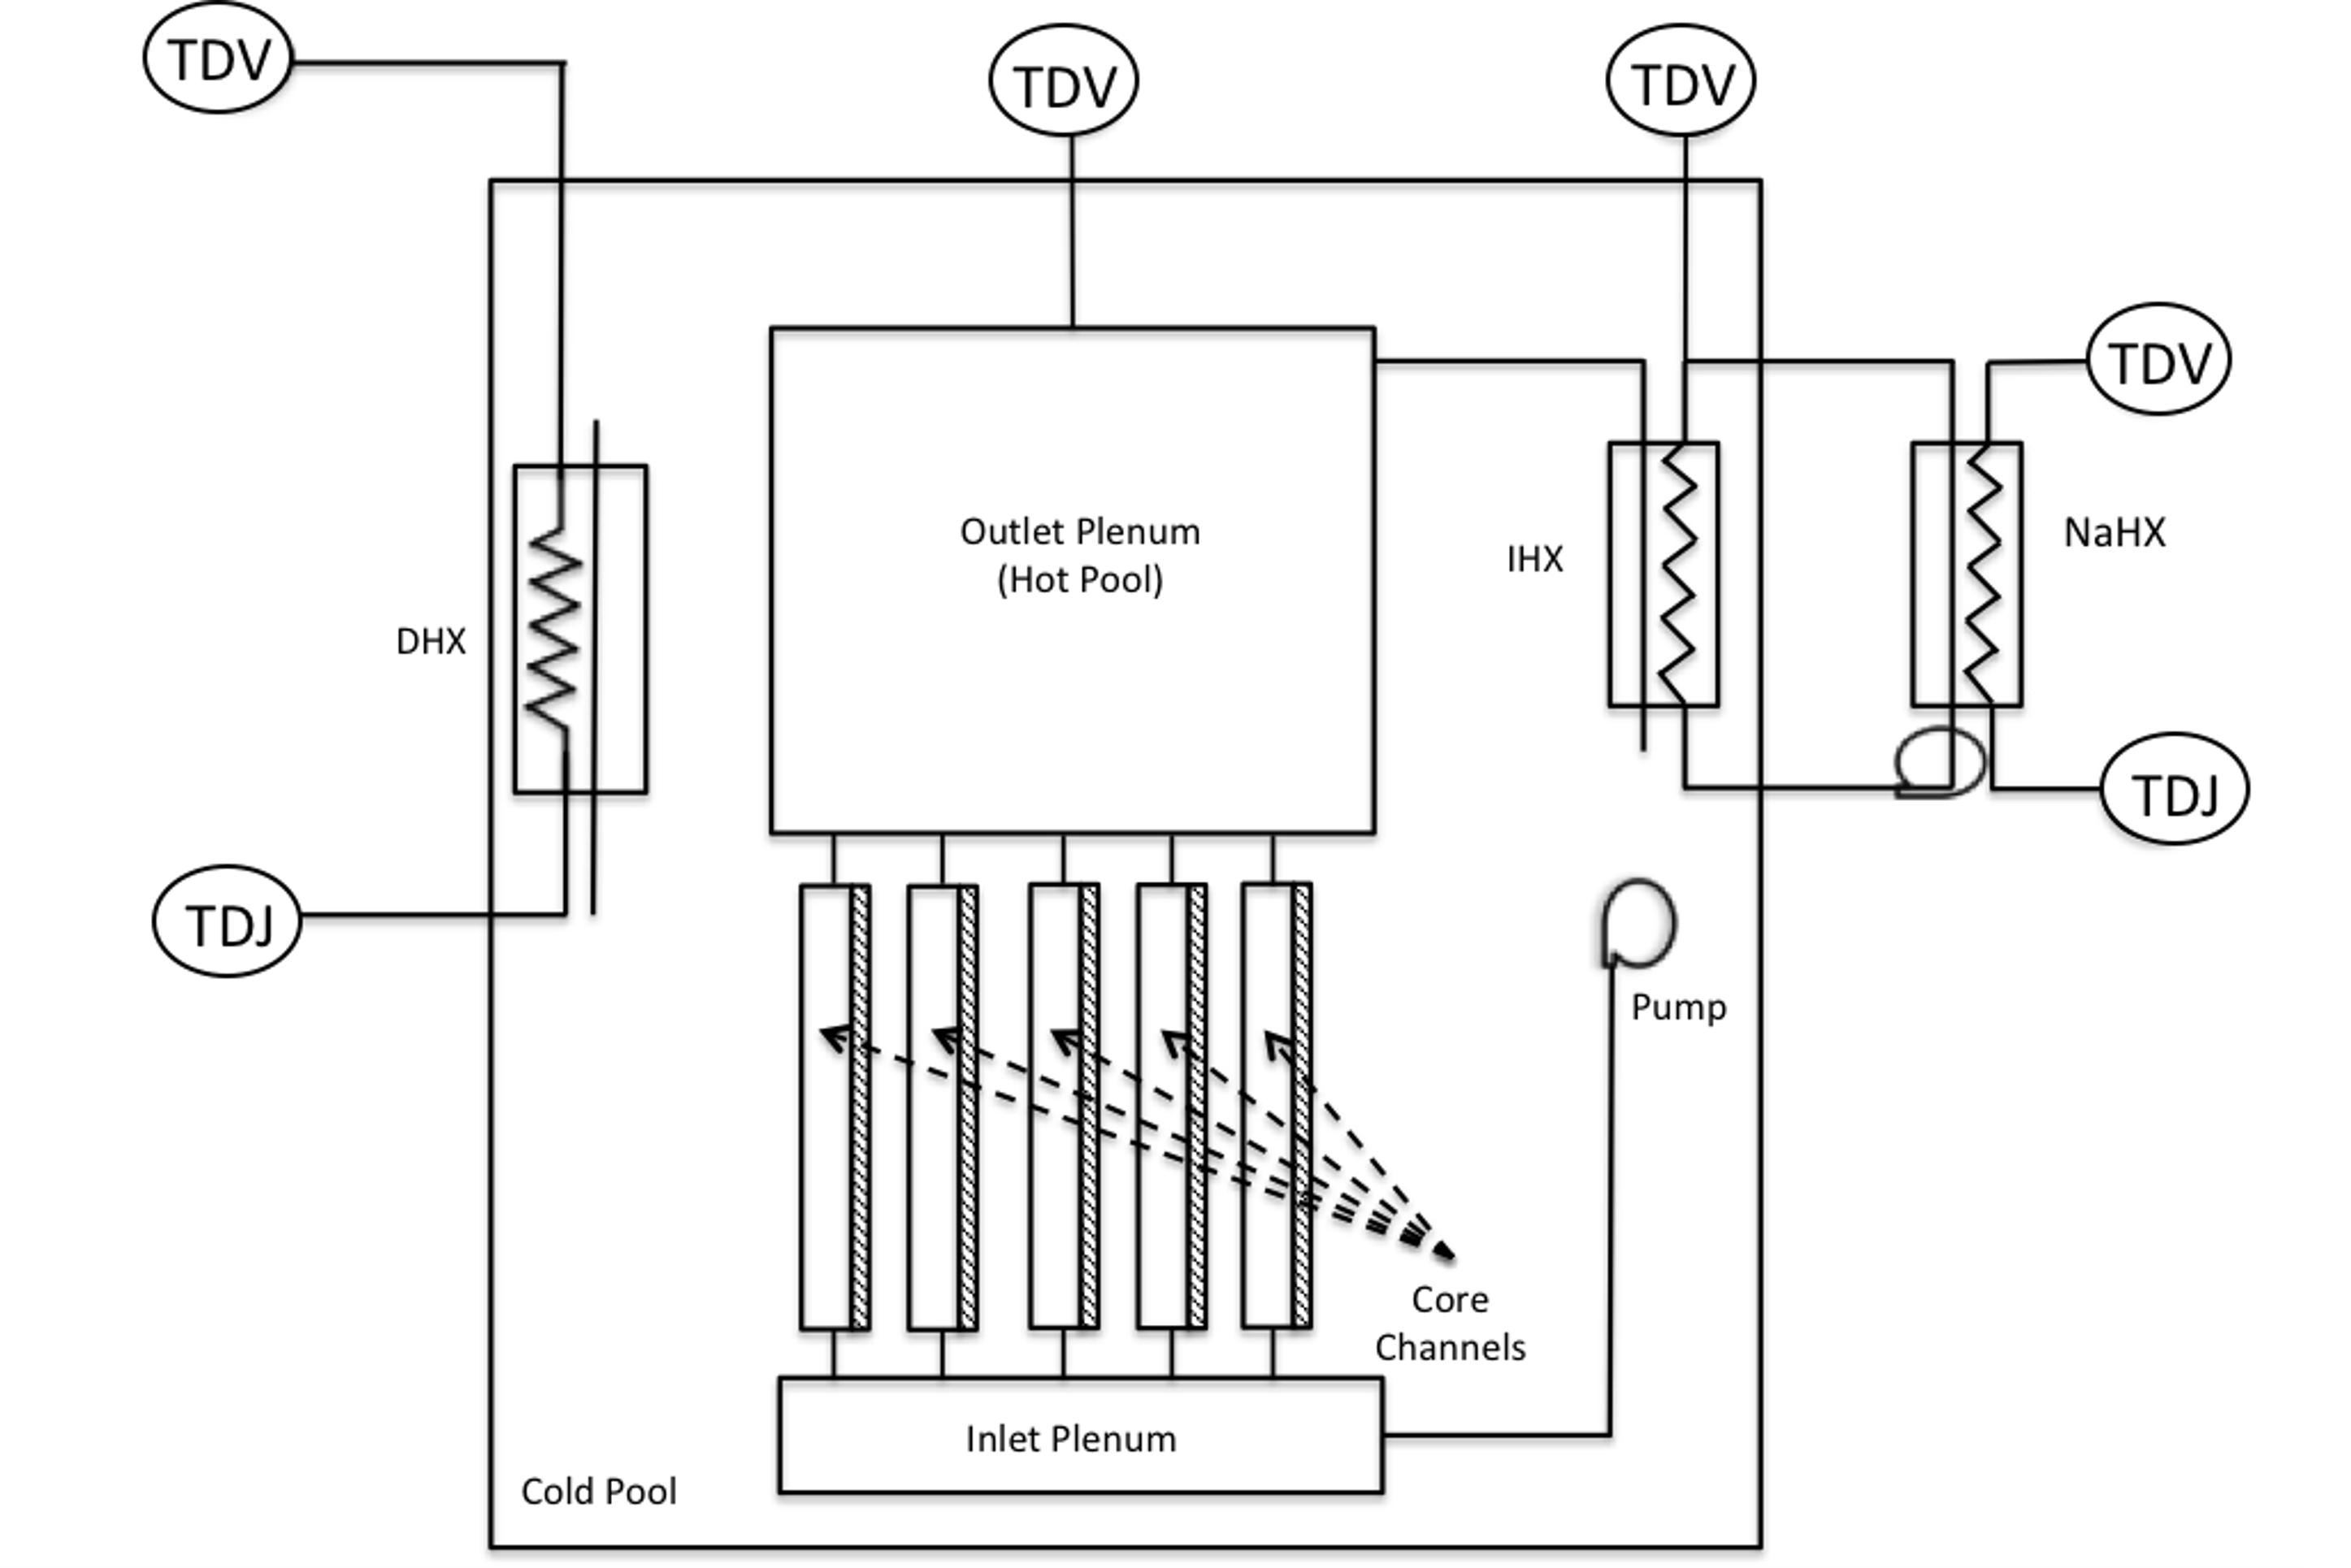
Figure 2: Schematics of the test ABTR model.
Table 2: Geometric input data for major out-of-core 1-D components.
| Component | Component Type | Inlet Elevation () | Flow Area () | Hydraulic Diameter () | Length () |
|---|---|---|---|---|---|
| Lower Unheated Core | PBPipe | -0.6 | 0.6 | ||
| Active Core | PBCoreChannel | 0 | 0.8 | ||
| Upper Unheated Core | PBPipe | 0.8 | 1.5 | ||
| IHX Primary Side | PBHeatExchanger | 5.88 | 0.766 | 0.0186 | 3.71 |
| IHX Secondary Side | PBHeatExchanger | 2.17 | 0.517 | 0.014 | 3.71 |
| Pump Pipe | PBOneDFluidComponent | 3.61 | 0.132 | 0.34 | 4.38 |
| Pump Discharge | PBOneDFluidComponent | -0.77 | 5.36 | 1 | 1.26 |
| SHX Primary Side | PBHeatExchanger | 5.88 | 0.766 | 0.0186 | 3.71 |
| SHX Secondary Side | PBHeatExchanger | 2.17 | 0.517 | 0.014 | 3.71 |
| DHX Primary Side | PBHeatExchanger | 6.04 | 0.024 | 0.037 | 2.35 |
| DHX Secondary Side | PBHeatExchanger | 3.69 | 0.024 | 0.037 | 2.35 |
: channel dependent, see (Chang et al., 2008).
Table 3: Geometric input data for 0-D volume.
| Component | Type | Geometric Center () | Flow Area () | Total Volume () | Ref. Liquid Level () |
|---|---|---|---|---|---|
| Inlet Plenum | PBVolumeBranch | -0.77 | 4.4934 | 3.06 | |
| Outlet Plenum | PBLiquidVolume | 6.45 | 11.16 | 92.51 | 3.59 |
| Cold Pool | PBLiquidVolume | 2.3 | 12.8 | 181.11 | 4.15 |
Modeling of ABTR Unprotected Loss of Flow Accident
The ABTR model described in Section 3.1 is used in the test. An unprotected loss-of-flow (ULOF) accident is selected as the demonstration case. As described in Section 3.1, Channel 1, 2, 3, and 4 represent the majority of the fuel assemblies in the reactor core, thus these channels are used the calculate the fuel axial expansion. The input fuel reactivity coefficients for each individual channel are different and are shown in Figure 3. Note that Channel 1 represent the hot assembly and the reactivity coefficients in Channel 1 are taken as that of Channel 2 only for demonstration purposes. The fuel and the cladding are assumed in eutectic condition in this test. The input core radial expansion reactivity coefficients are -0.86929 for both the lower and upper positions; but the weighting factors are 0.3 and 0.7 for the lower and upper positions, respectively. The weighting factor strongly depends on the radial deformation of the core during the actual transient, which is very hard to predict. Thus, these weighting factors are chosen only for demonstration purposes. The input fuel Doppler reactivity coefficients for each individual channel are shown in Figure 4. The input coolant density reactivity coefficients for each individual channel are shown in Figure 5. The other reactivities, e.g. control rod drive line thermal expansion reactivity, are given as external reactivity in the input file, which is shown in Figure 6. Note that most of the reactivity coefficients are taken from a previous work on ABTR design analysis (Chang et al., 2008).
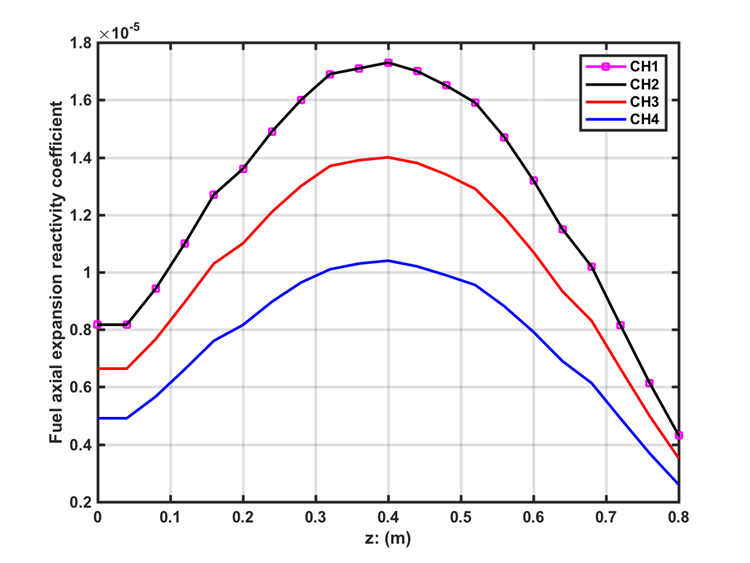
Figure 3: Input ABTR fuel axial expansion reactivity coefficient for 4 channels.
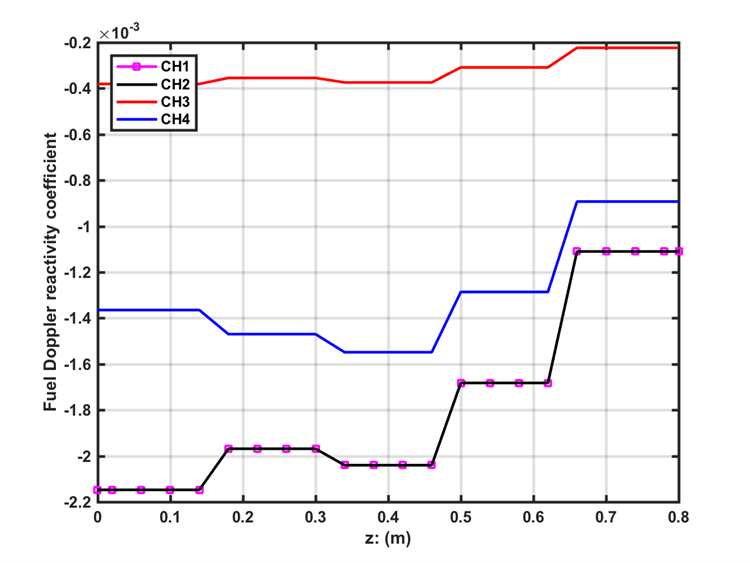
Figure 4: Input ABTR fuel Doppler reactivity coefficient for 4 channels.
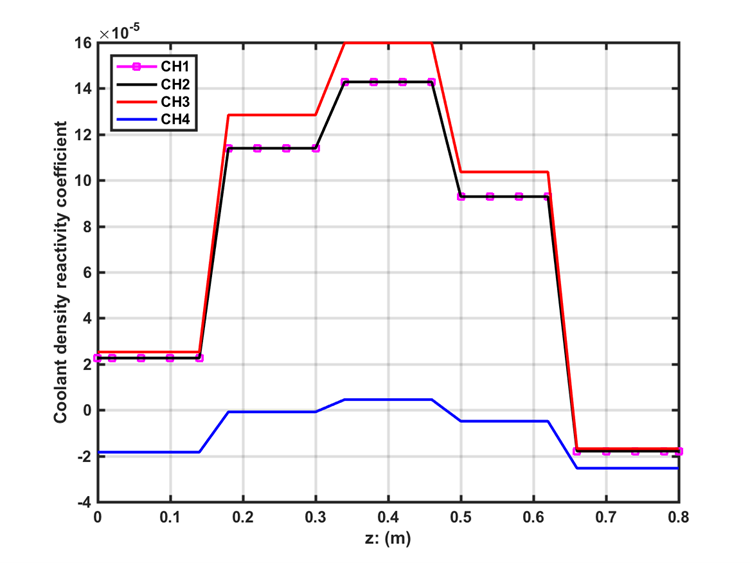
Figure 5: Input ABTR coolant density reactivity coefficient for 4 channels.
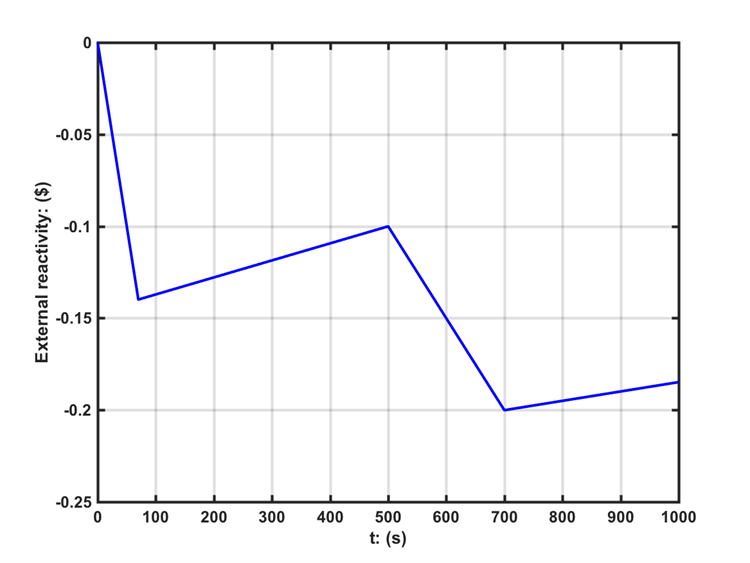
Figure 6: Input ABTR transient external reactivity.
Accident Sequences
The accident sequence analyzed here is the loss of normal power to the reactor and intermediate loss of forced flow in the primary and intermediate coolant circuits. A programmed flow coast down of the coolant pumps is assumed to operate. The pump coast down curve during the transient is shown in Figure 7. In addition, it is assumed that heat removal at the sodium-CO2 heat exchanger ceases, so that the only heat removal path is through the emergency direct reactor auxiliary cooling system (DRACS). The initial condition for the accident sequence is the normal operation at full power and flow. With the loss of pumping power, flow in the primary circuit coasts down according to the programmed pump head decay. The system is running for 500s to reach the normal operation status before the transient simulation starts. Following the pump flow coast down, natural circulation flow is established.
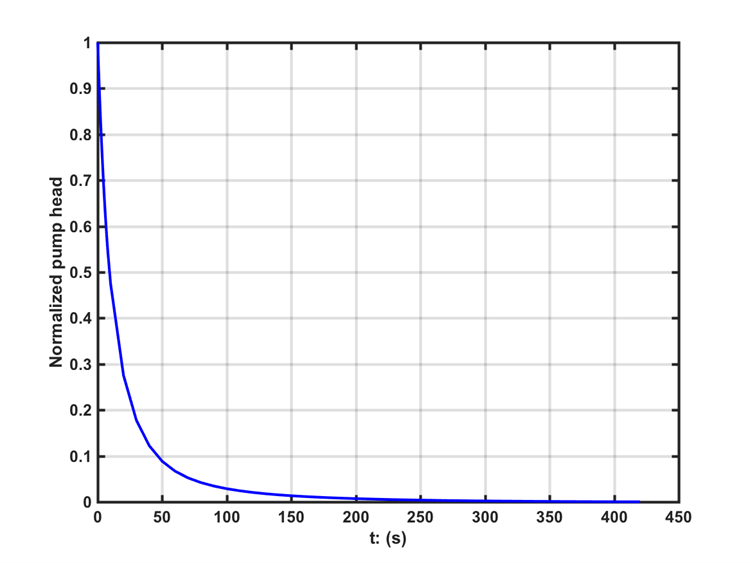
Figure 7: ABTR pump coast down transient.
There are two variations of the loss-of-flow accident sequence. In the first, the reactor safety system acts to insert control rods and reduce reactor power to decay heat. This sequence is called protected loss-of-flow (PLOF) accident. In the second, the reactor safety system fails to insert the scram control rods and the loss of forced flow proceeds at full power. This sequence is called the unprotected loss-of-flow (ULOF) accident. The ULOF accident is used to demonstrate the Point-Kinetics model and the reactivity feedback models.
In the ULOF accident, the reactor power remains at full power initially and is reduced later due to the inherent negative reactivity feedbacks. As the coolant flow rate decreases, reactor temperatures increase within the first minute. During this time, the peak fuel and cladding temperatures rise. This increase in temperatures provides the driving force for establishing the natural circulation flow, which will then reduce the peak fuel and cladding temperatures. The reactor seeks equilibrium with the available heat sink by reducing power. This will reduce the reactor temperature and establish a quasi-equilibrium condition. However, the reactor system will continue to heat slowly until the decay heat falls below the heat rejection capacity of DRACS system. When decay heat production falls below the DRACS capacity, the system temperature starts to decline.
SAM Results
Figure 8 shows the histories for the total reactor power, the heat removal rate from IHTS (IHX) and DRACS (DHX) heat exchangers, and the coolant flow in the hot channel (CH1). Figure 9 shows the transient peak fuel, peak cladding, CH1 coolant outlet, cold pool, and hot pool temperatures. Figure 10 shows the transient radial core expansion, axial fuel expansion, coolant density, and Doppler reactivity feedbacks. The coolant and cladding temperatures increase significantly during the first 30 seconds, which contribute to the negative radial and axial reactivities. The negative radial and axial reactivities are the main factors to bring down the reactor power and fuel temperatures. For this demonstration case, the coolant density and Doppler effect bring in the positive reactivities, but in a smaller magnitude. The flow coast-down by the inertia of the primary pumps ends at approximately 450 seconds when the natural circulation has not yet been fully established. Shortly after this point, the peak fuel, peak cladding, and coolant temperatures begin to rise to form a second temperature peak. The increased temperatures become the driving force to increase the natural circulation flow rate.
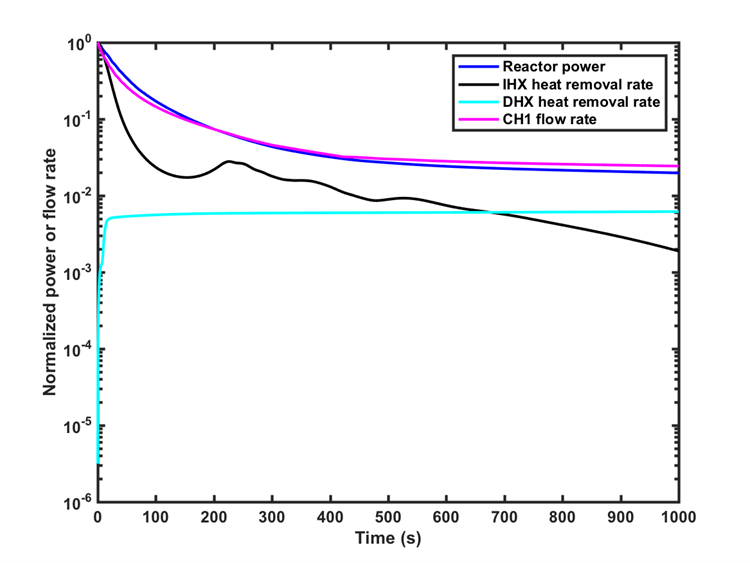
Figure 8: ABTR ULOF transient reactor power, heat removal rate, and flow rate.
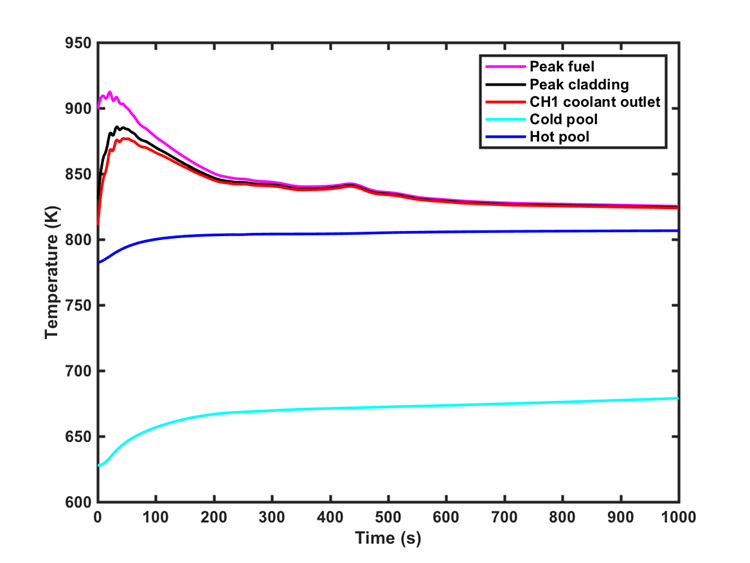
Figure 9: ABTR ULOF transient temperatures.
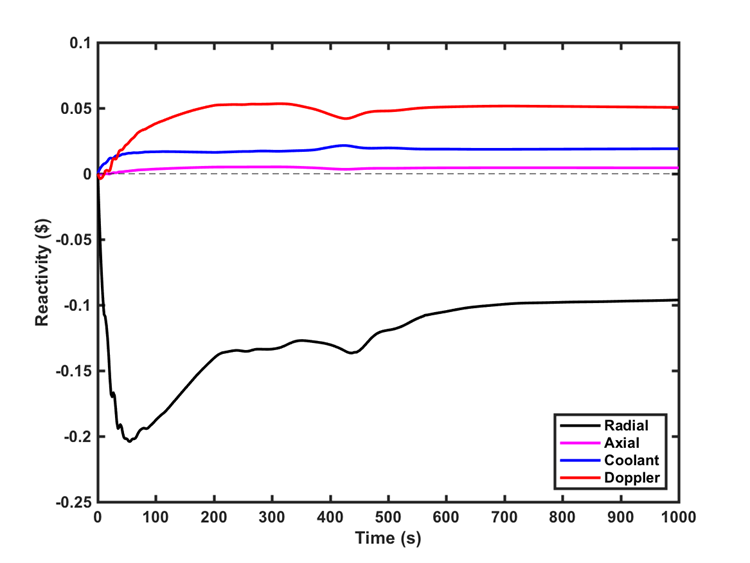
Figure 10: ABTR ULOF transient reactivity feedbacks.
How to run the model
There are two SAM input files related to ABTR modeling. The first input model is used for the steady-state simulation, which generates a checkpoint file for the transient case. The Checkpoint file provides the initial conditions for the ABTR ULOF transient modeling. They are executed in the following sequence.
sam-opt -i abtr_ss.i
sam-opt -i abtr_ulof.i
References
- Y I Chang, P J Finck, C Grandy, J Cahalan, L Deitrich, F Dunn, D Fallin, M Farmer, T Fanning, T Kim, L Krajtl, S Lomperski, A Moisseytsev, Y Momozaki, J Sienicki, Y Park, Y Tang, C Reed, C Tzanos, S Wiedmeyer, W Yang, Y Chikazawa, and JAEA.
Advanced burner test reactor preconceptual design report.
Technical Report ANL-ABR-1, Argonne National Laboratory, 2008.
URL: https://www.osti.gov/biblio/946035 https://www.osti.gov/servlets/purl/946035, doi:10.2172/946035.[BibTeX]
- G Hu, G Zhang, and R Hu.
Reactivity Feedback Modeling in SAM.
Technical Report ANL/NSE-19/1, Argonne National Laboratory, 2019.
URL: https://www.osti.gov/biblio/1499041 https://www.osti.gov/servlets/purl/1499041, doi:10.2172/1499041.[BibTeX]