Balance of Plant system
Startup transient
The startup transient runs using the initial conditions declared in the model description. The steady state is reached at about 20,000 s.
To run the startup transient, run the following:
$ moose-opt -i htgr_startup_transient.i
The motor and turbine torques (secondary loop) are shown in Figure 1: as expected, the motor torque increases quickly during the first few seconds, in order to initiate the shaft rotation speed, shown in Figure 2. This quantity must be lower than the rated value, to avoid breaking the equipment. This condition is verified thanks to the PID controller: it stays at 9,300 rad/s during the steady state, which is lower than the 9,950 rad/s (or 95,000 rpm) rated.
Once the shaft rotation is initiated and the turbine generates enough torque, the motor torque decreases slowly to zero.
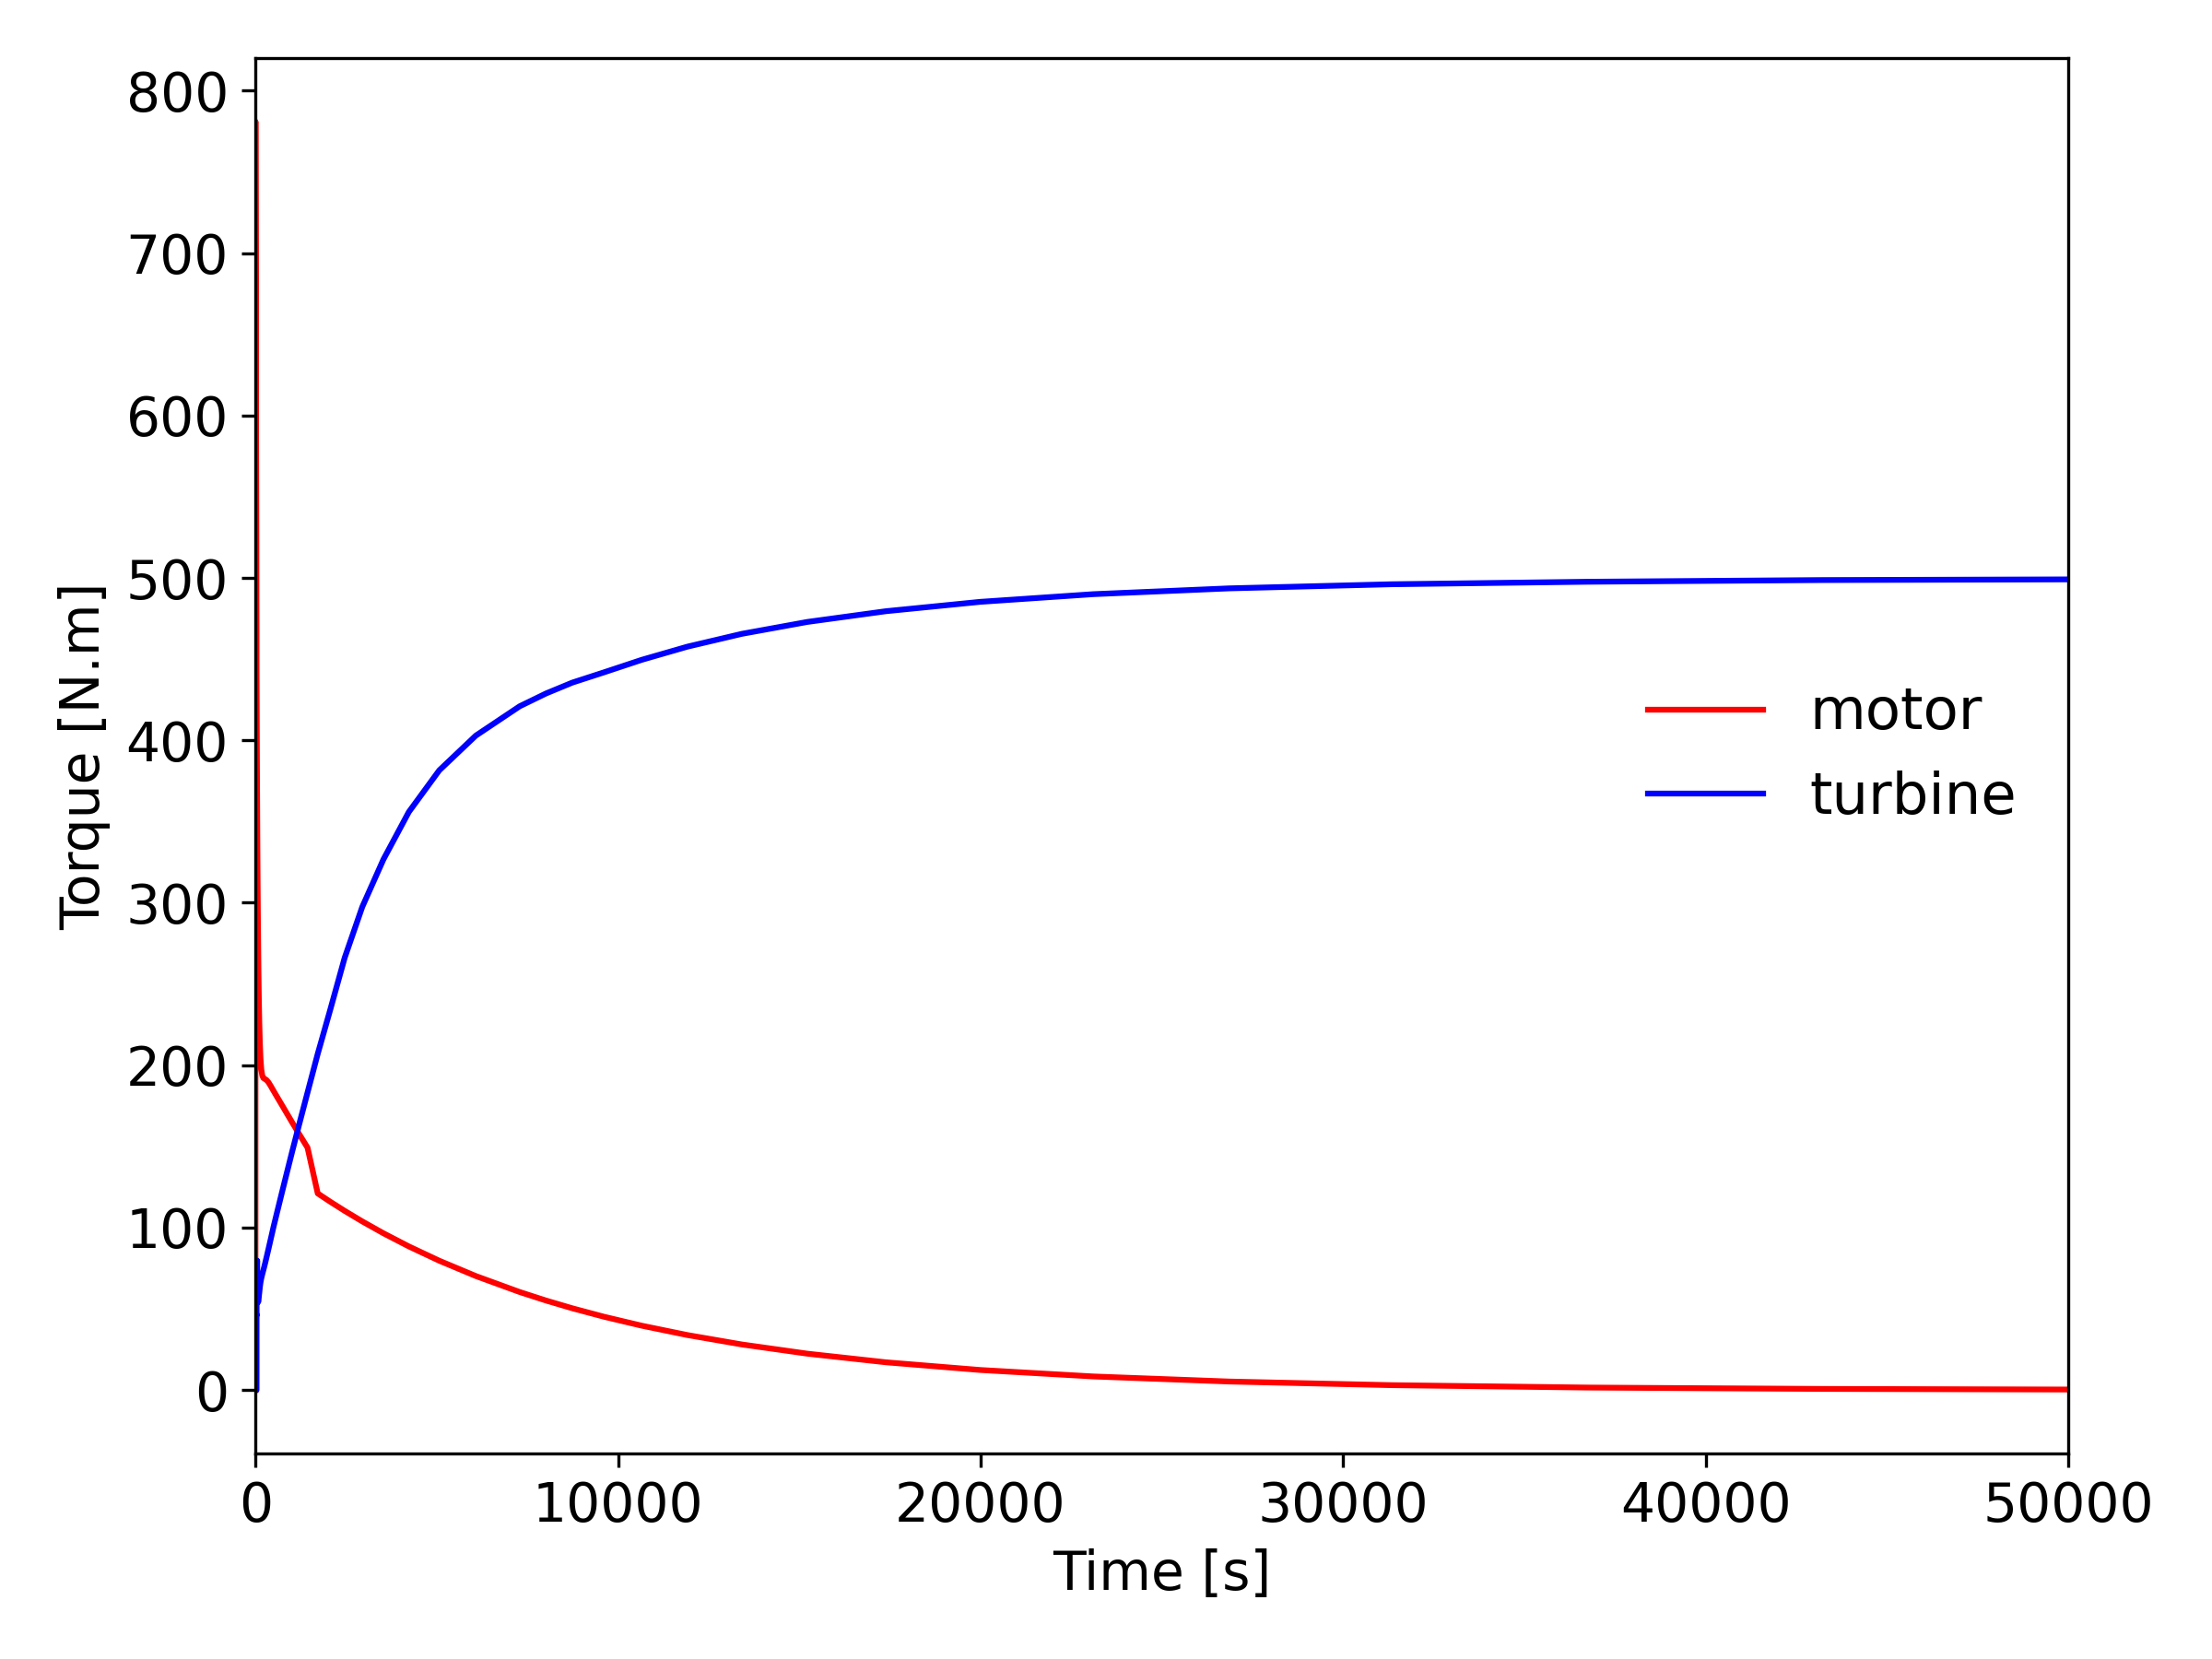
Figure 1: Startup transient - motor and turbine torques
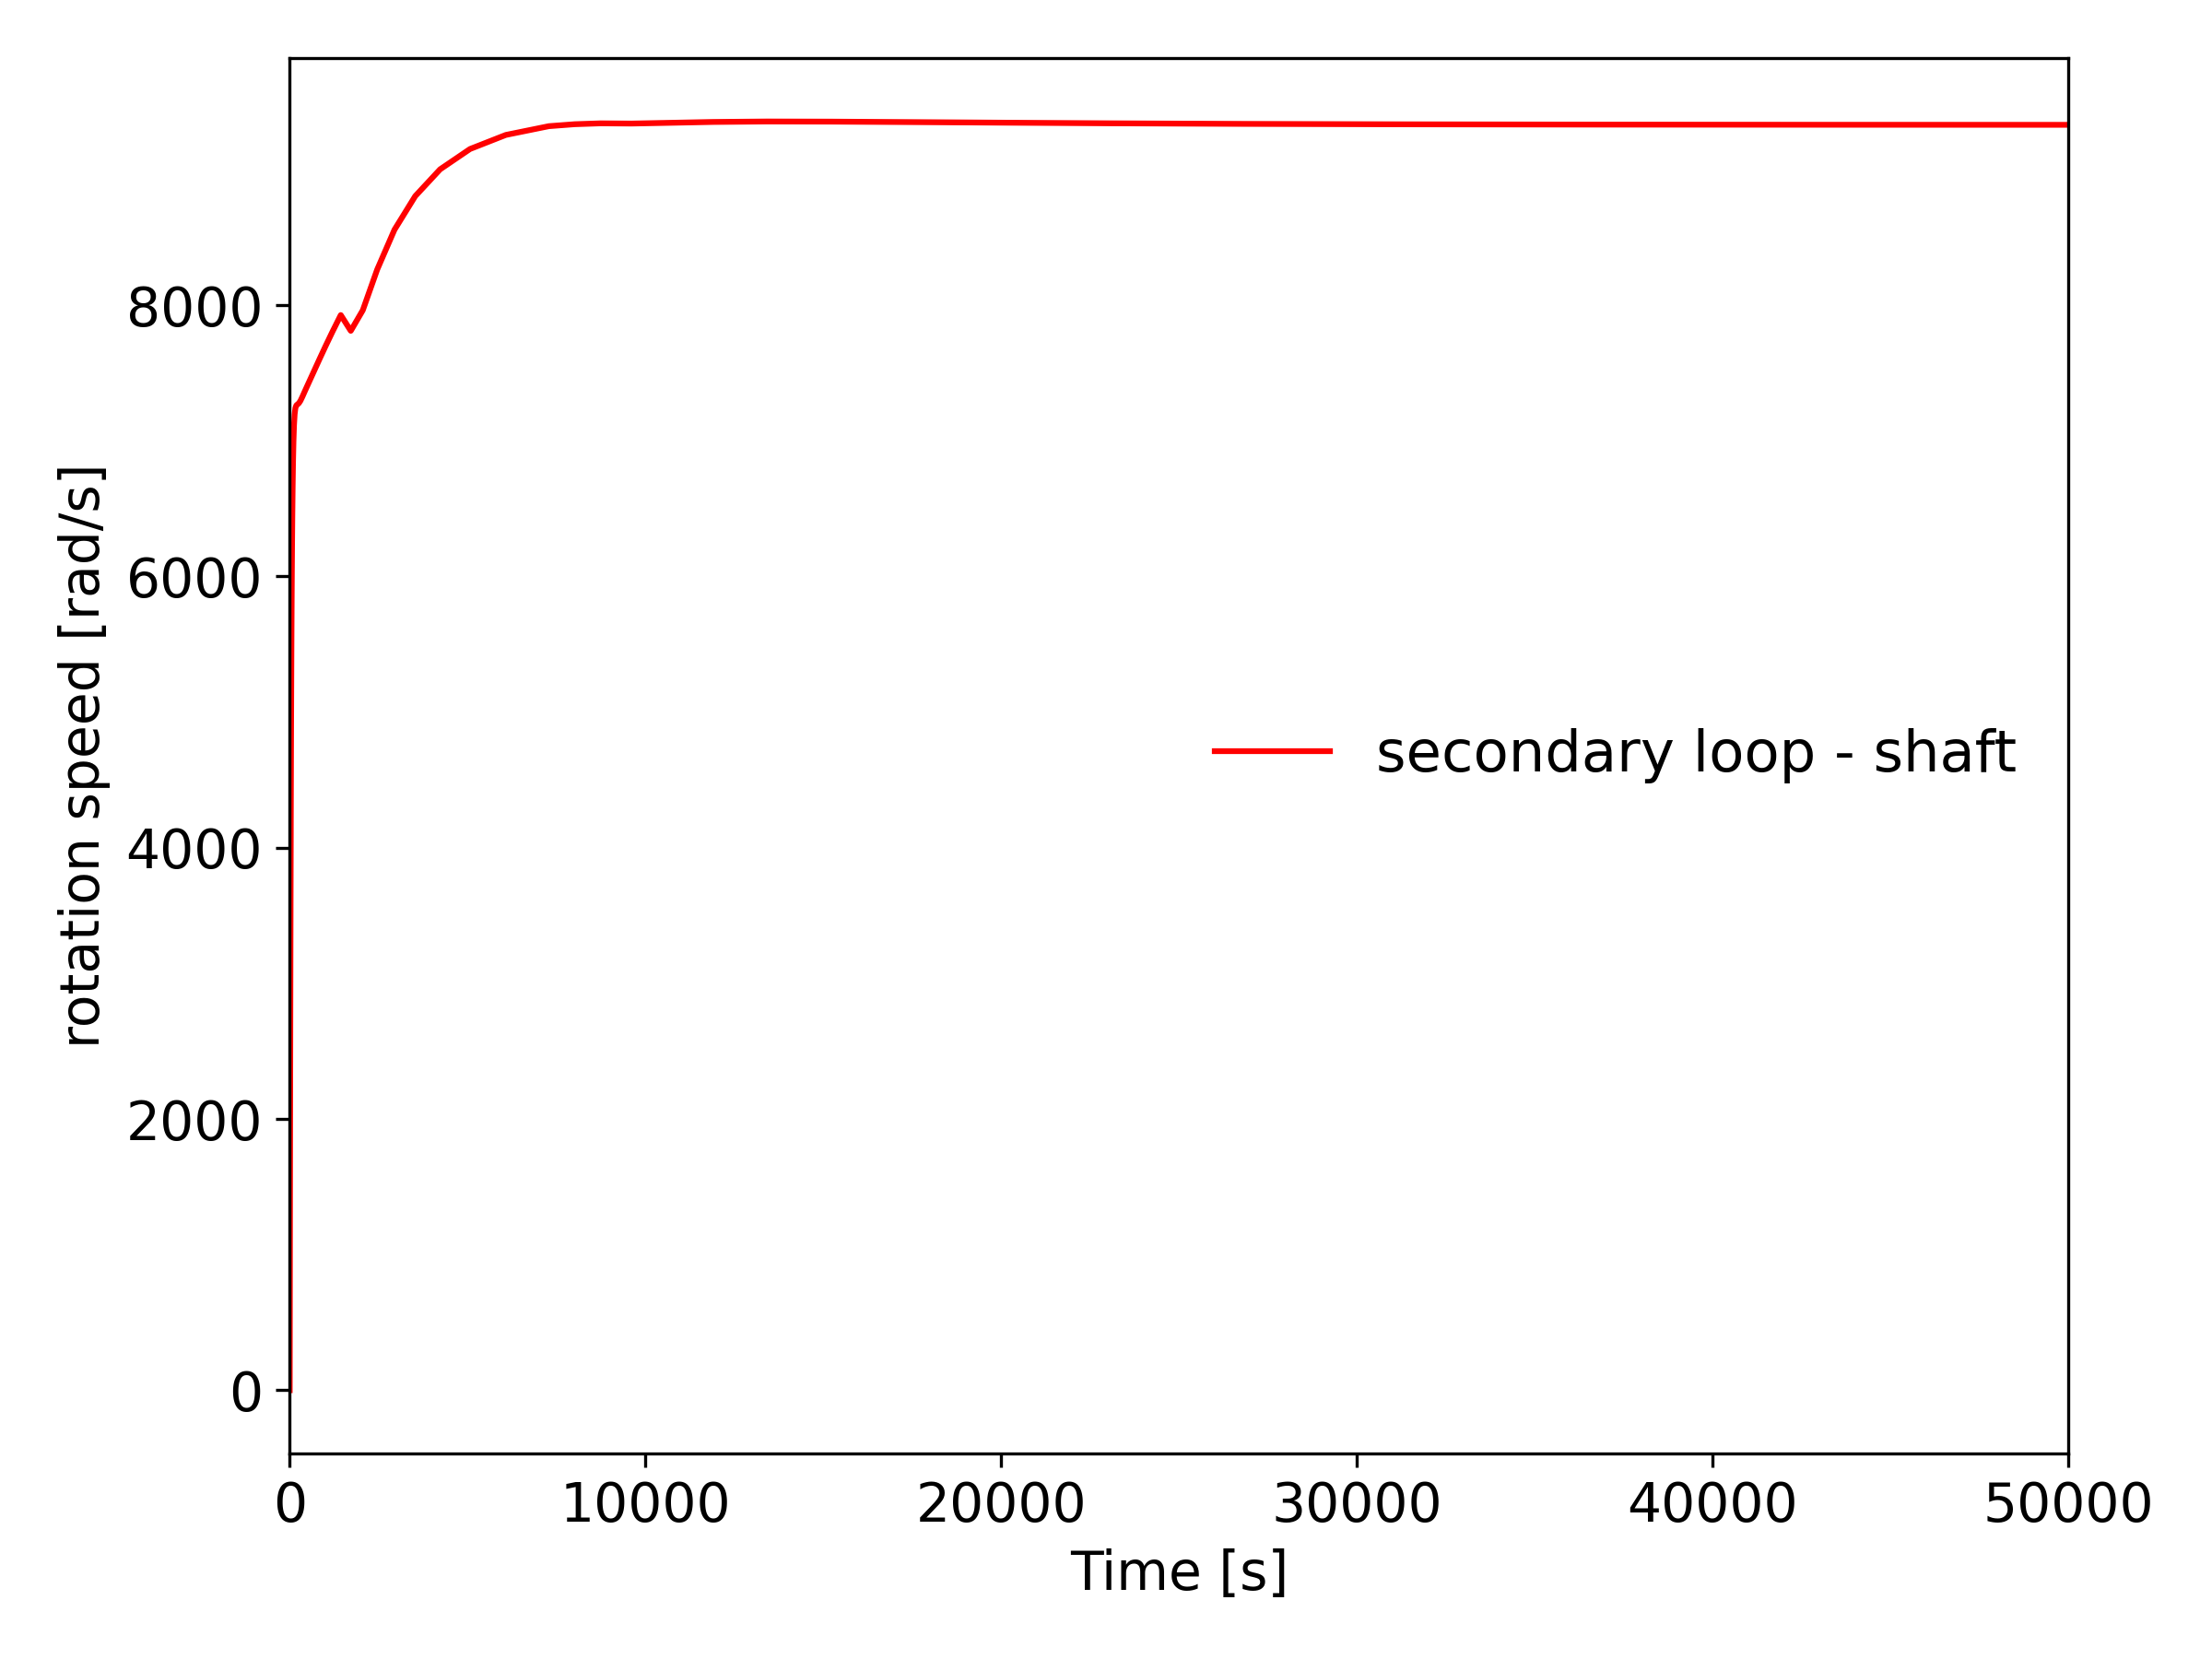
Figure 2: Startup transient - secondary loop - shaft speed
The primary and secondary mass flow rates are shown in Figure 3 and Figure 4. It is important to have high enough mass flow rates to have optimal heat transfers. As shown in these figures, the steady state is reached in approximately 20,000 s.
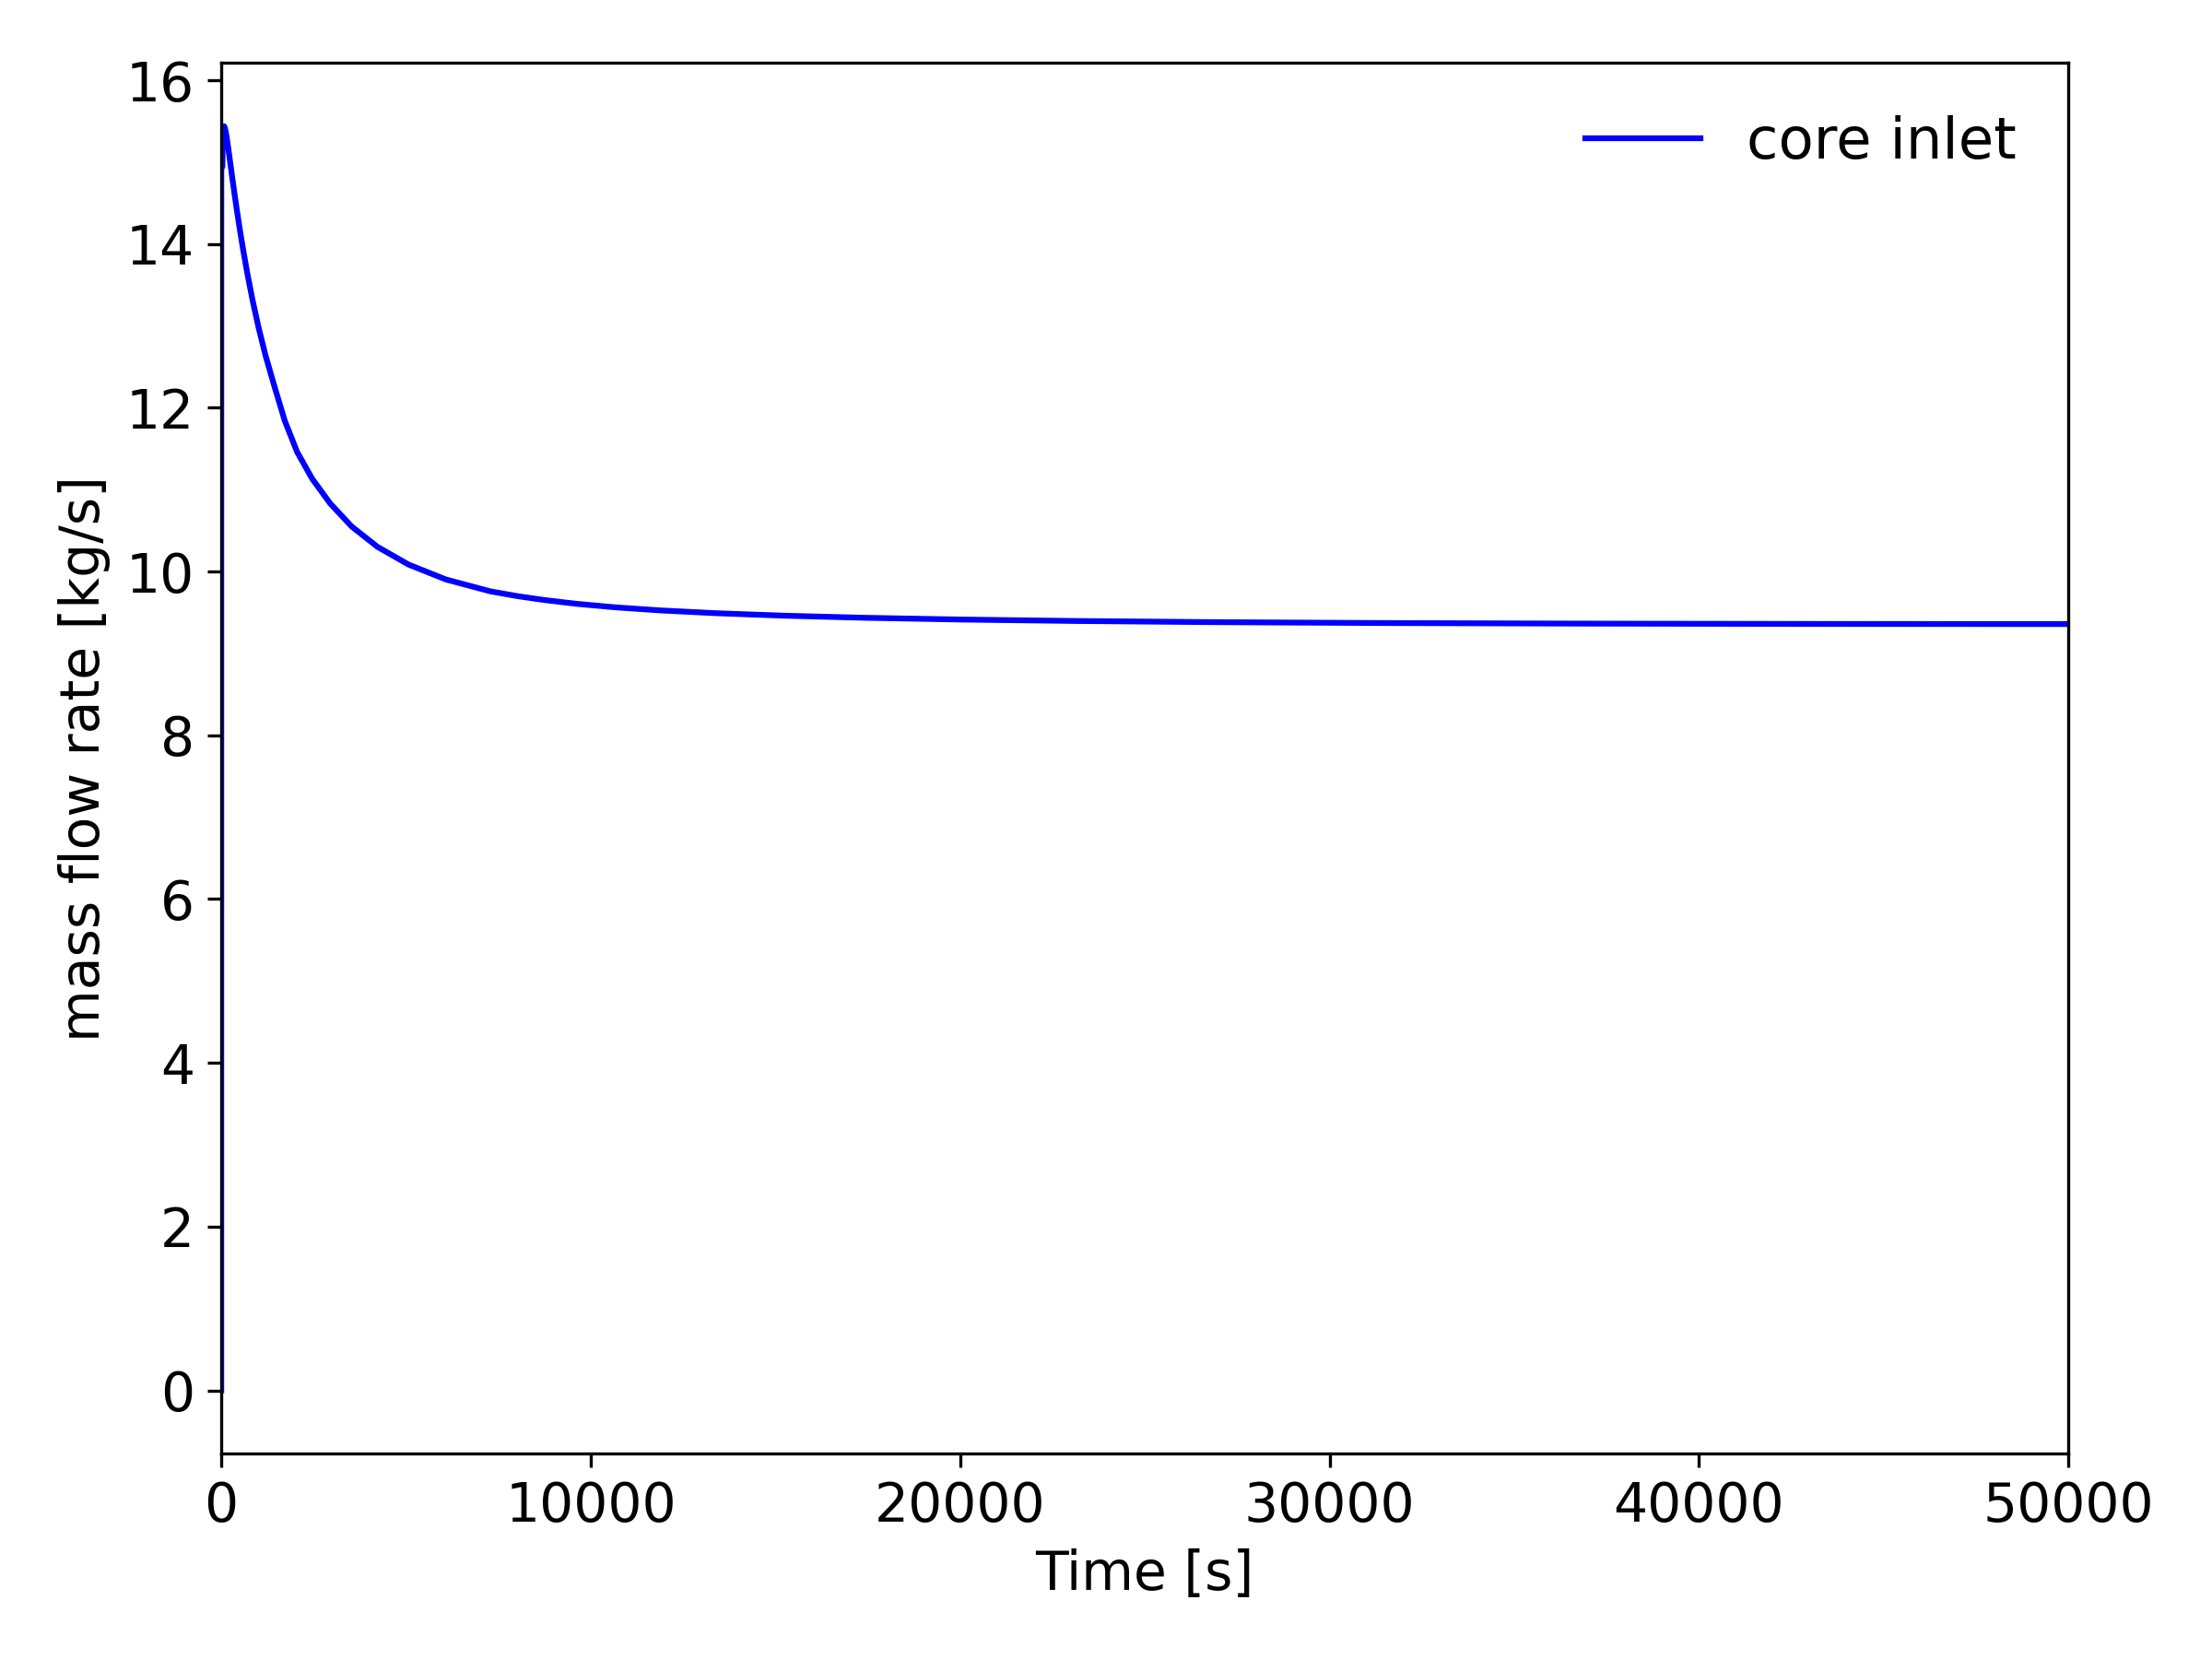
Figure 3: Startup transient - primary mass flow rate
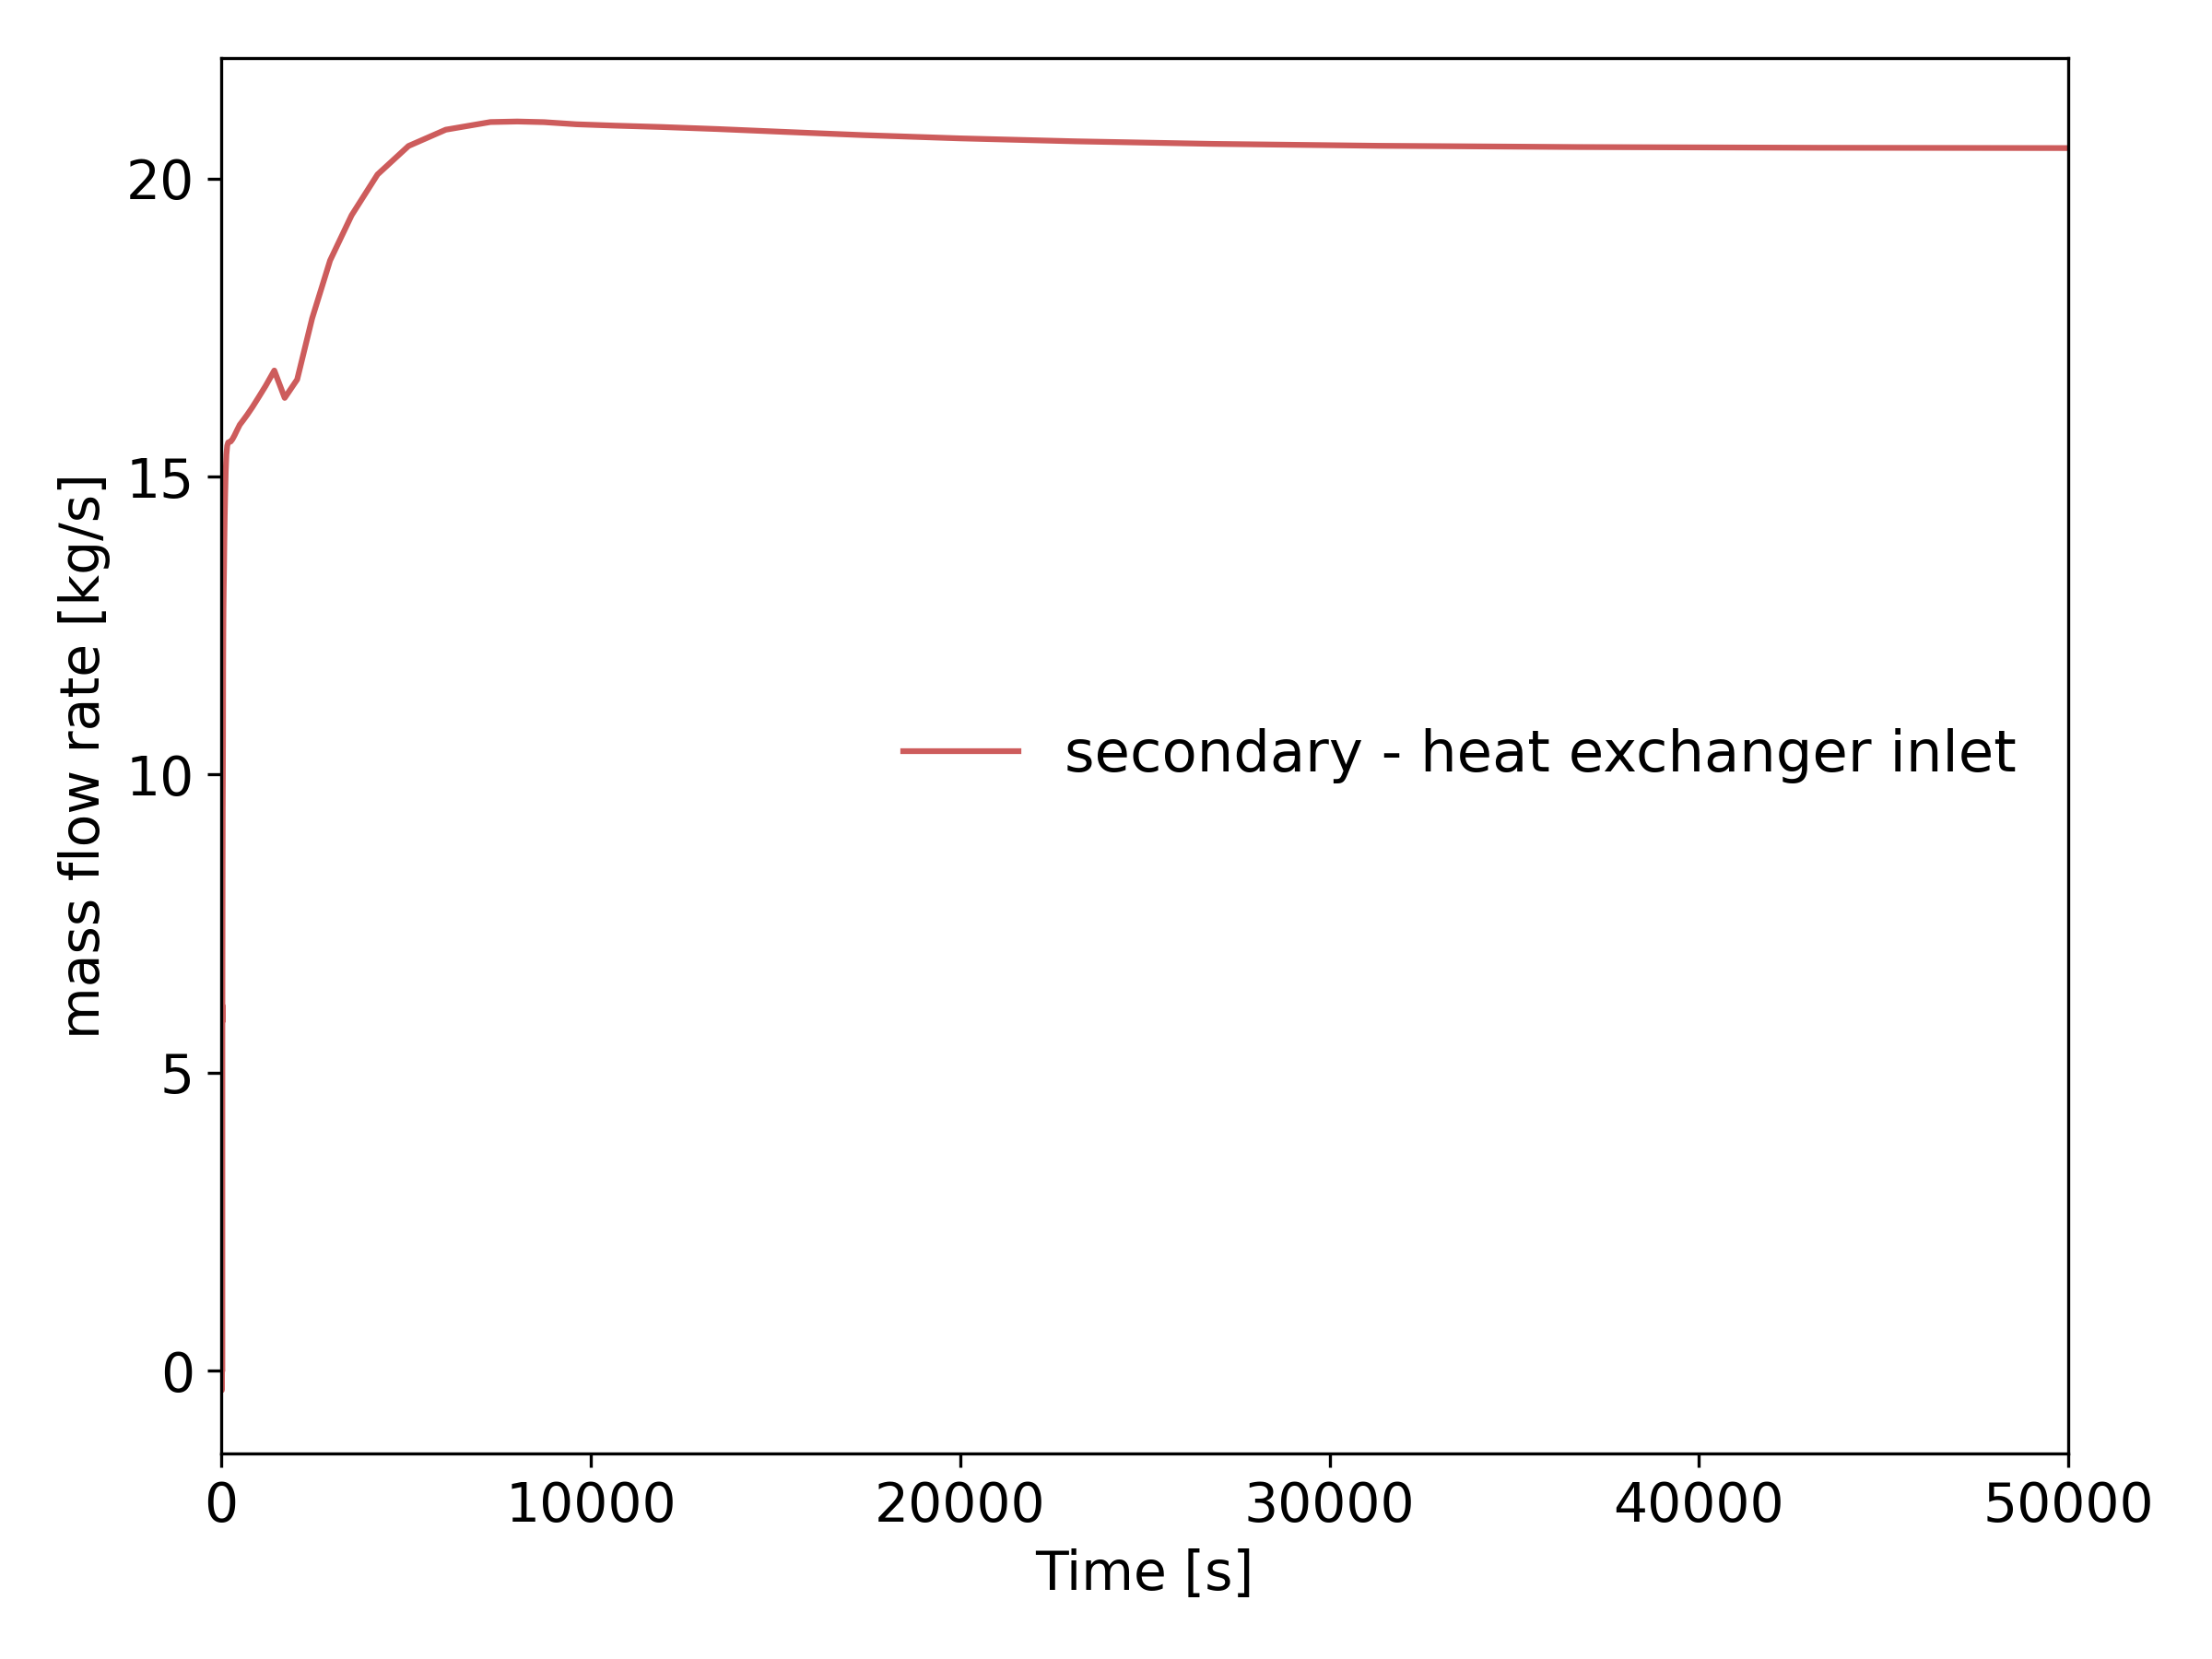
Figure 4: Startup transient - secondary mass flow rate
The primary pressures are shown in Figure 5: as expected, the pressures stay close to 90 bar in the whole primary loop. The pump compensates the loss of pressure induced in all the other components.
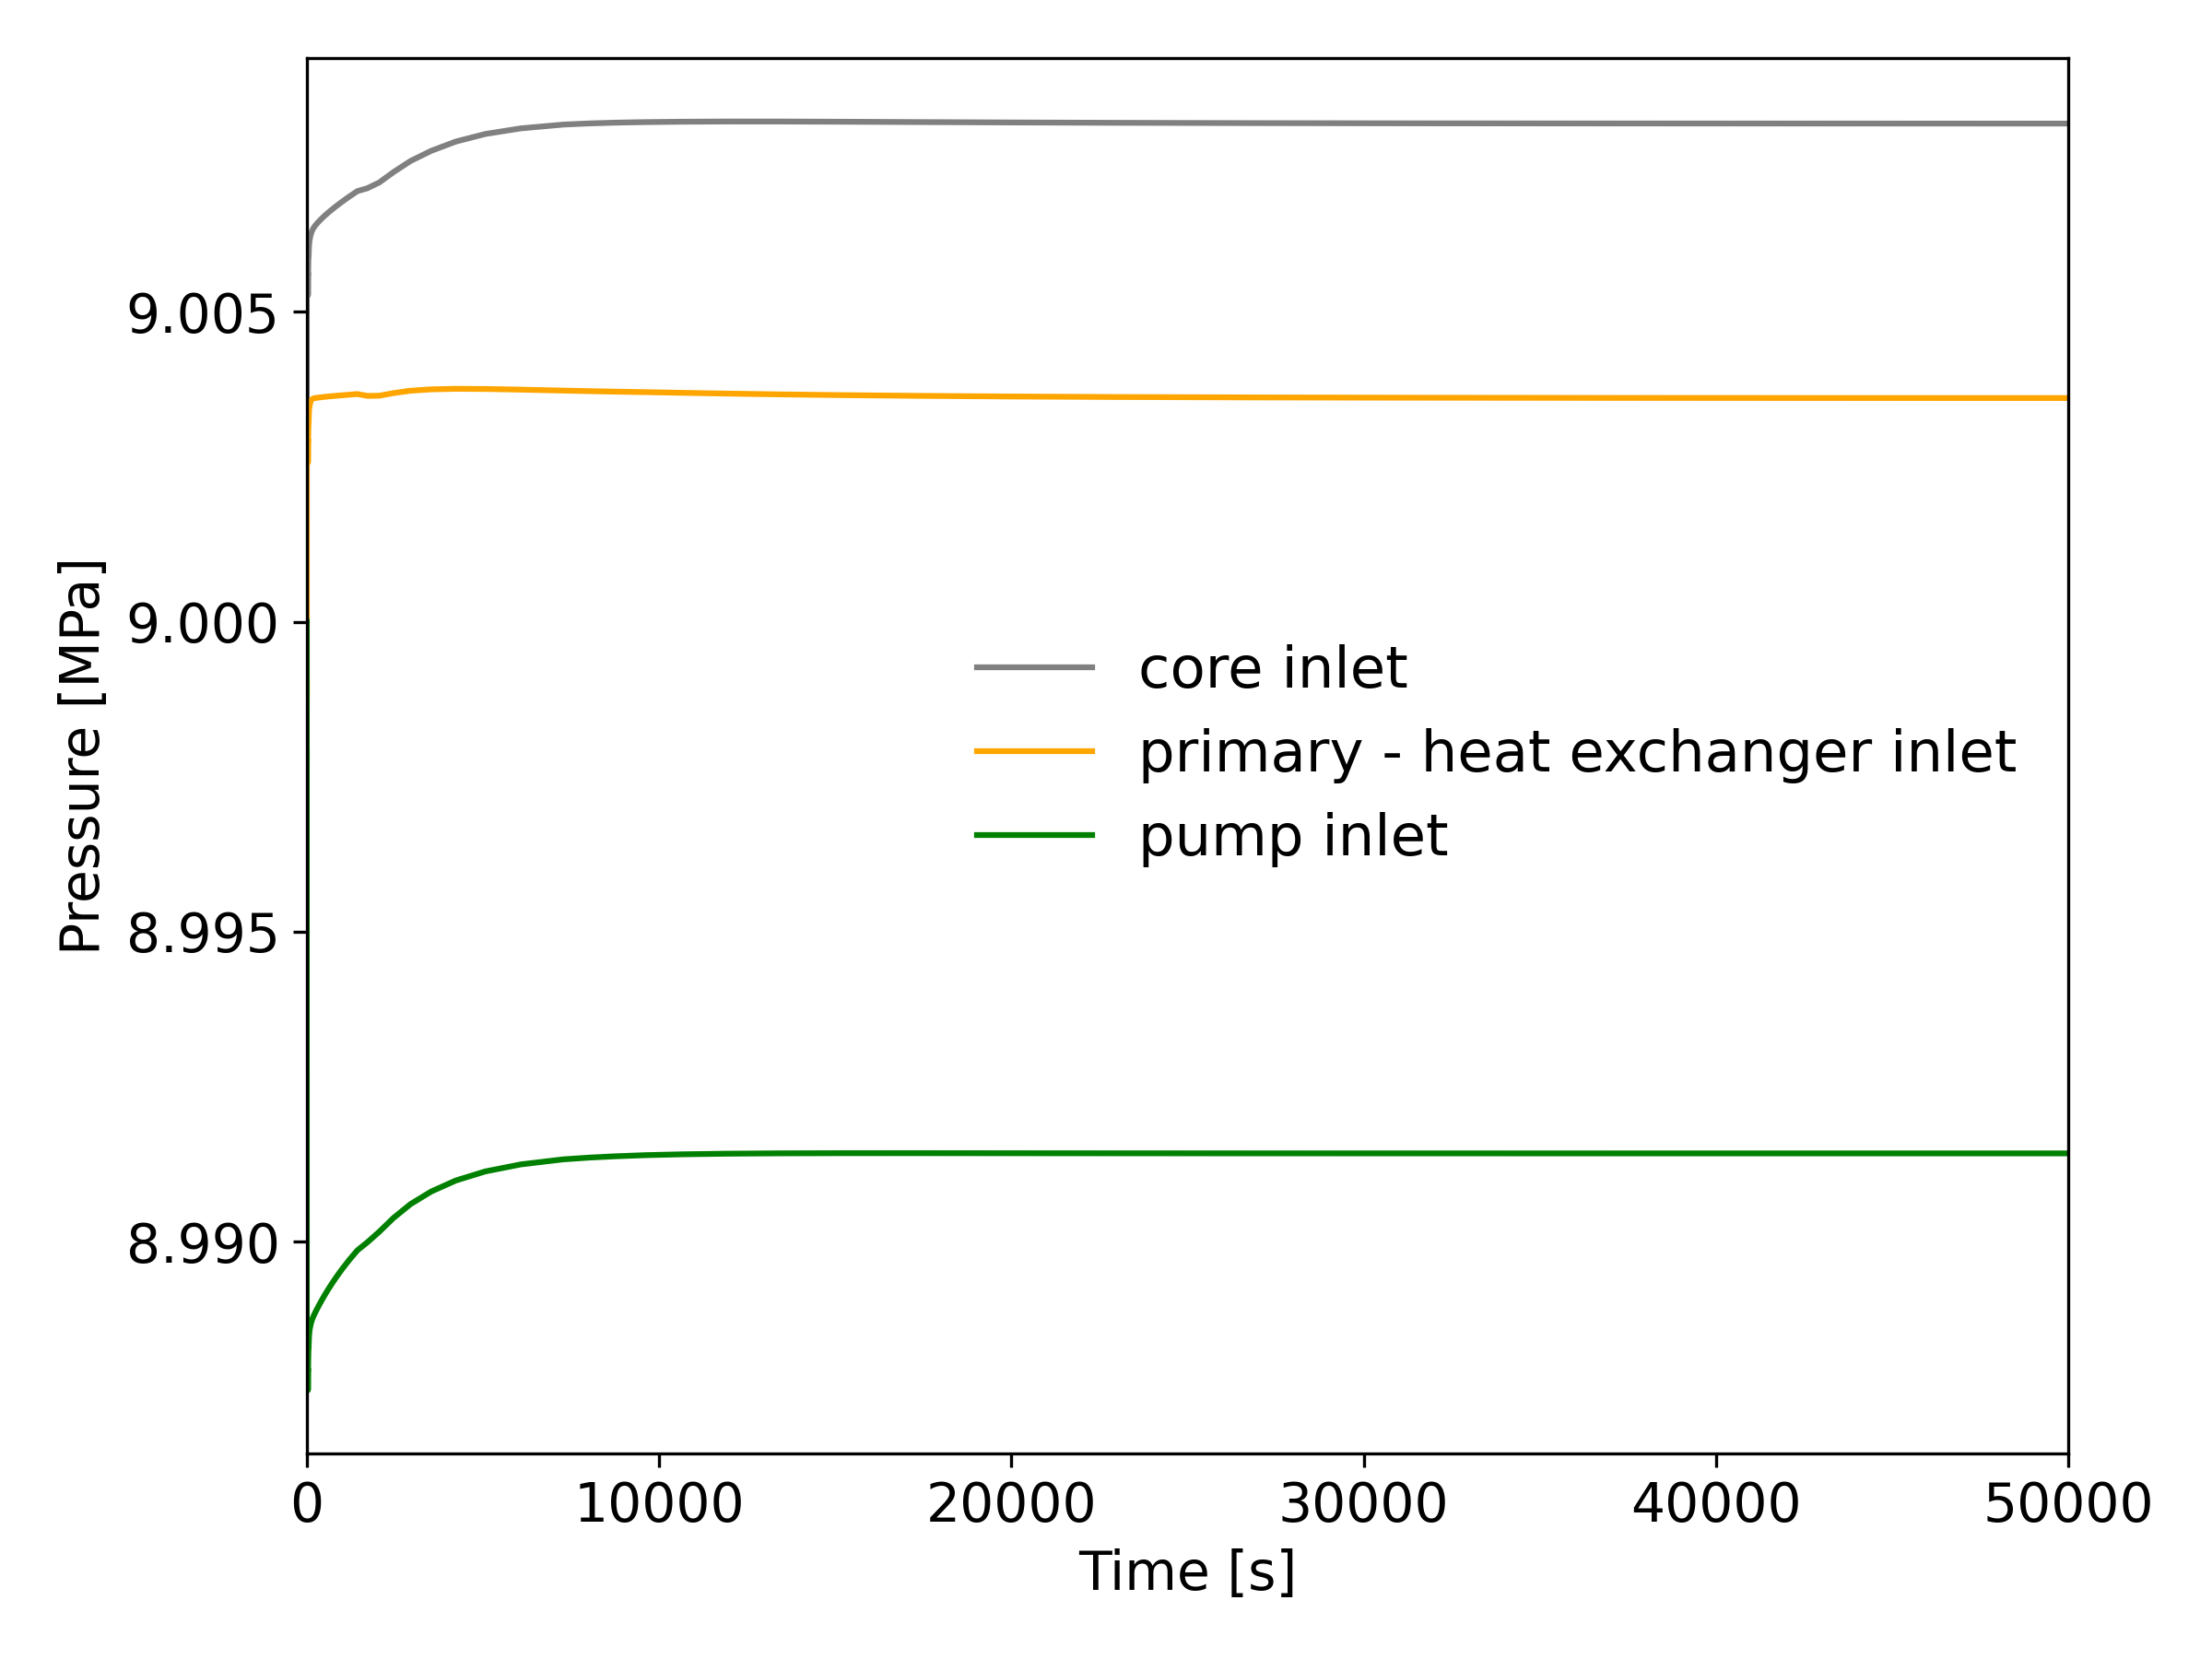
Figure 5: Startup transient - primary pressures
The secondary pressures are shown in Figure 6: a steady state in obtained after approximately 20,000 s. As expected, it dramatically increases during the steady state between the inlet and outlet of the compressor. From its outlet to the turbine inlet, it decreases slowly from 5.8 bar to 4.8 bar, due to the loss of pressure in the channels, and diminishes mainly in the turbine. In its outlet, the pressure value is 1.6 bar.
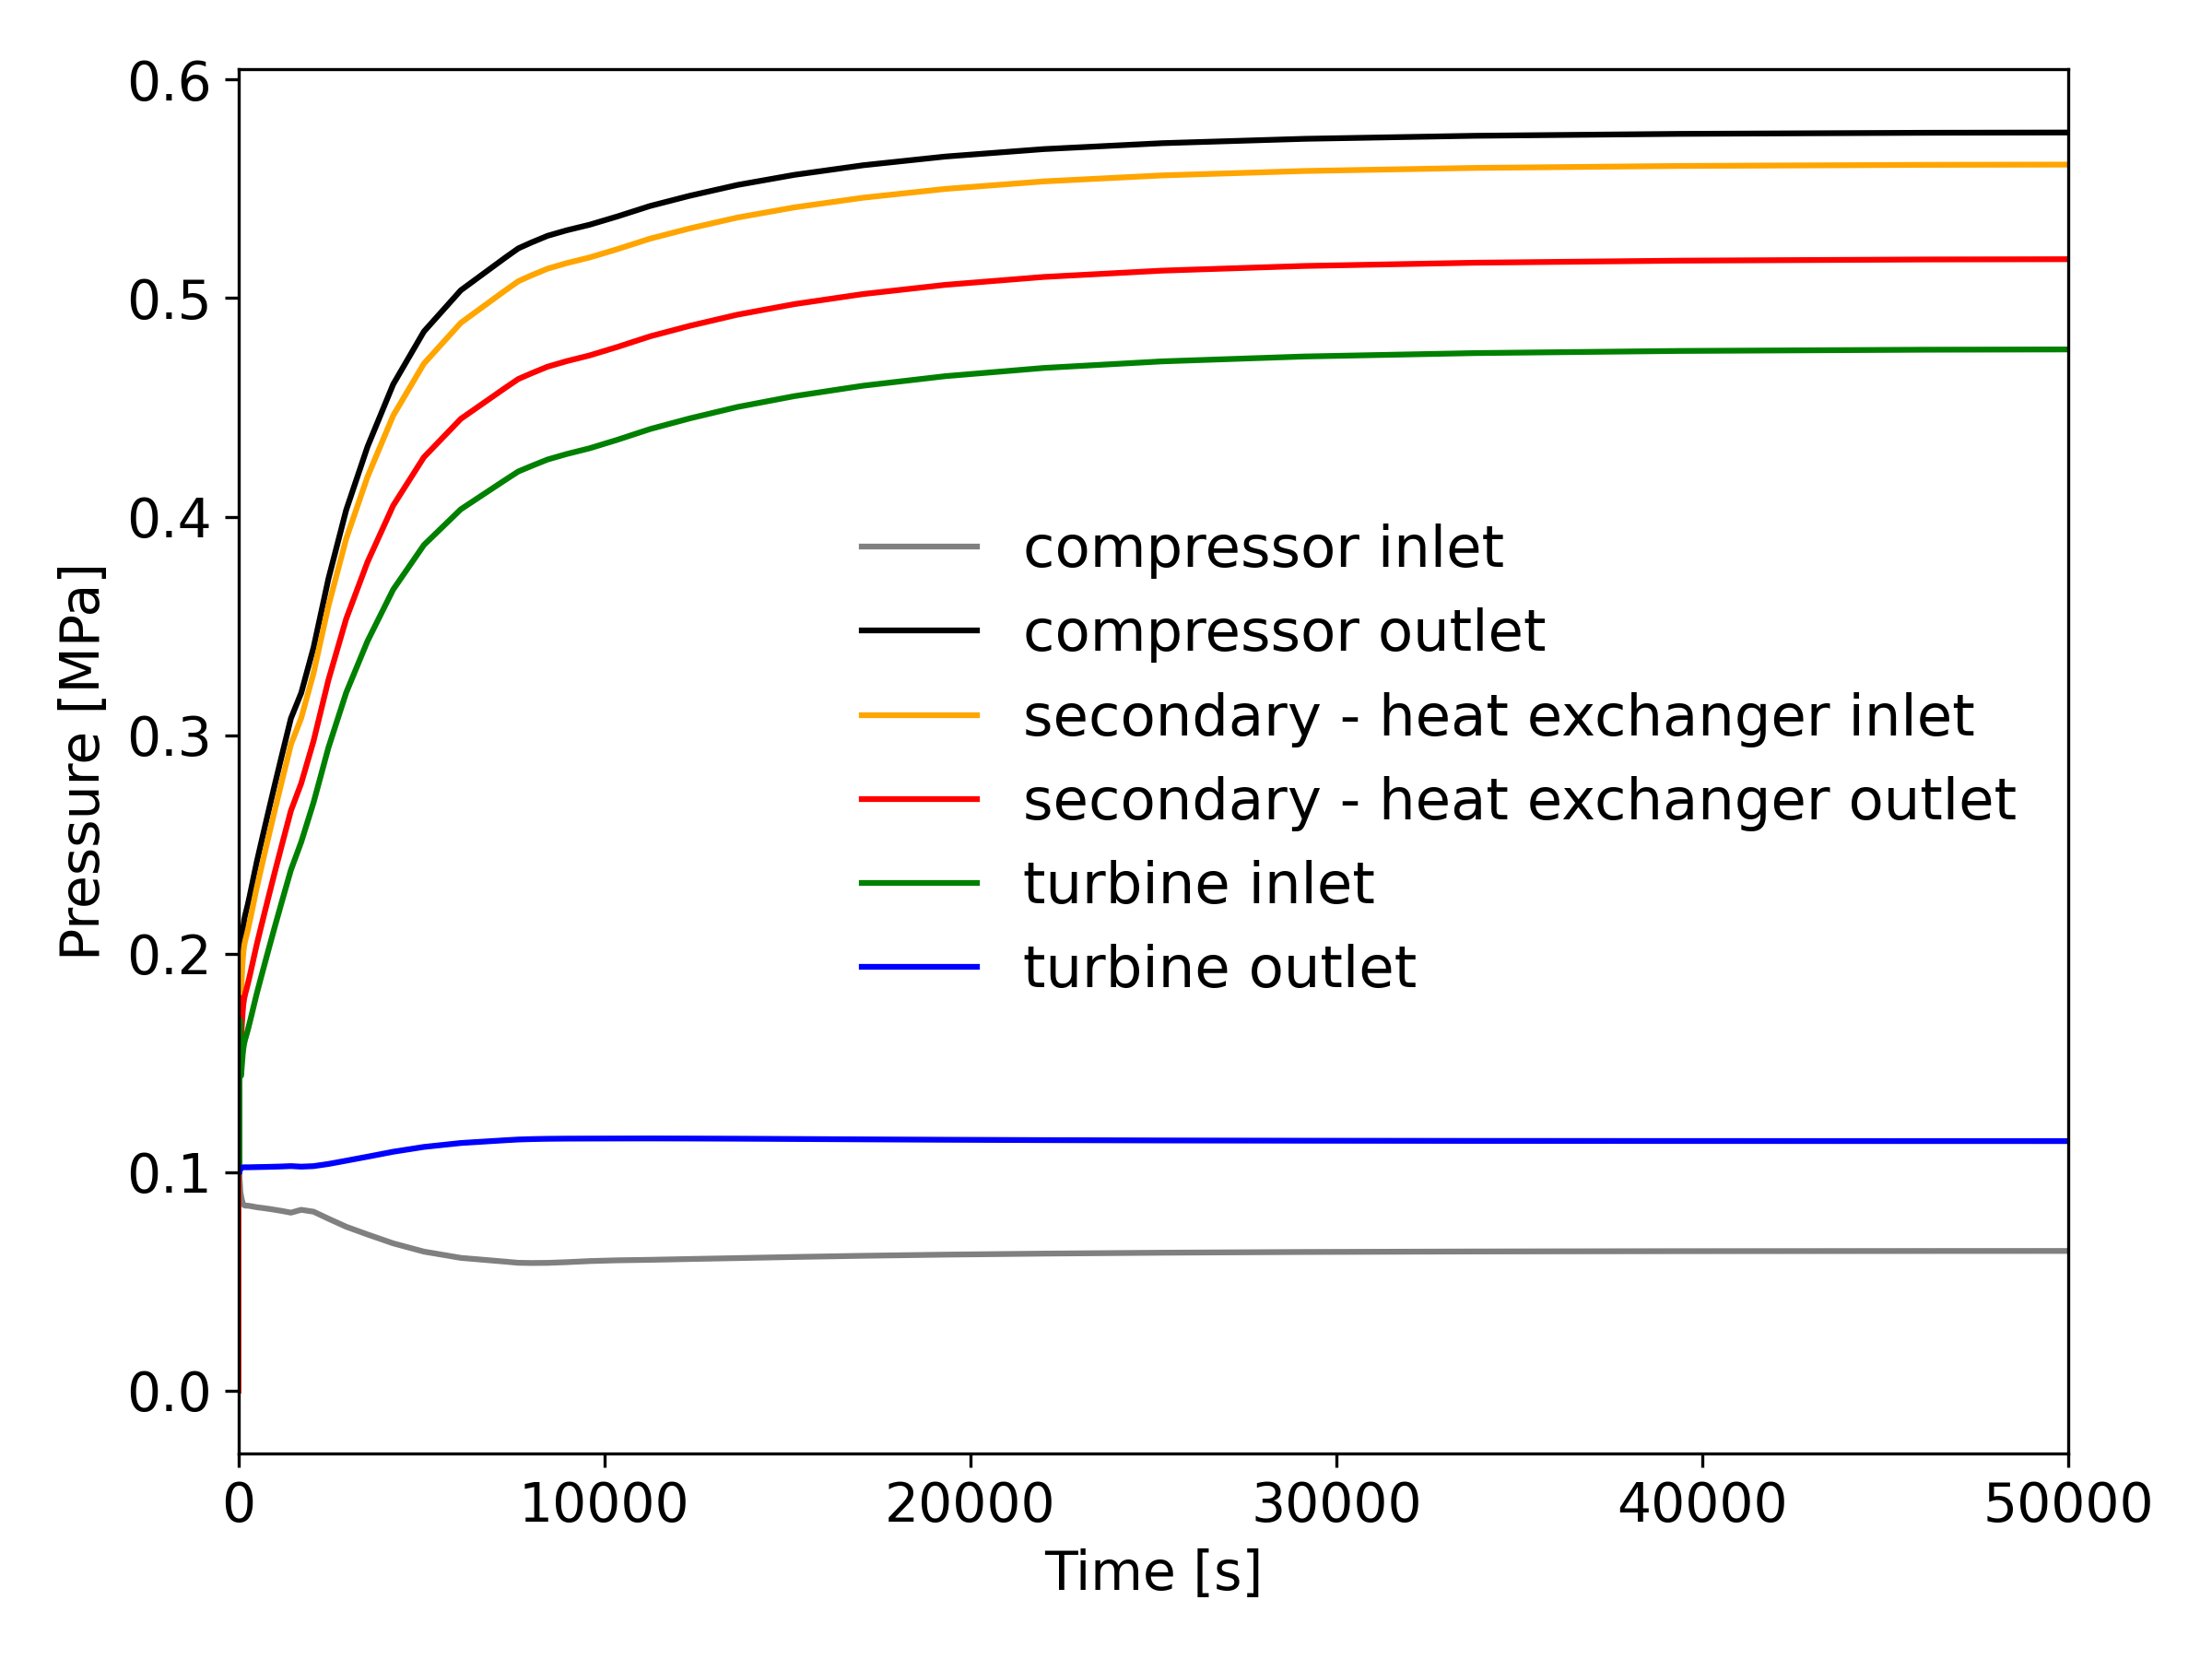
Figure 6: Startup transient - secondary pressures
The temperatures are shown in Figure 7: once again, the steady state is reached after approximately 20,000 s. Helium is heated in the core from 890 K to 1190 K during the steady state and releases this thermal power to the secondary flow in the heat exchanger. In this component, its temperature increases from 490 K to 1170 K. The wall (the surface between the moderator and the fluid) temperature increases over the length of the core but stays under 1300 K.
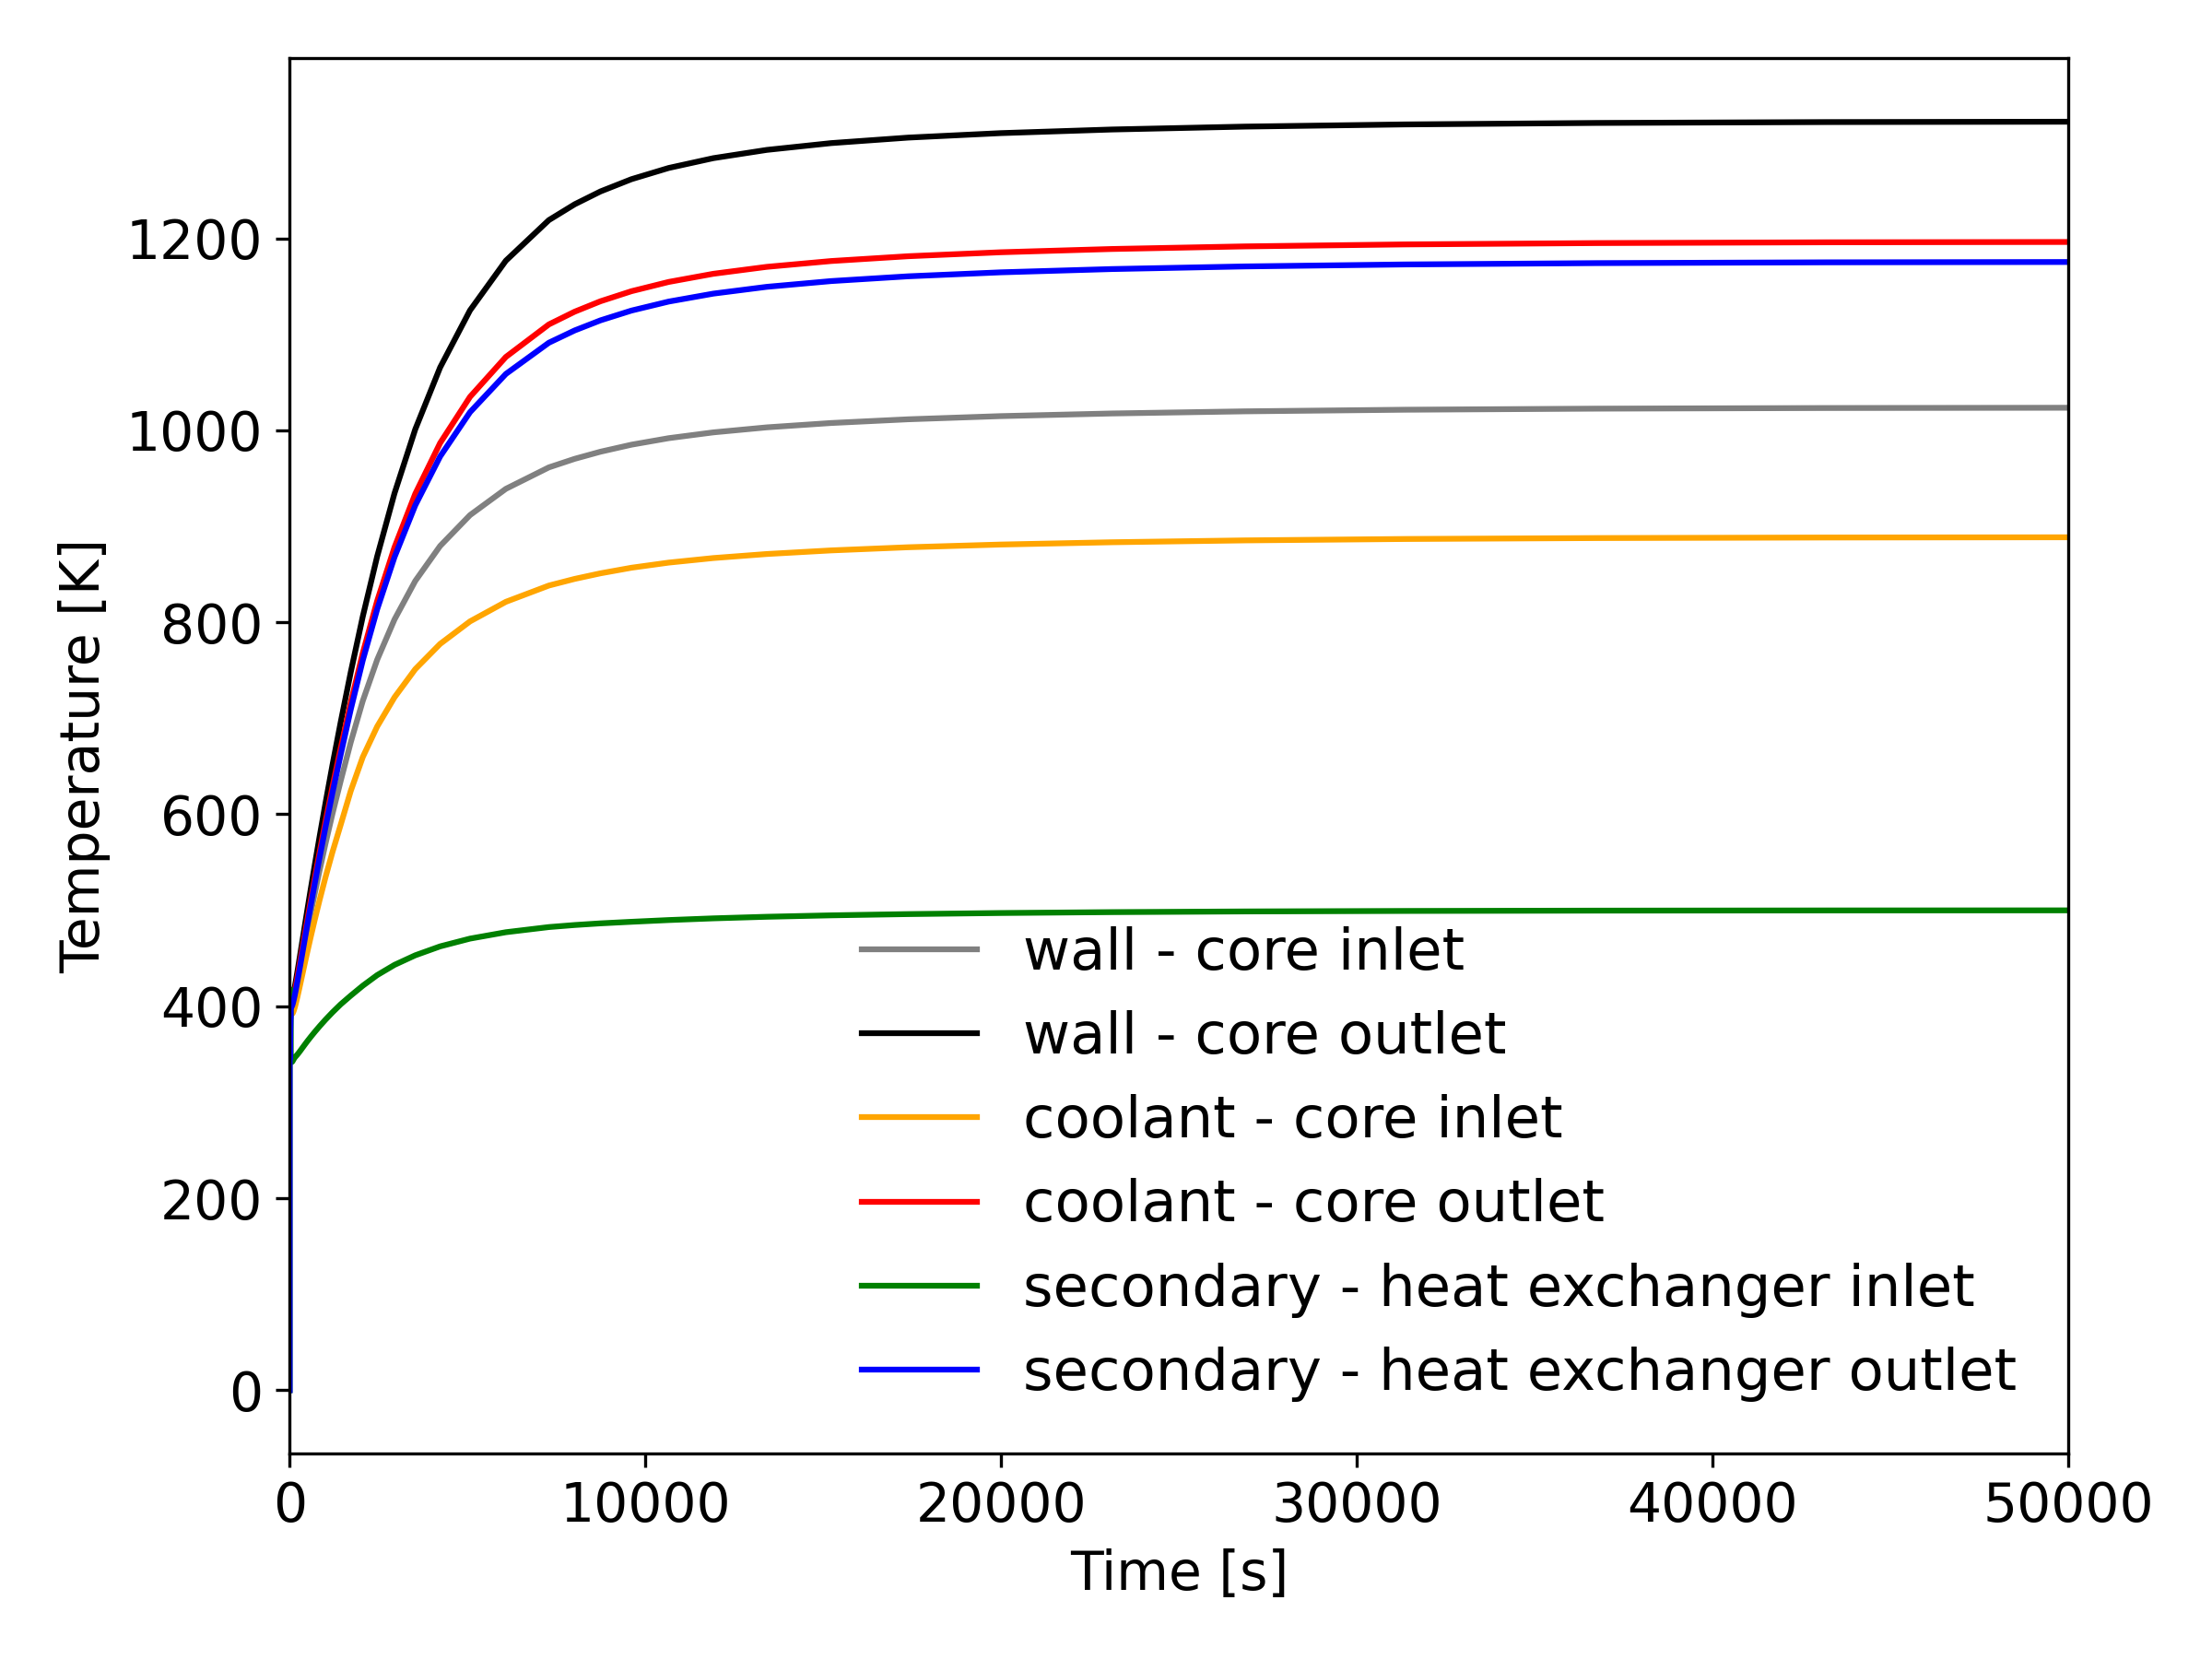
Figure 7: Startup transient - temperatures in the two loops
The extracted powers are shown in Figure 8: As expected, they increase in the core and in the heat exchanger go from zero to the operating value of 15 MWth. At the same time, the power extracted by the generator increases from zero to 2 MWe.
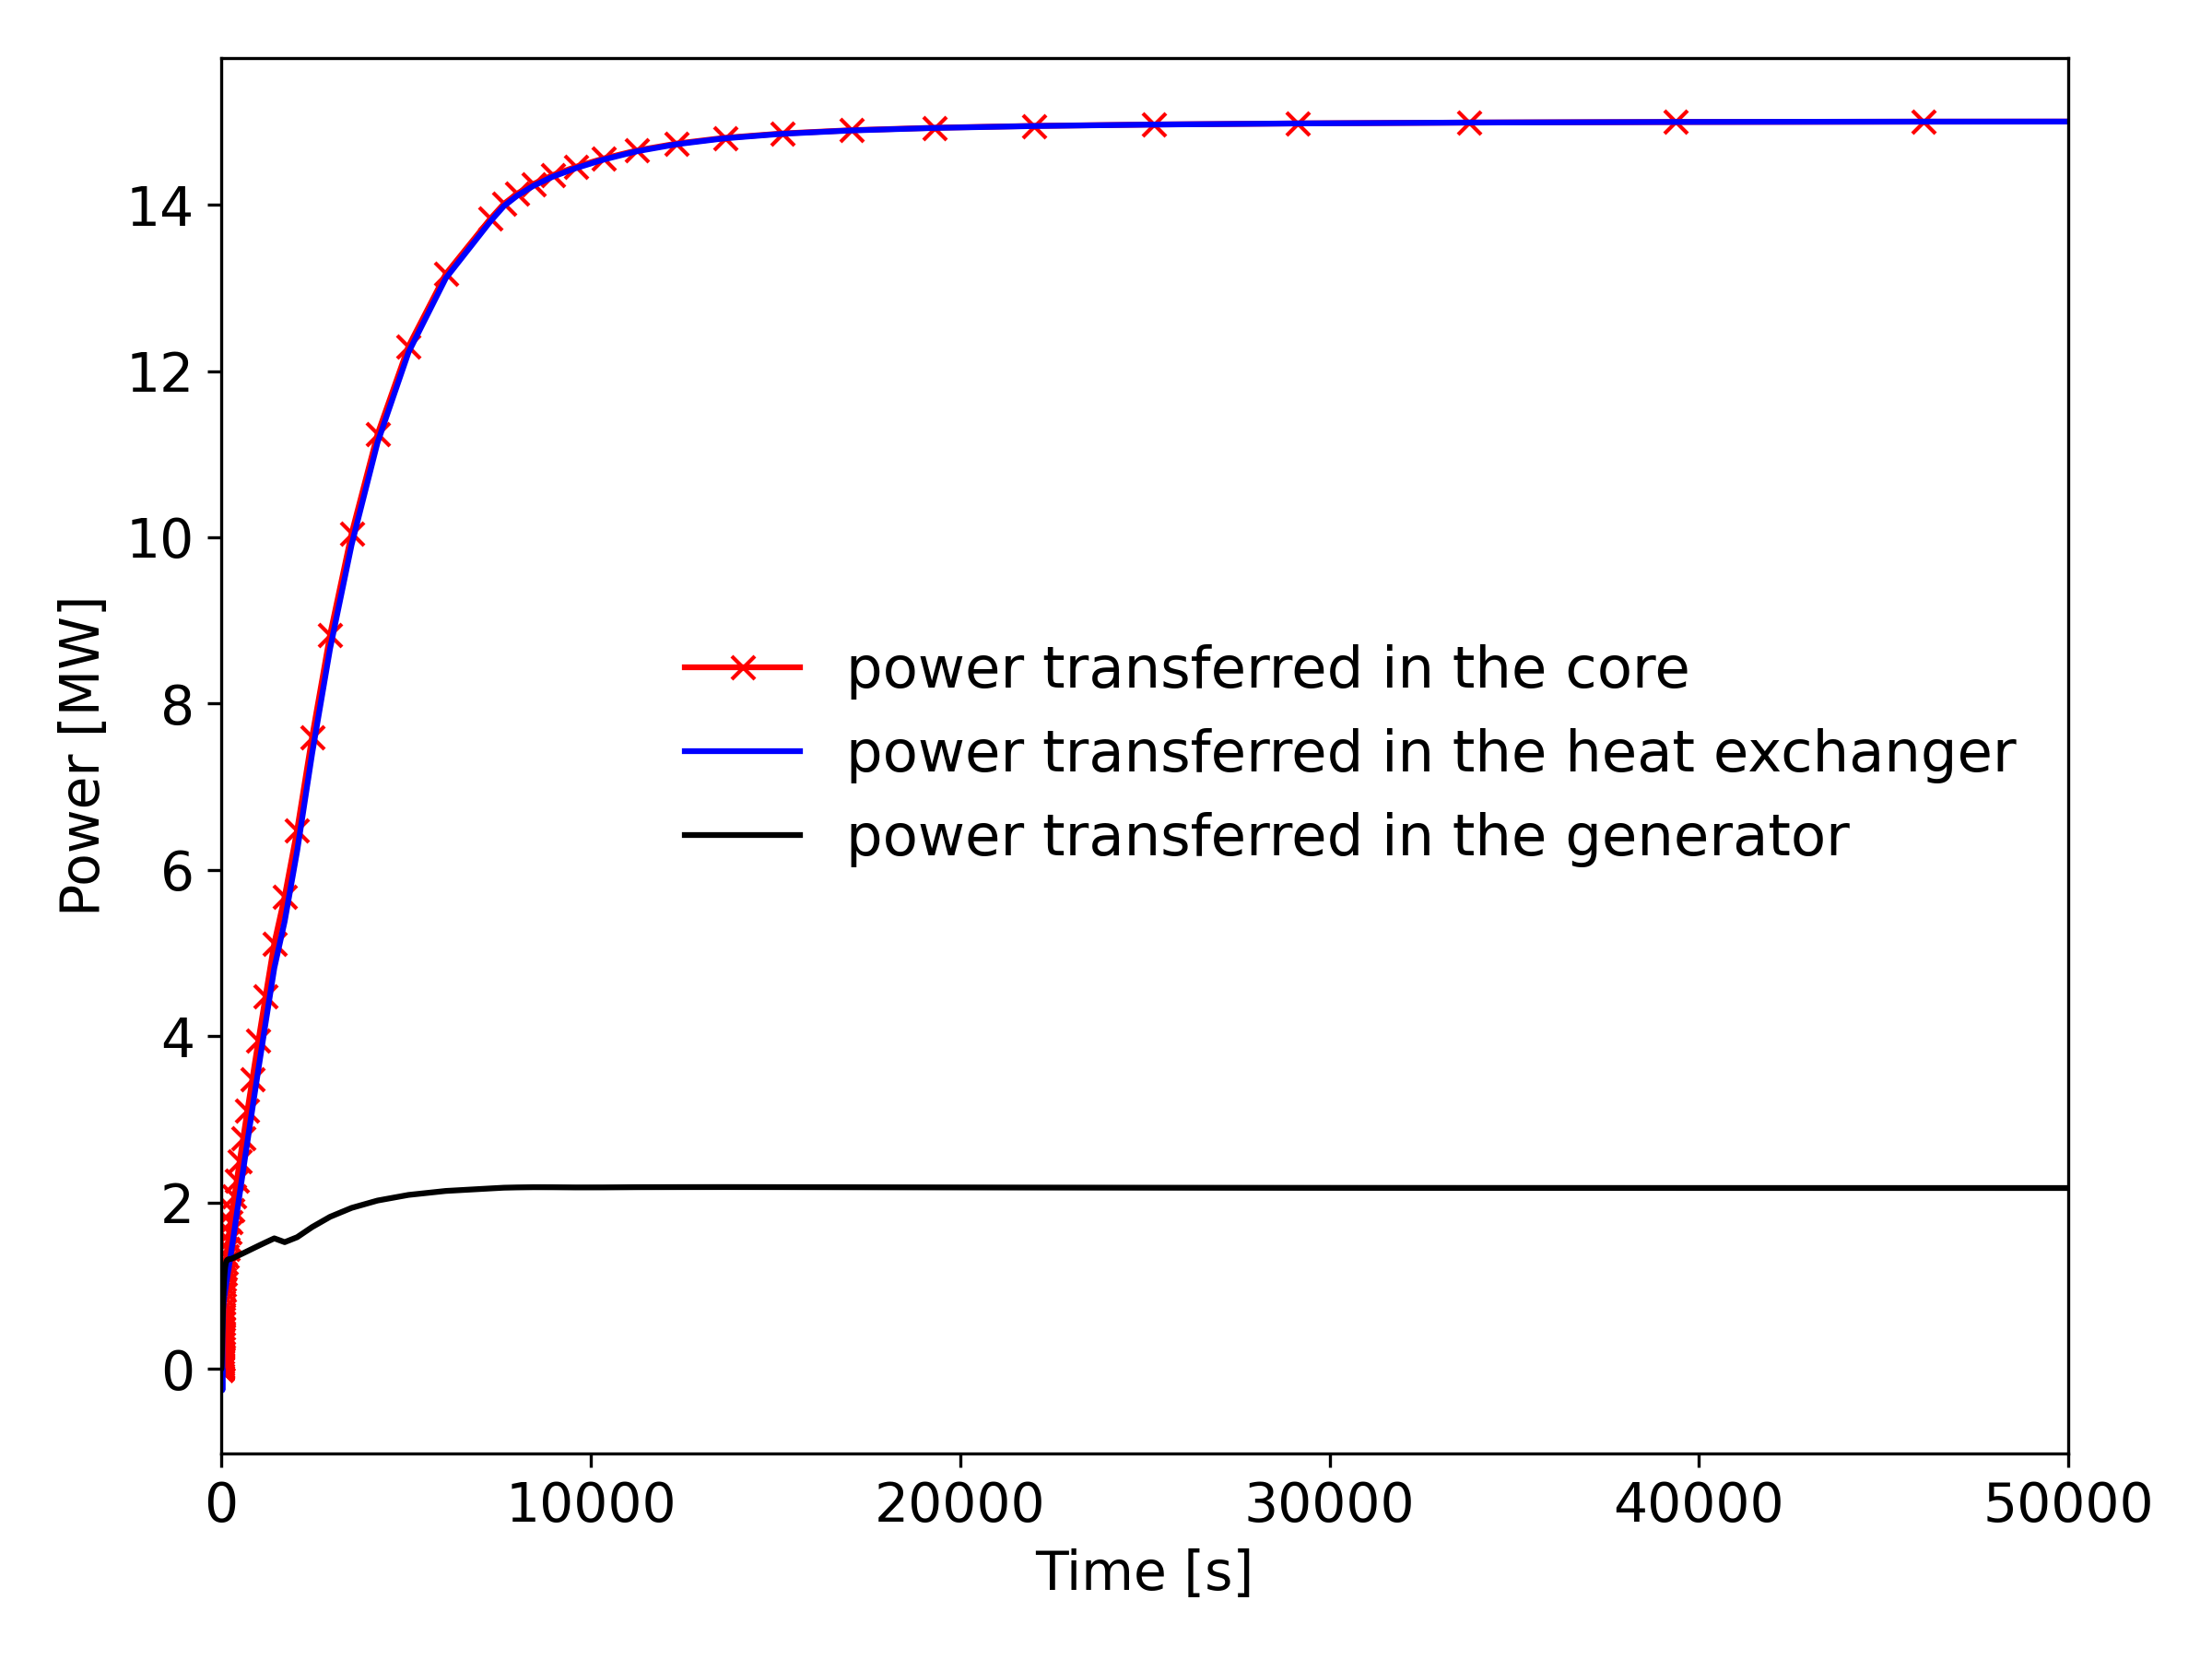
Figure 8: Startup transient - powers transferred and extracted
Load follow transient
The goal of this simulation is to study how the steady state system reacts to a power modulation. It could be done to adapt the production to the needs on the grid.
To run the load follow transient, run the startup transient first and then the following:
$ moose-opt -i htgr_load_follow_transient.i
The steady state reached in the previous simulation is used as initial condition. The main change is about the power delivered by the fuel in the core. From the beginning to 50,000 s, it is maintained to 15 MWth, and then it is diminished to 80% of this value. From 100,000s to the end, it is set again to its normal value.
In each of the following figures, a new steady state is reached in approximately 10,000s after the power modulation at and .
The shaft, compressor and turbine of the secondary loop are already launched. Consequently, there is no need for a motor as in the first simulation.
The shaft speed, as shown in Figure 9, is lower after the first modulation: its steady state value is 8,800 rad/s. The input of power is in fact lower, thus the power transferred to the turbine is lower too. The turbine is linked to the shaft and its rotation speed is lower than what it was at the beginning. The second power modulation gives after the transient step the same values as the initial ones.
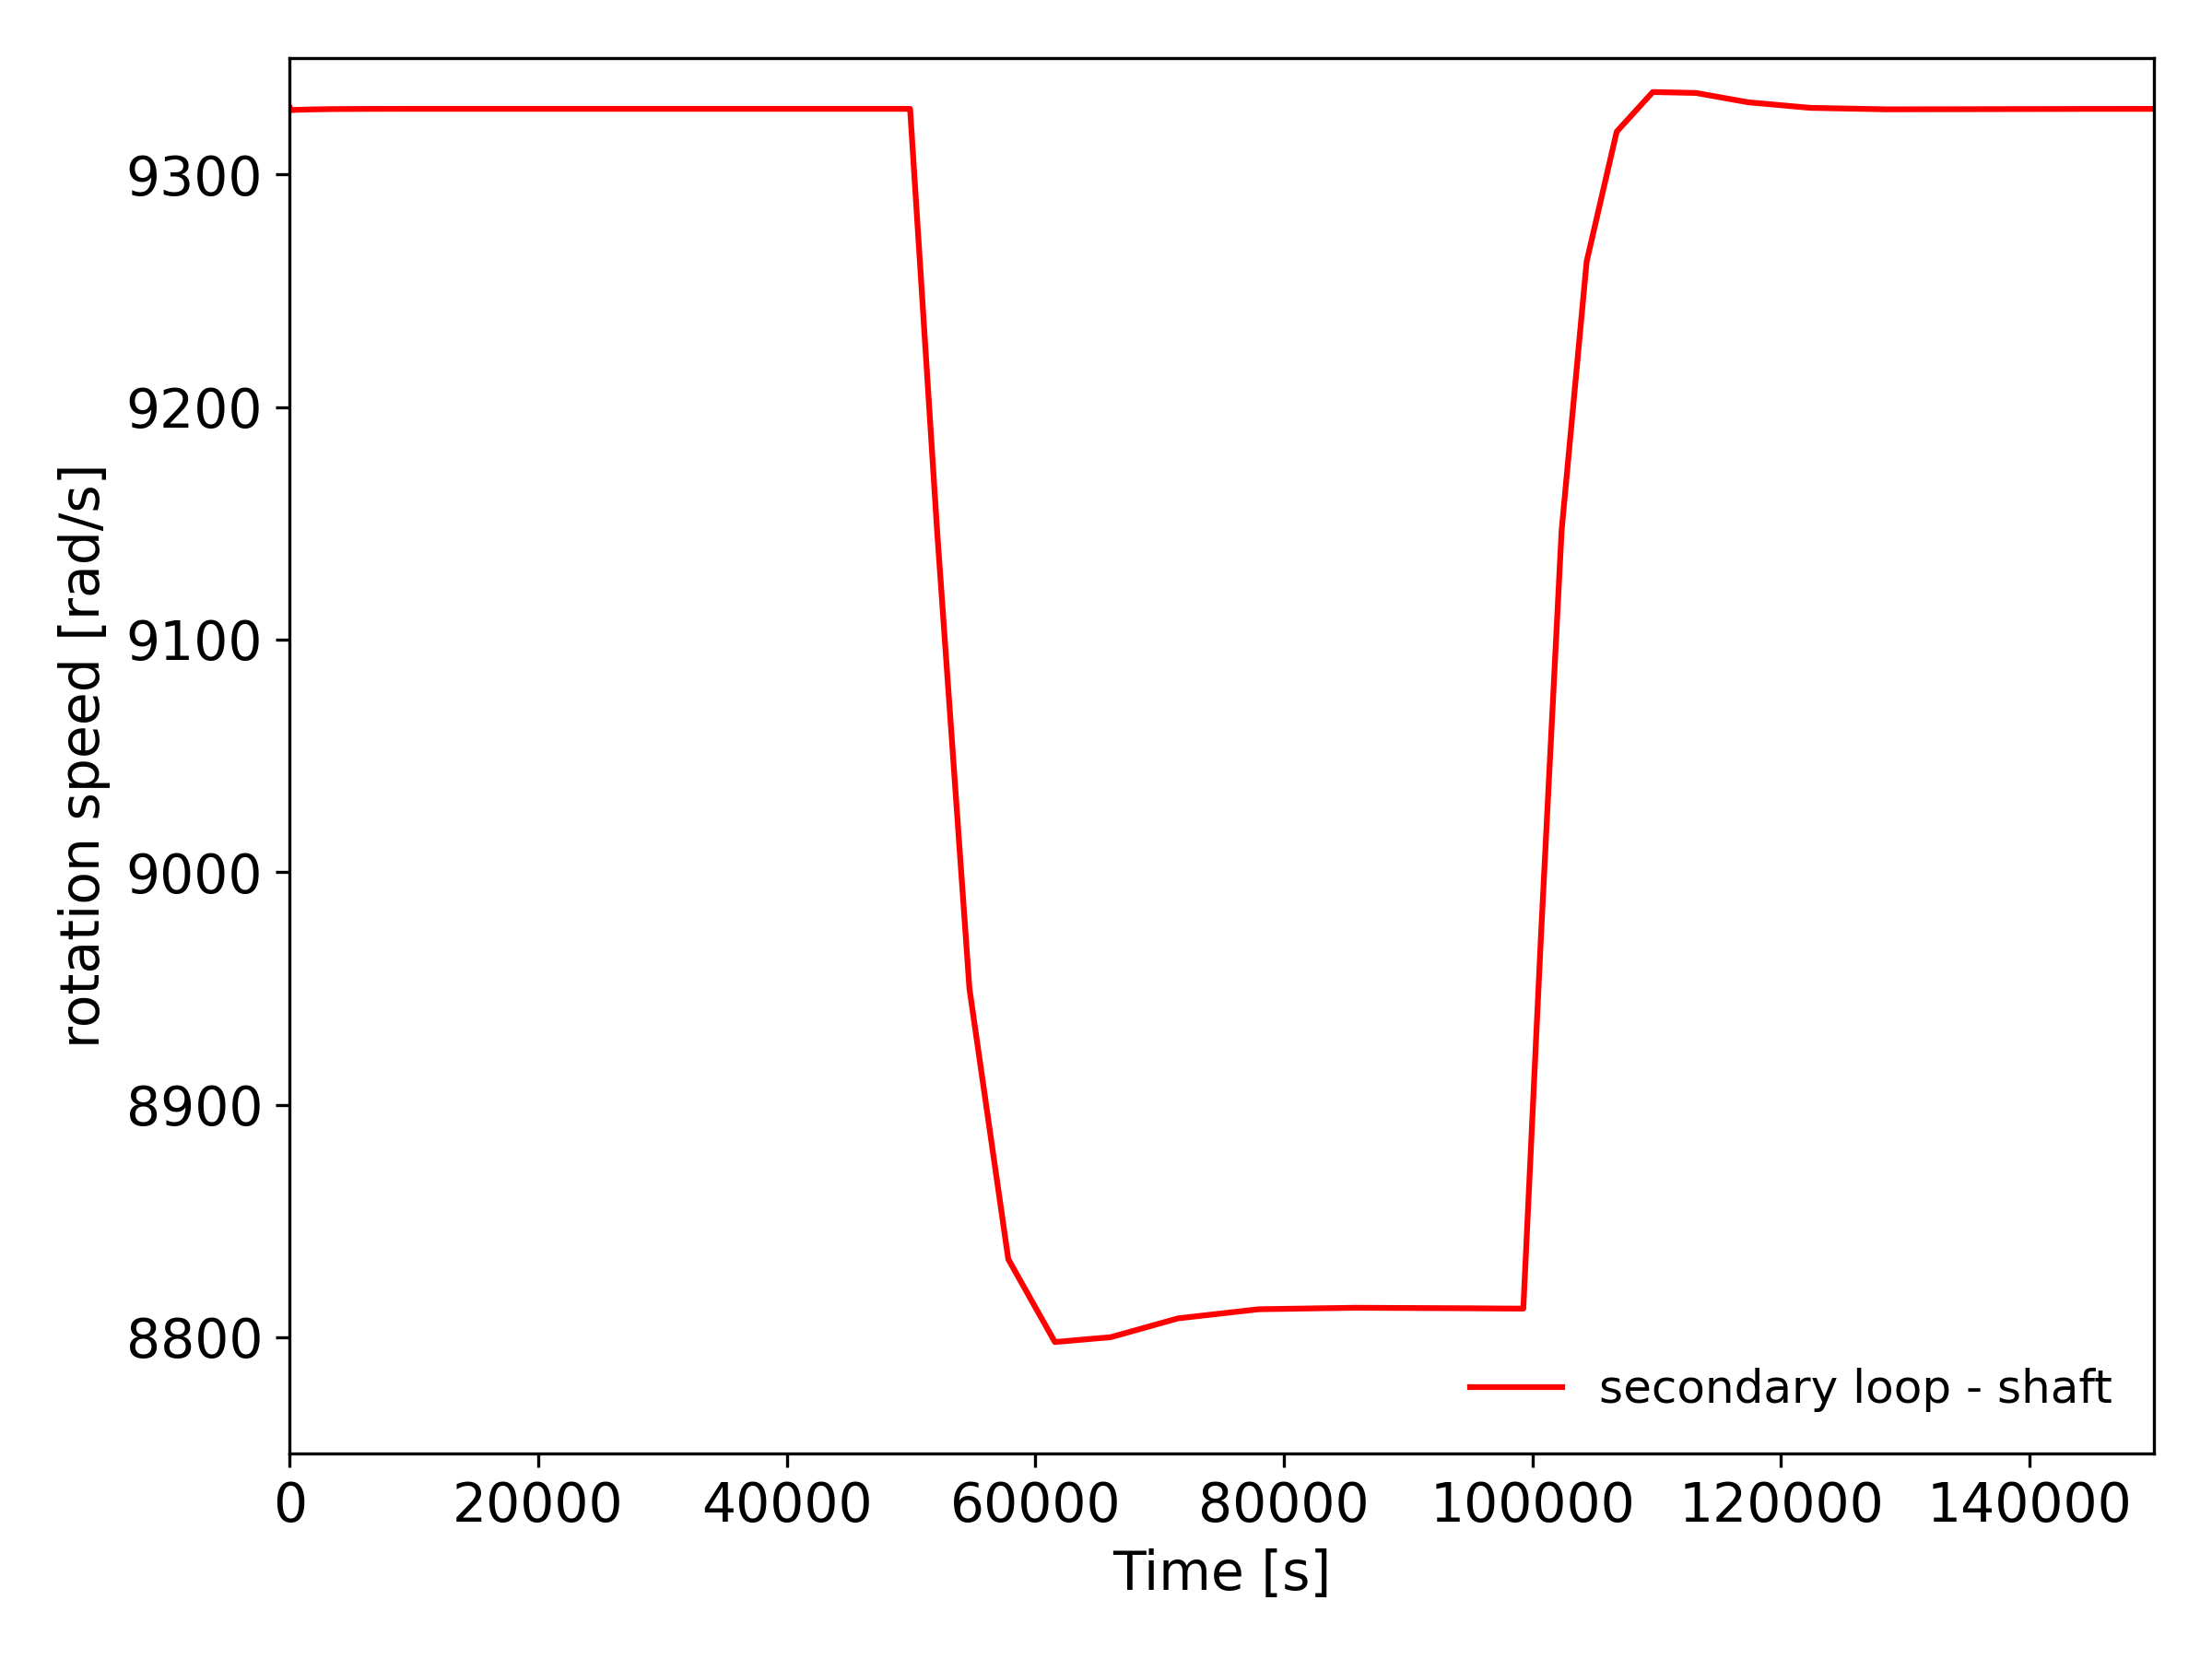
Figure 9: Load follow transient - shaft speed
The mass flow rates are shown in Figure 10 and Figure 11: as expected, the primary mass flow rate undergoes very small effects during the first power modulation. The pressure in the primary loop is in fact maintained by the pressurizer at 90 bar, the only change is about the heat that the fluid receives. By contrast, the secondary mass flow rate diminishes more significantly. Because of the lower power transfer, the temperature and consequently the pressure of the secondary fluid are lower than during the steady state of the previous simulation. Thus, the mass flow rate through the secondary loop becomes lower than what it was before. The second power modulation reaches after the transient step the same state as the initial state.
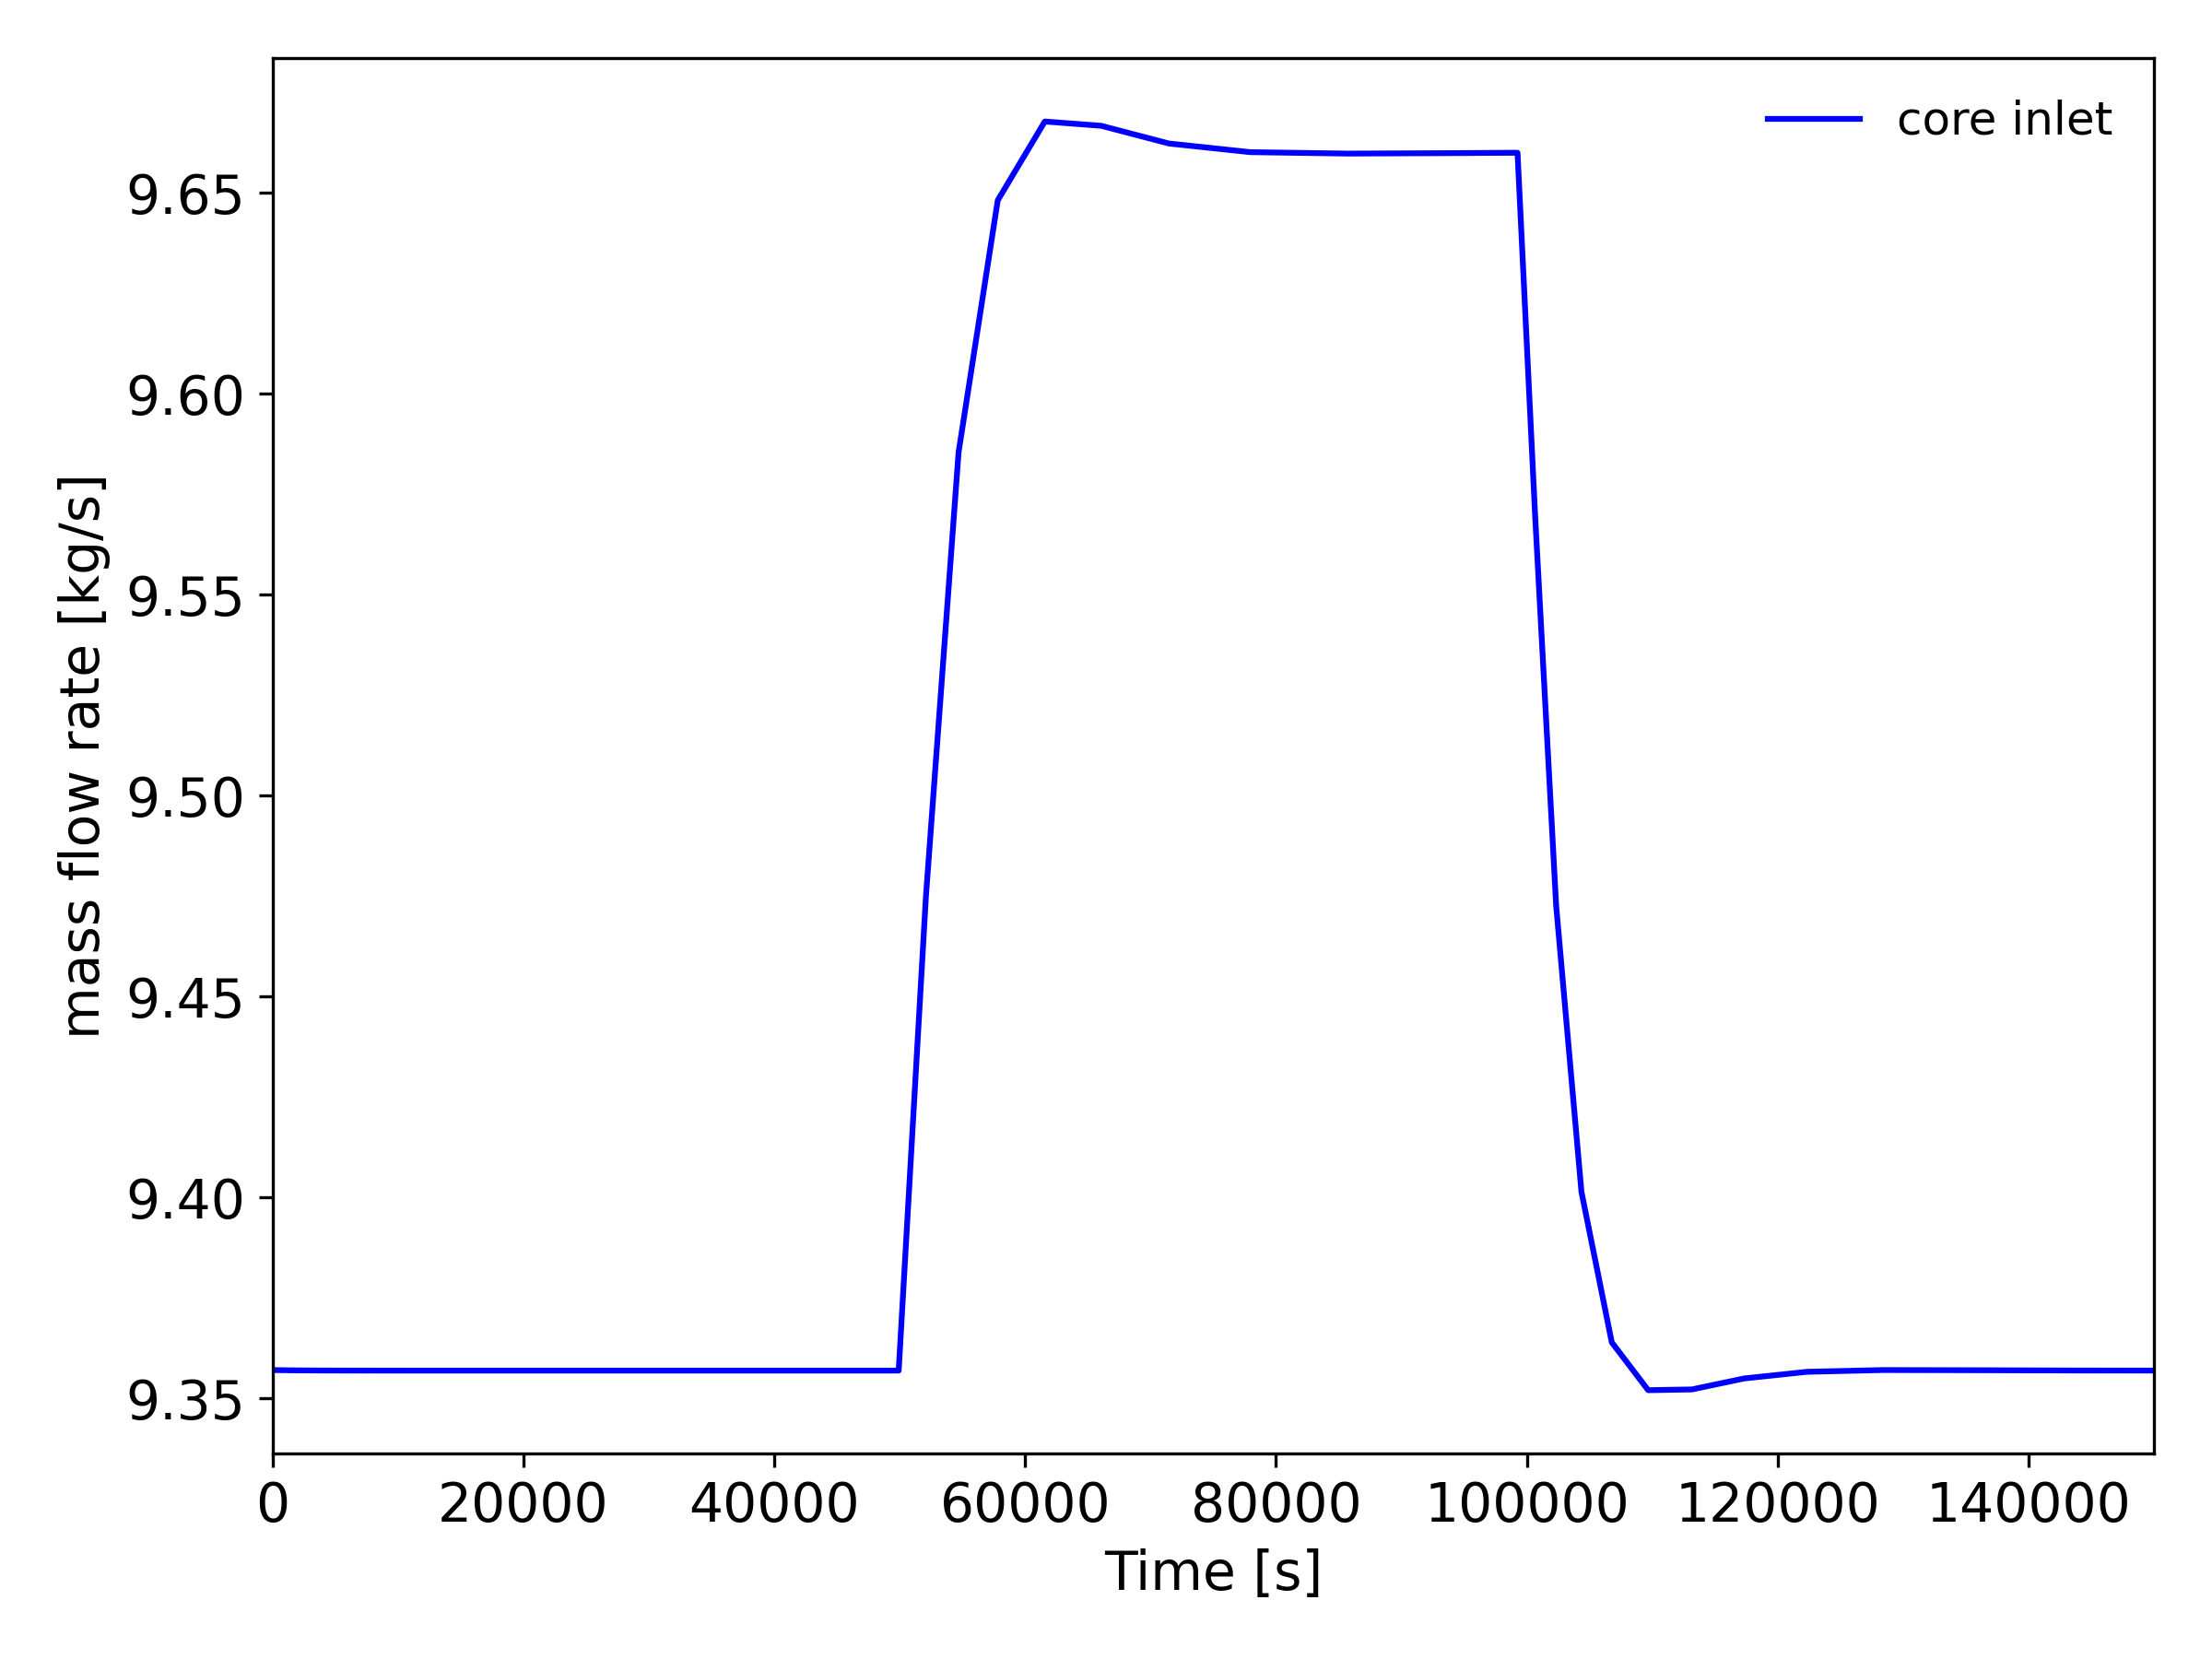
Figure 10: Load follow transient - primary mass flow rate
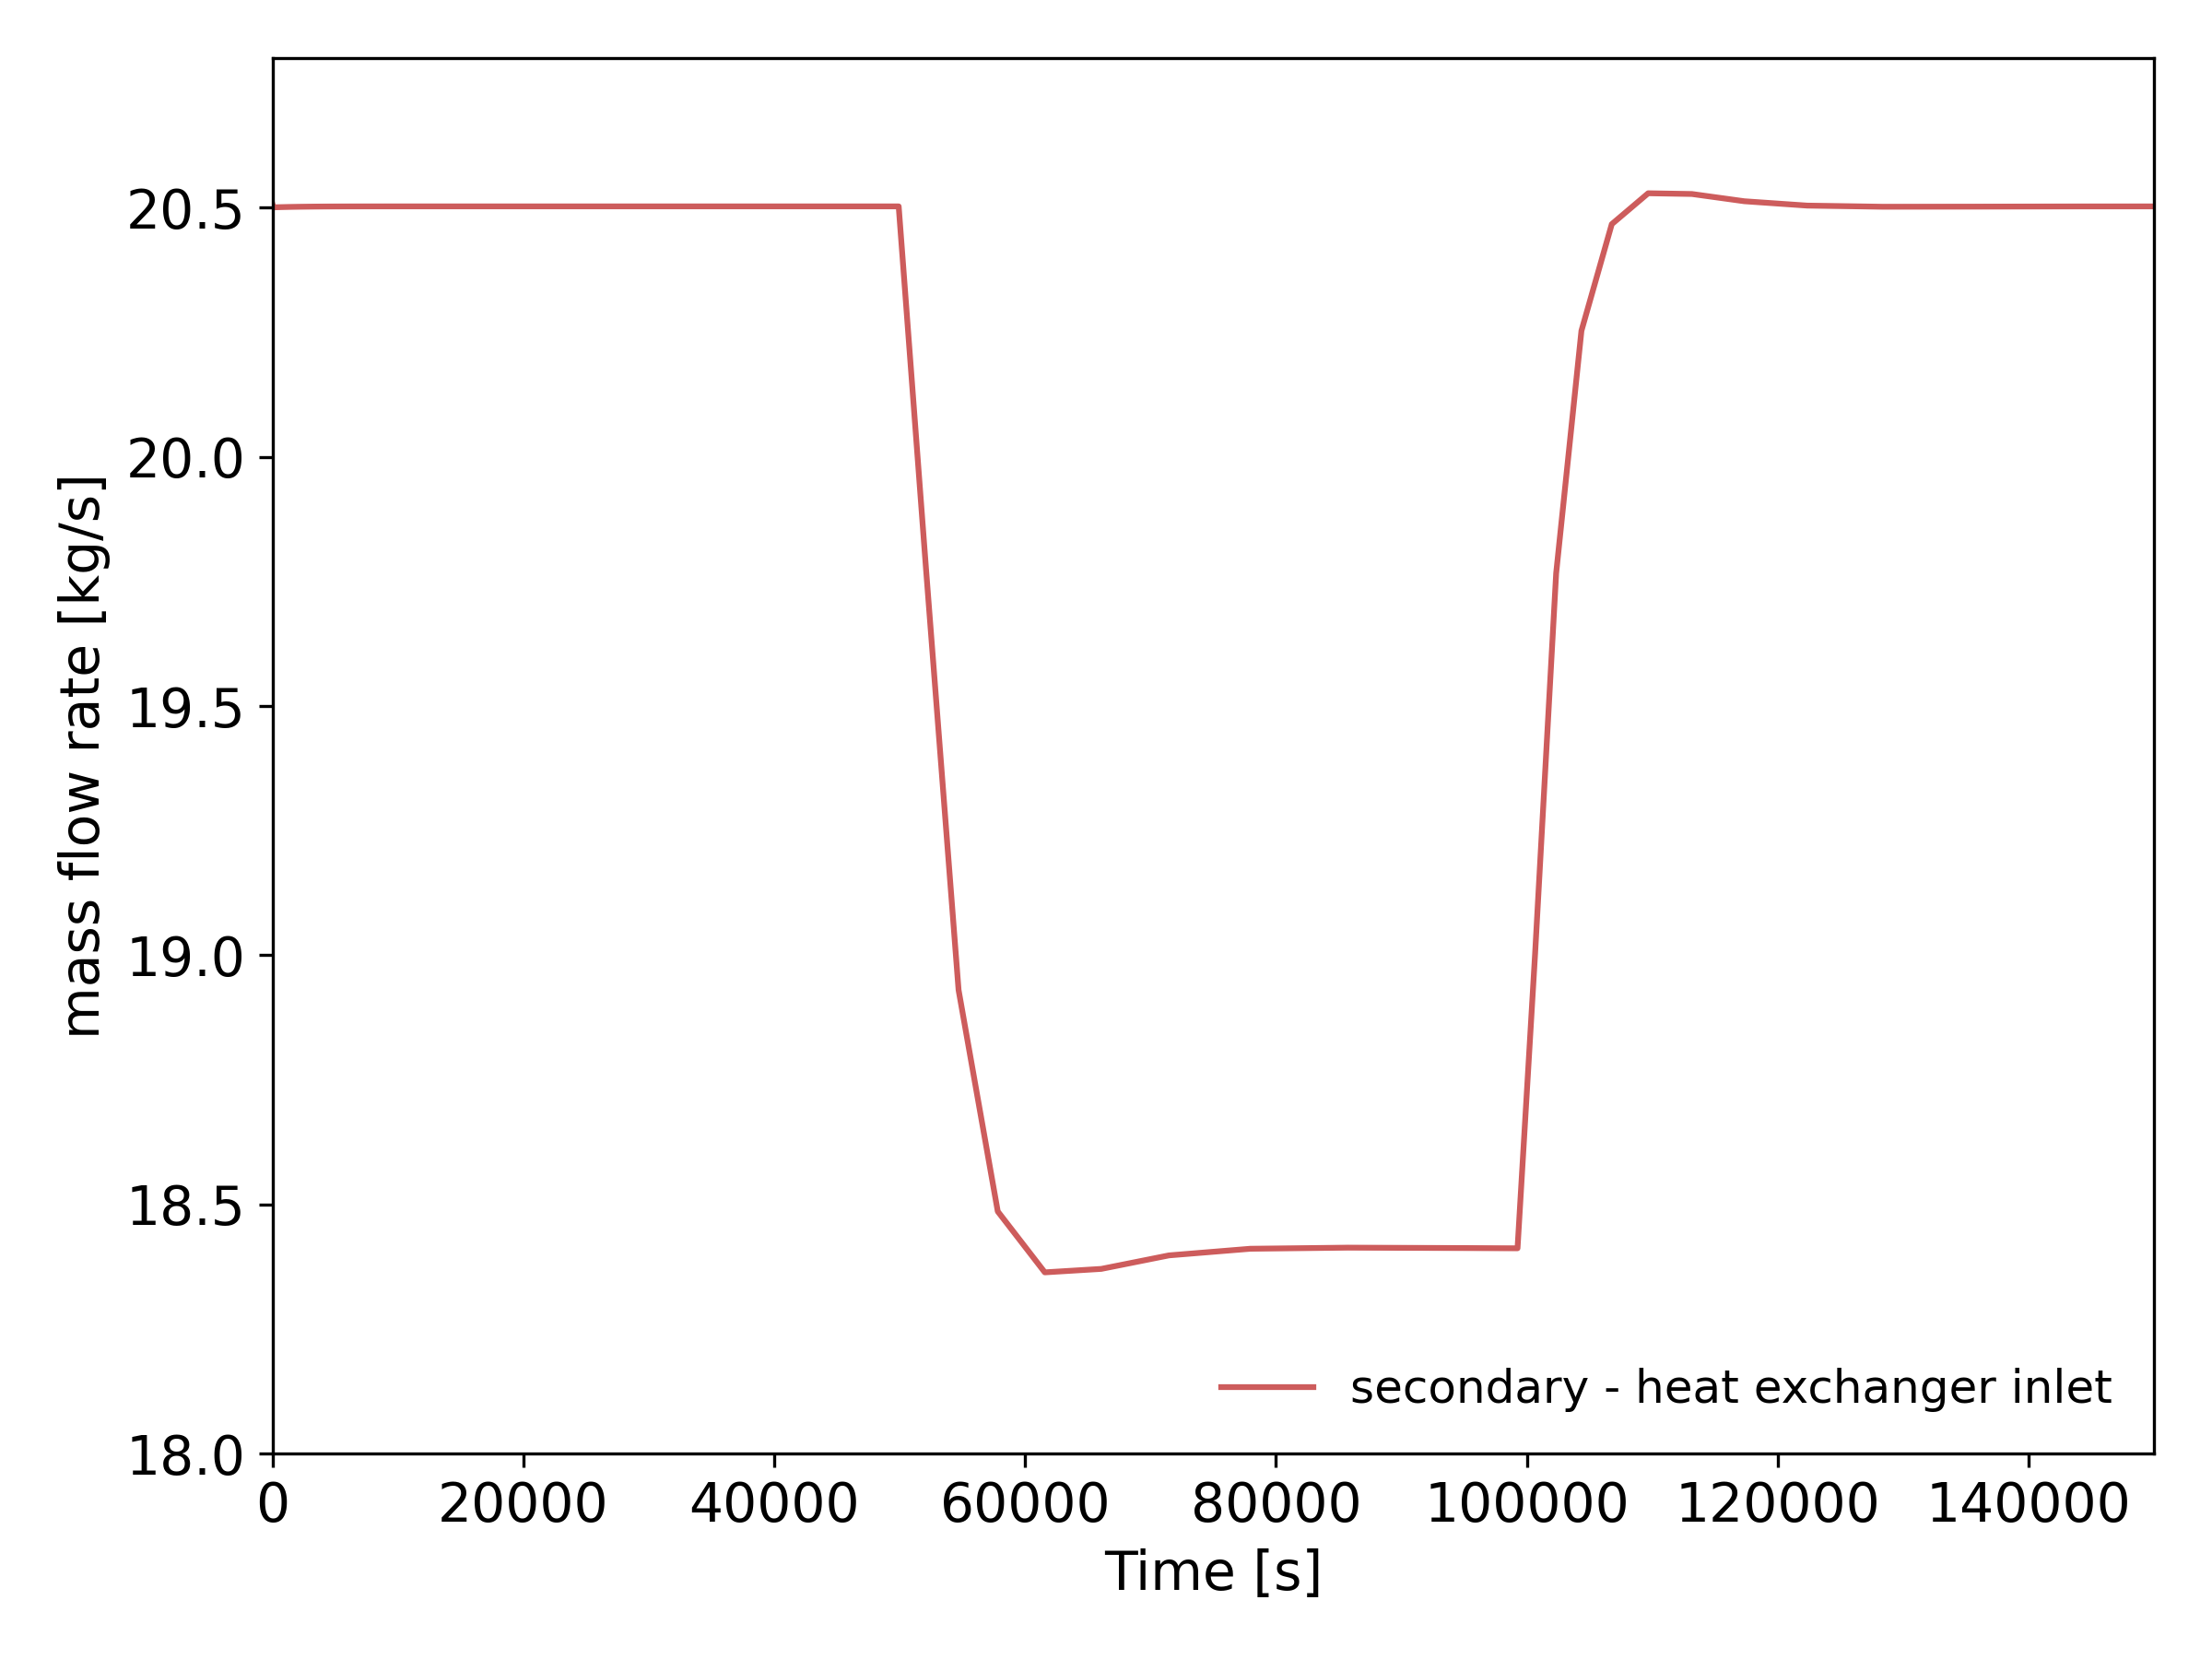
Figure 11: Load follow transient - secondary mass flow rate
The primary pressures are shown in Figure 12: the input power is smaller. Thus, the fluid pressures are a bit lower. Therefore, because of the pressurizer, the pressure variations due to the first modulations are small, and the values stay close to 90 bar. The second power modulation gives after the transient step the same values than the initial ones.
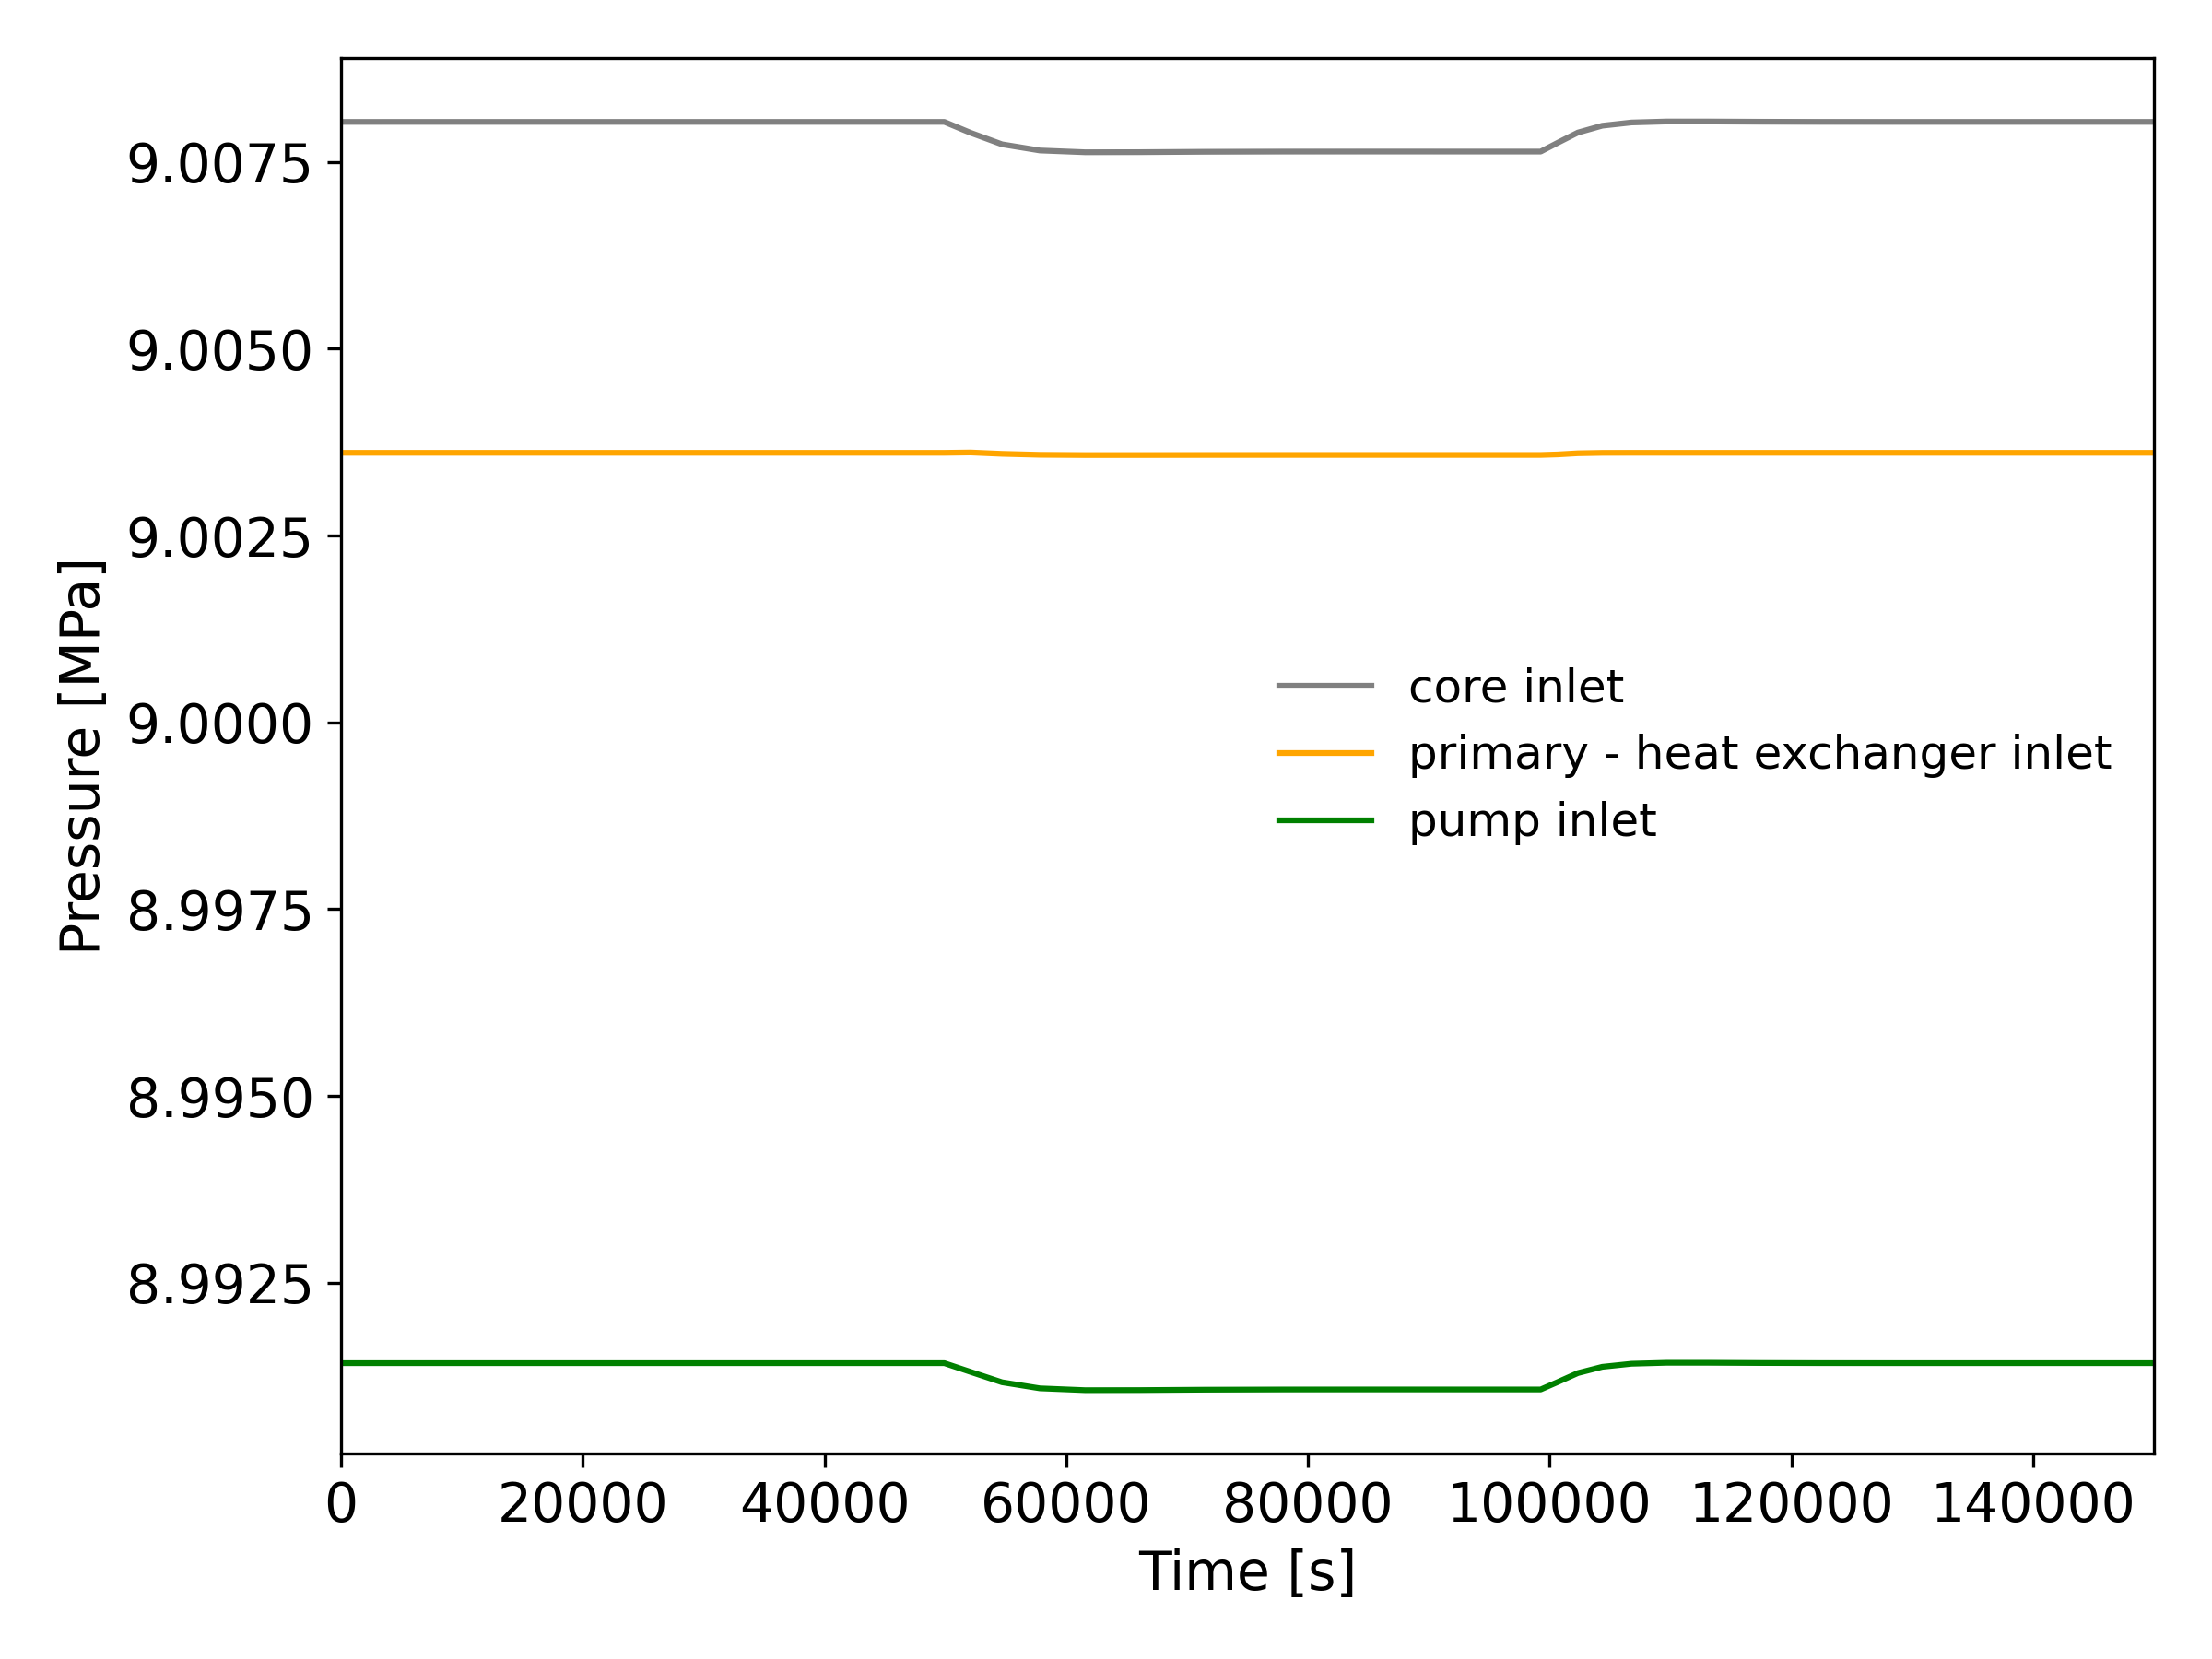
Figure 12: Load follow transient - primary pressures
The secondary pressures are shown in Figure 13: the steady state values after the first modulation are as expected lower than when the core delivers 100% of its nominal power. The pressure out of the compressor is about 5.15 bar and 1.45 bar out of the turbine. Another steady state, equivalent to the initial values, is then obtained after the second modulation.
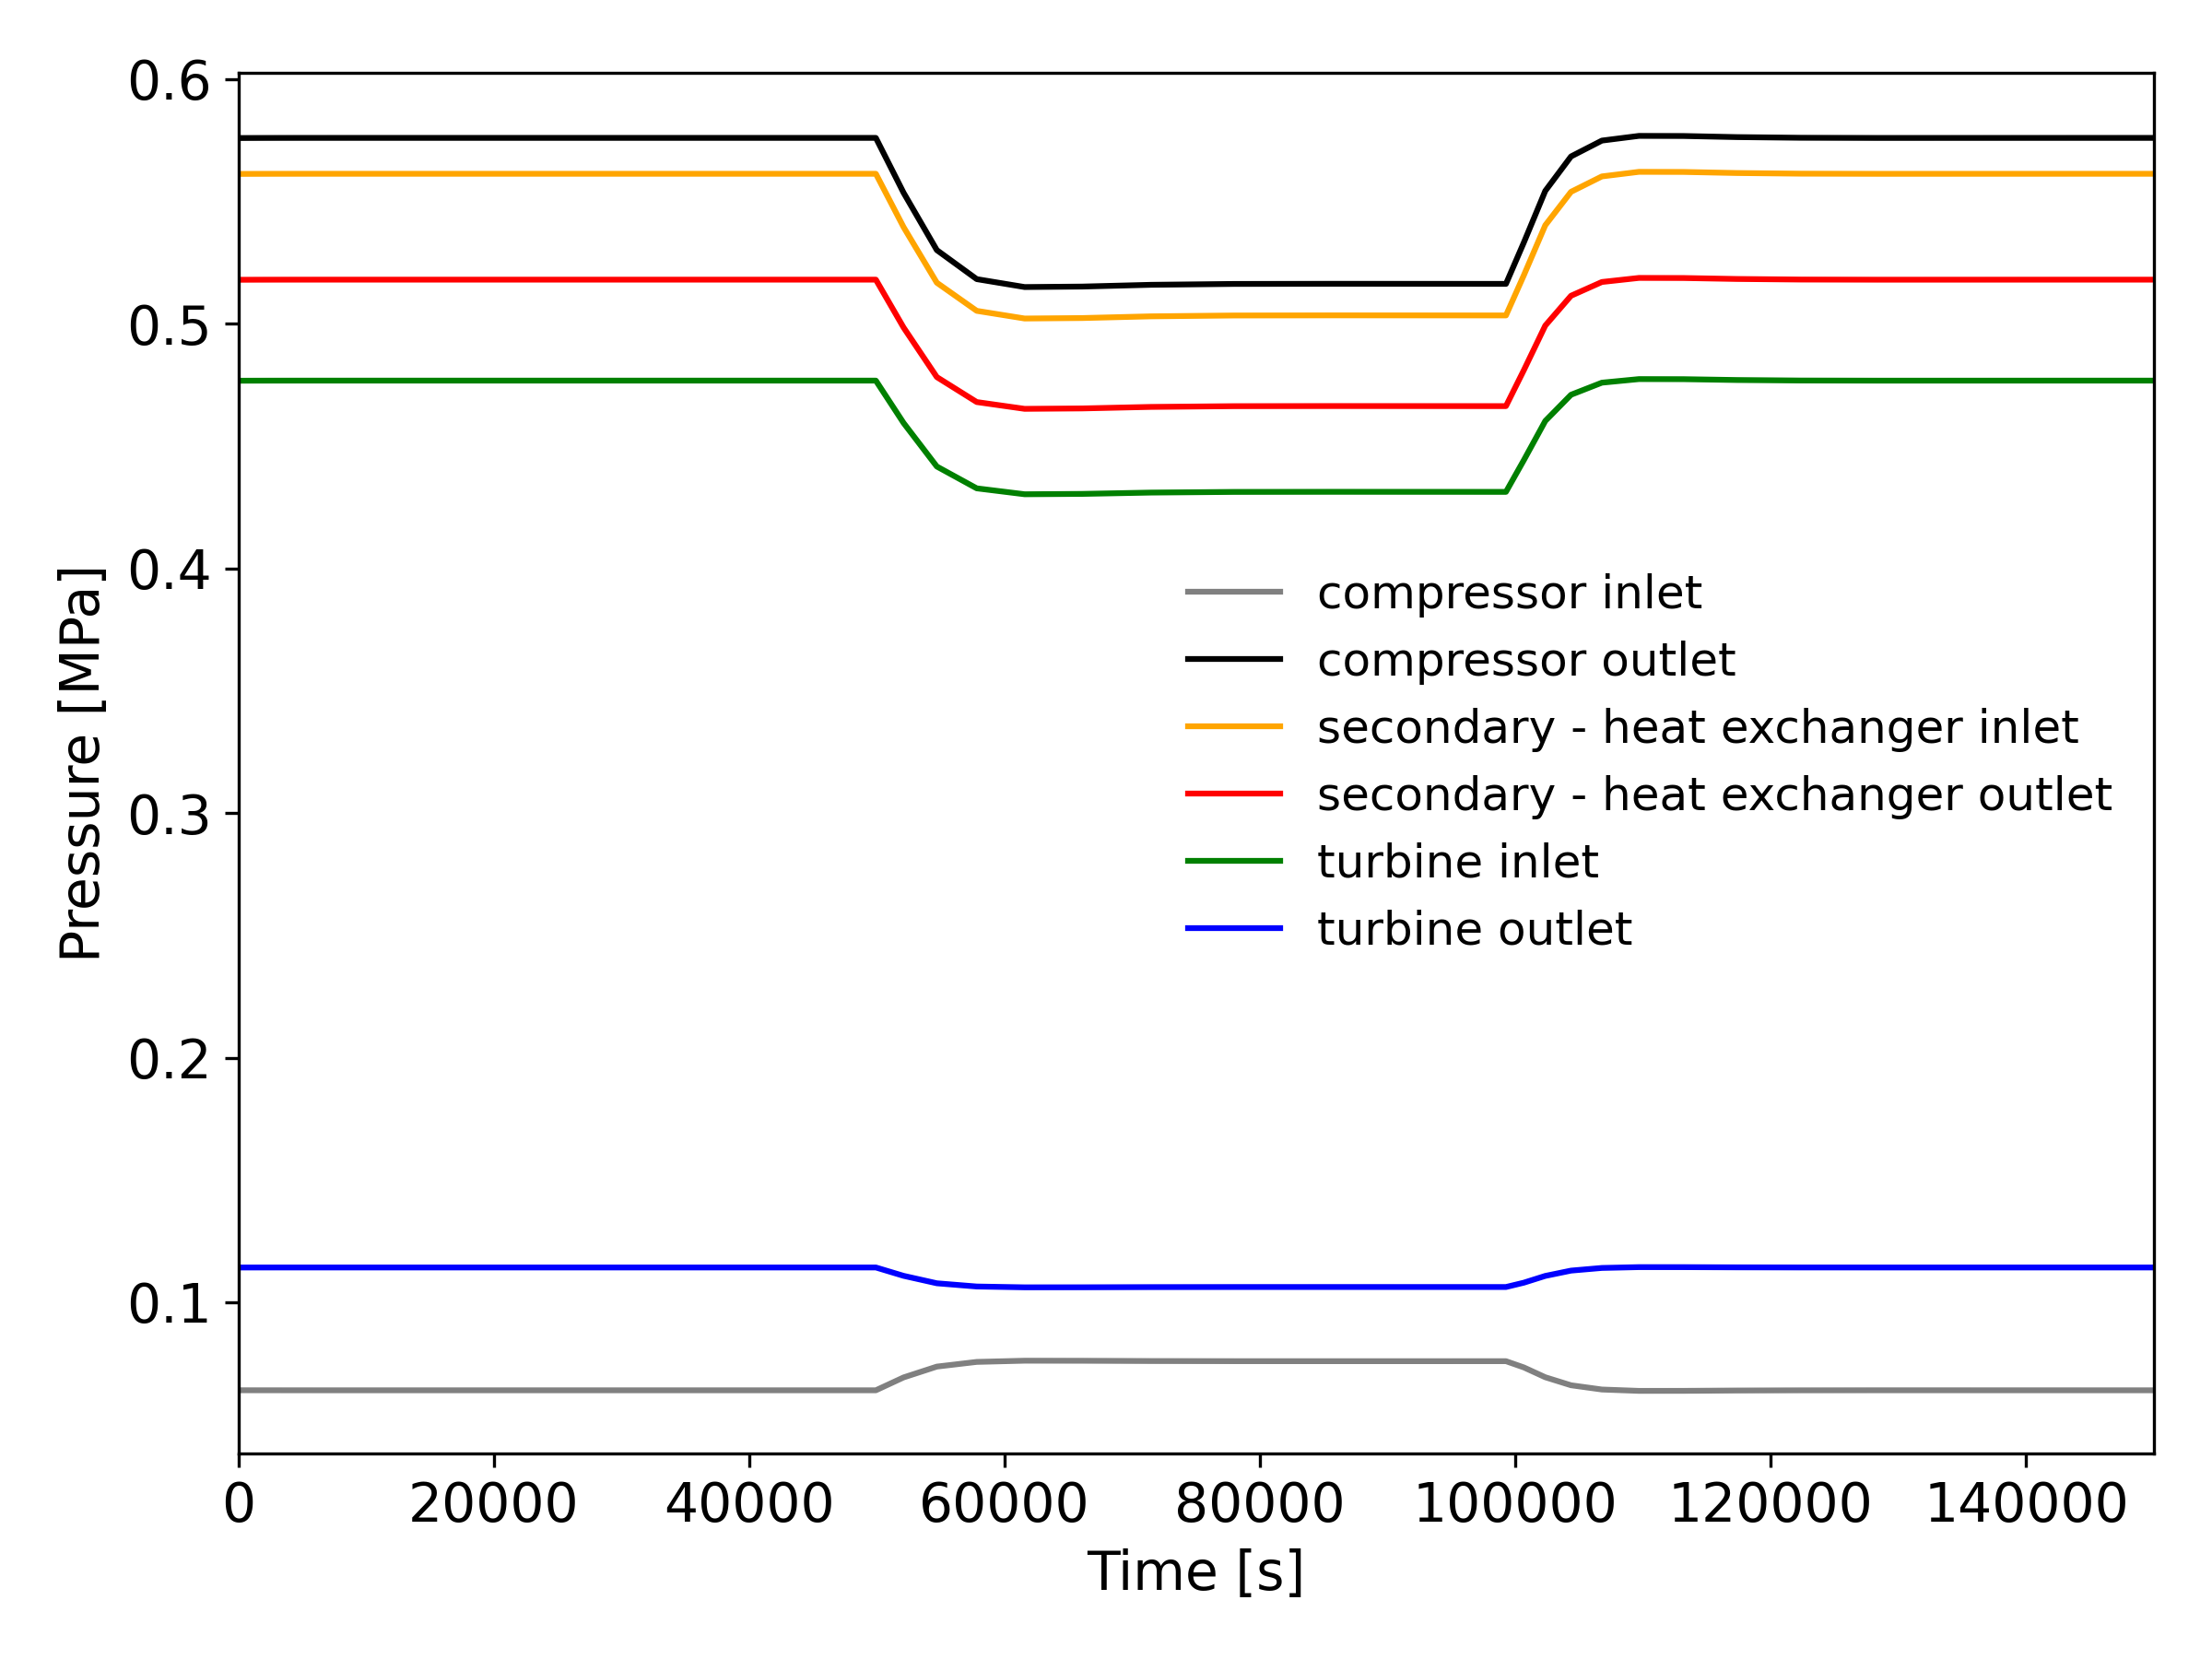
Figure 13: Load follow transient - secondary pressures
The temperatures are shown in Figure 14: once again, a new steady state with lower values is obtained after the first modulation. The helium flow is heated in the core from 855 K to 1090 K and releases this heat to the air flow of the secondary loop in the heat exchanger. Its temperature increases from 480 K to 1080 K. As expected, the inlet temperature on the secondary side of the heat exchanger is about the same. The only effect of the modulation on the air flow before the heat exchanger is in fact due to the compressor, which is on the same shaft than the turbine. The steady state after the second modulation presents as expected the same values than with the initial conditions.
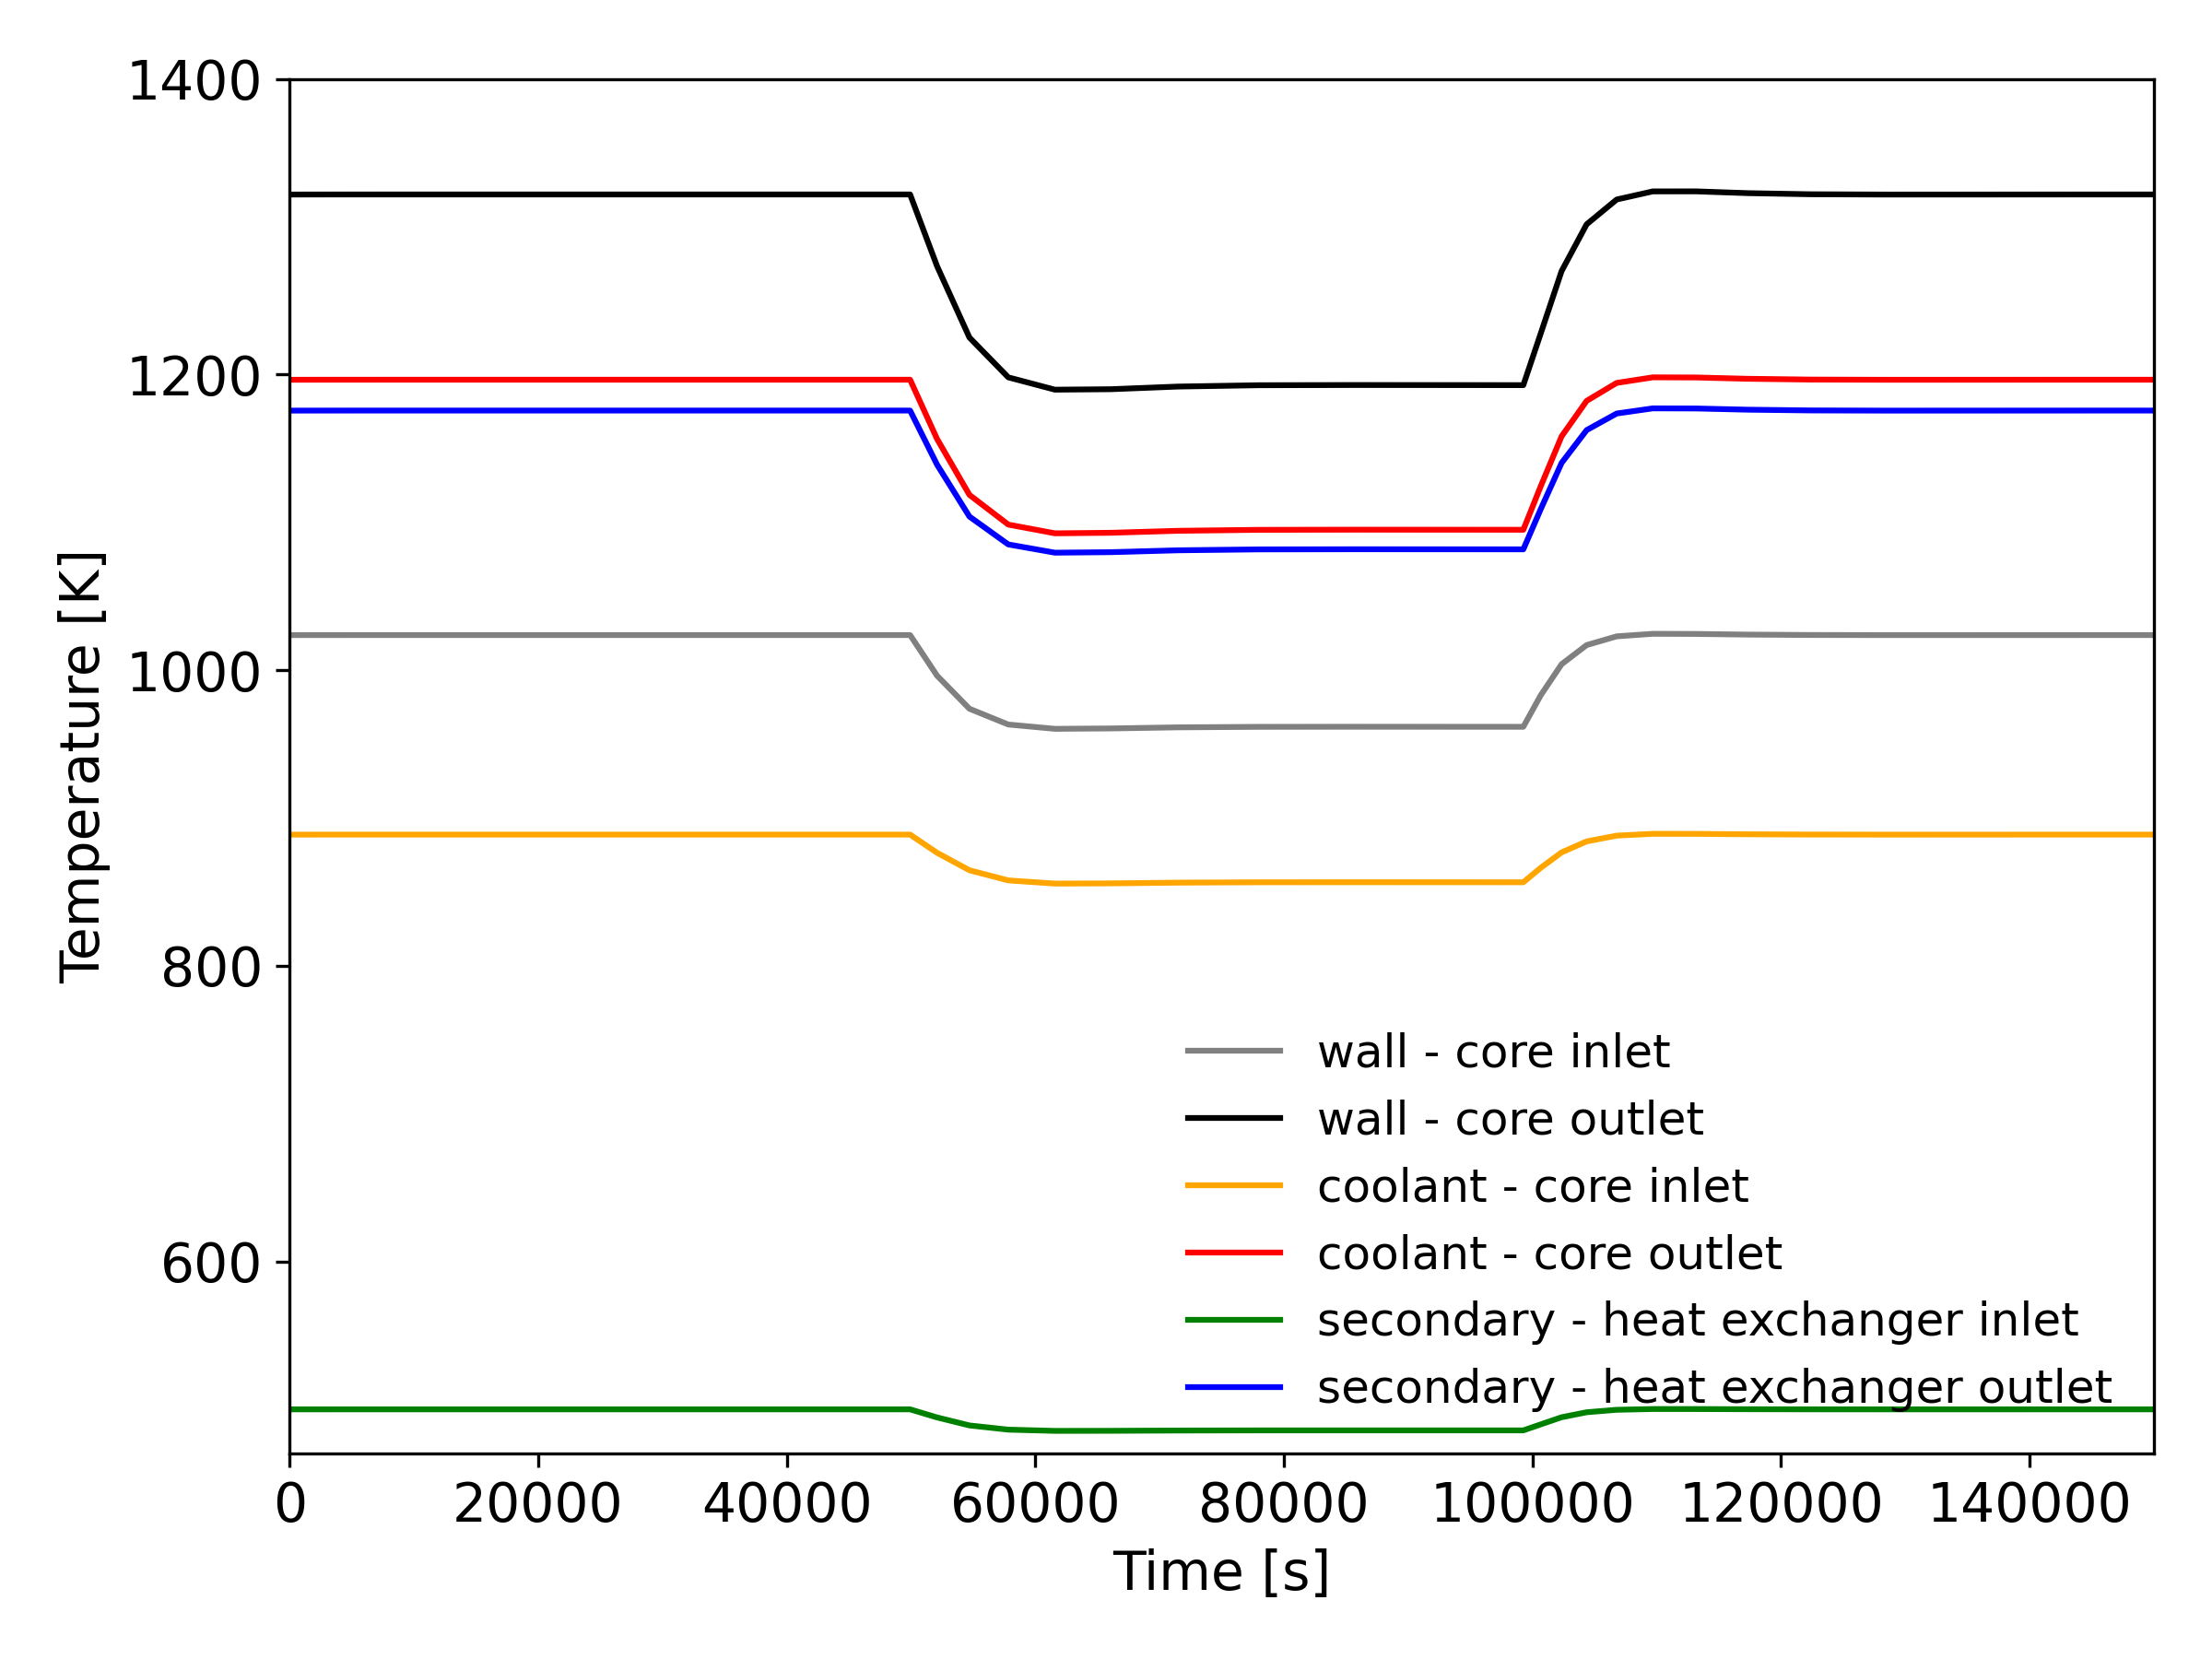
Figure 14: Load follow transient - temperatures
The extracted powers in Figure 15 are equal in the core and in the heat exchanger and reach a steady state at 12 MWth after the first modulation. The generator extracts approximately 1.6 MWe. After 100,000s, a new steady state is also reached with the same values than at the beginning of the simulation.
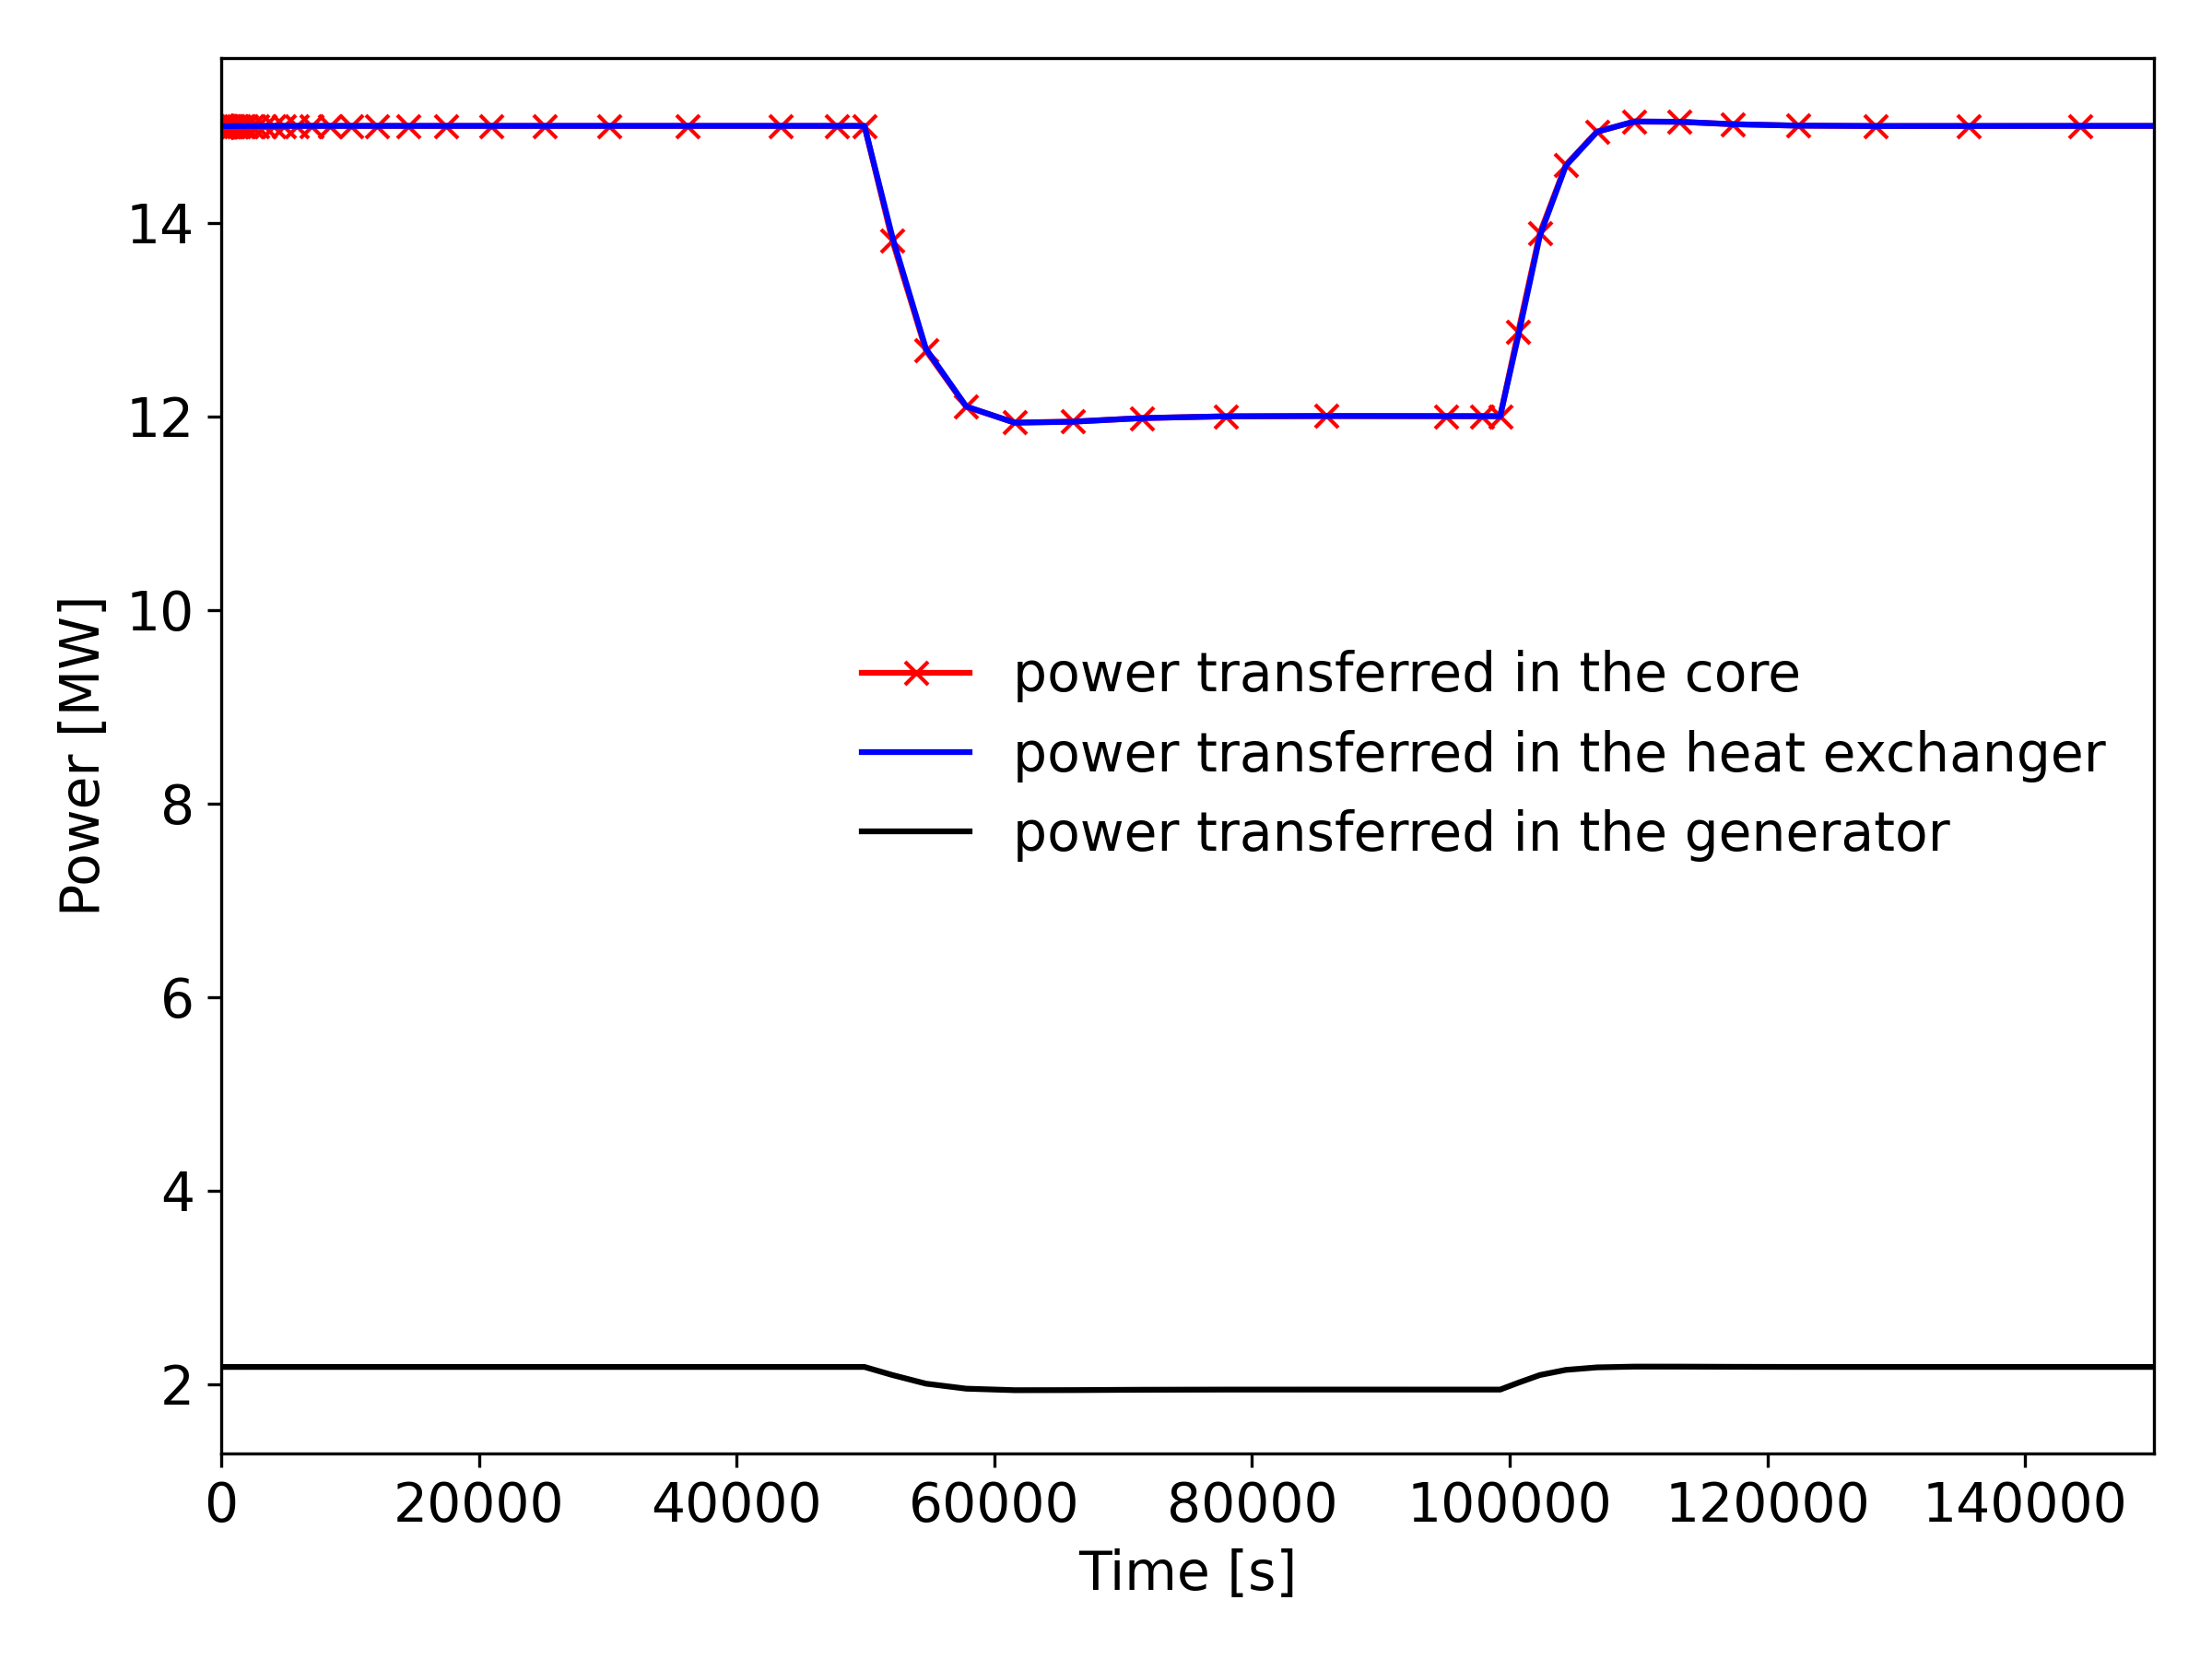
Figure 15: Load follow transient - powers