Pebble Bed Modular Reactor (PBMR) Model Results
The three different models run with Picard iterations until all the variables reach a steady-state condition. An automatic steady-state detection algorithm is used to stop the calculations when the residual changes are below a specified tolerance.
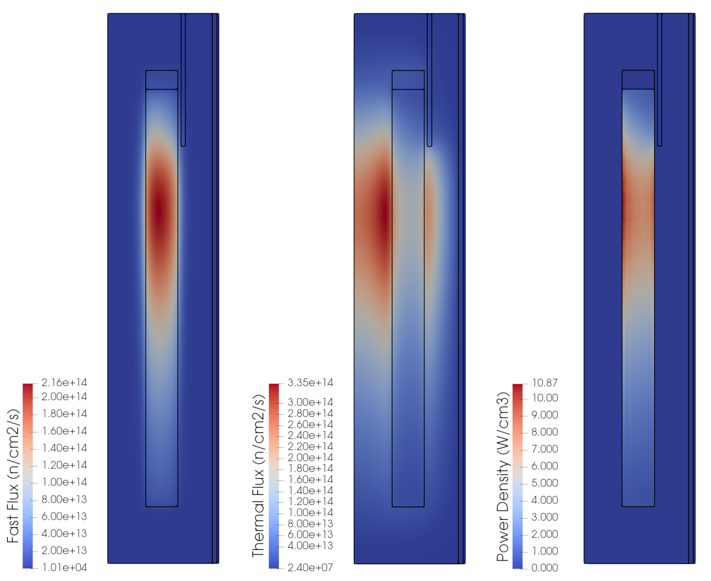
Figure 1: Fast flux, thermal flux, and power density results from the Griffin PBMR 400 model.
The two-dimensional flux and power density profiles are computed by Griffin and are shown in Figure 1. Griffin's results match the physical intuition for PBR's with the fast flux concentrated in the top region where the fuel is cool and the thermal flux reaching its maximum in the central graphite reflector close to the bed. The power density mimics the thermal flux profile, reaching its peak at the top left of the pebble bed, decreasing toward the center of the bed annulus, and increasing again close to the side reflector due to the moderating effect.
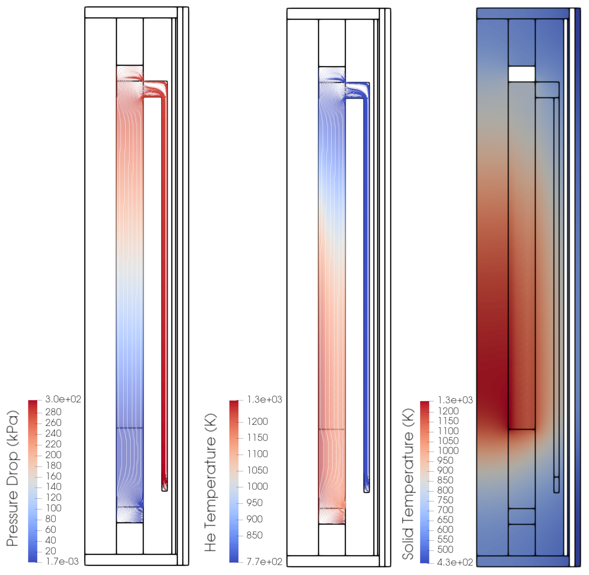
Figure 2: Pressure drop, fluid temperature, and solid temperature results from the Pronghorn PBMR 400 model. Streamlines are shown in white to indicate helium flow.
The steady-state helium pressure, temperature, and velocity streamlines are shown in Figure 2 along with the graphite temperature. The helium temperature increases once it enters into the pebble bed where power is generated. The spatial temperature distribution shows a temperature peak of ~1300K close to the bottom center of the core. The streamlines show how most of the helium flows directly into the bed, with just a small amount flowing into the top cavity. Helium originating from different radial positions in the core mixes in the outlet plenum to produce the average helium outlet temperature. In normal operation, most of the heat generated in the pebble bed is removed by the helium flow. However, the central reflector graphite has no active cooling (this is a benchmark simplification, in reality active cooling is provided): therefore, its temperature is at least 500K higher than the rest of the graphite in the core.
After the steady-state calculations, a Pressurized Loss of Forced Cooling (PLOFC) is performed using the following event sequence:
* 0-13s: A reduction in reactor inlet coolant mass flow rate from the nominal 192.7 kg/s to 0.0 kg/s over 13 seconds. The mass flow ramp is assumed linear; a reduction in reactor helium outlet pressure from the nominal 90 bar to 60 bar in 13 seconds.
* 13-16s: All control rods are fully inserted over 3 seconds to SCRAM the reactor.
* 16-180,000s: No change in input parameters (50hr).
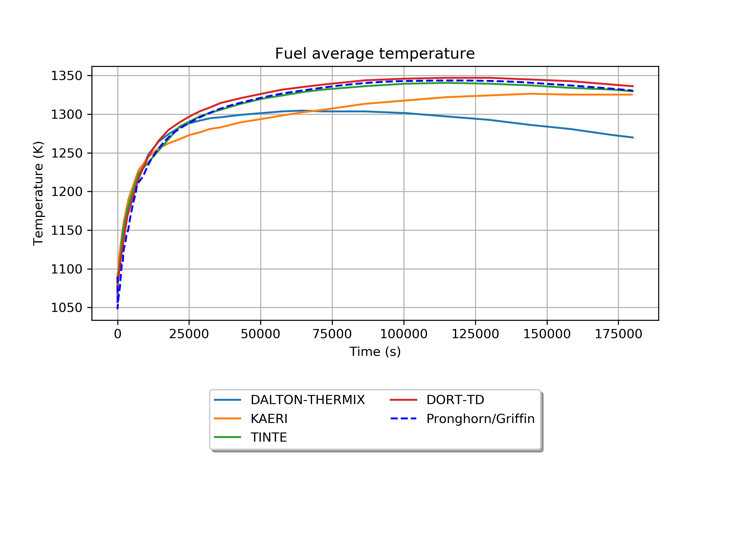
Figure 3: Average fuel temperature over time during the PLOFC transient between various codes.
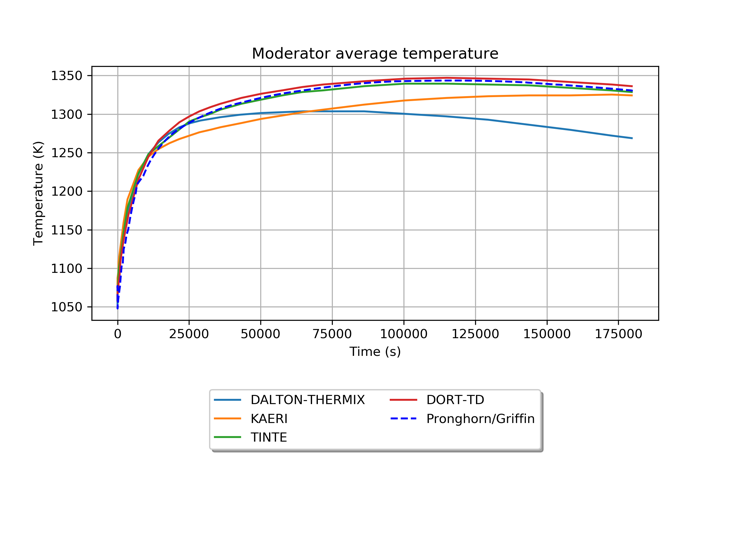
Figure 4: Average moderator temperature over time during the PLOFC transient between various codes.
The results from this transient can be found in Figure 3 and Figure 4. Both moderator and fuel average temperature start to increase after the reactor shutdown since there is no more active flow cooling the reactor. The only mechanism for heat removal is the less efficient heat transfer through the outer reflector/barrel/RPC/cavity/RCCS. The temperatures reach their maximum around 100,000s (~28hr) and then start to decrease thanks to a reduction of the generated decay heat. As shown in the figure above, the fuel average temperature and the moderator average temperature results are in the range of the other participant solutions confirming that the Pronghorn/Griffin coupled model is consistent with legacy codes developed explicitly for PBRs.