LEU Fuel Pulse Results
Contact: Adam Zabriskie, [email protected]
Results
Each of the input files outputs a .csv (CSV) and a .e (ExodusII) file containing various calculated values for power, temperature, power density, and so on. These results are from the macroscale simulation outputs.
The power and energy of the 4.56 % k/k pulse over time are shown in Figure 1 and Figure 2, respectively.
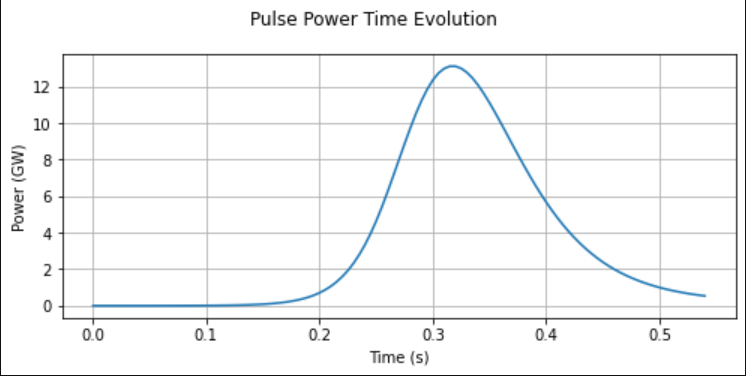
Figure 1: Pulse Power Over Time
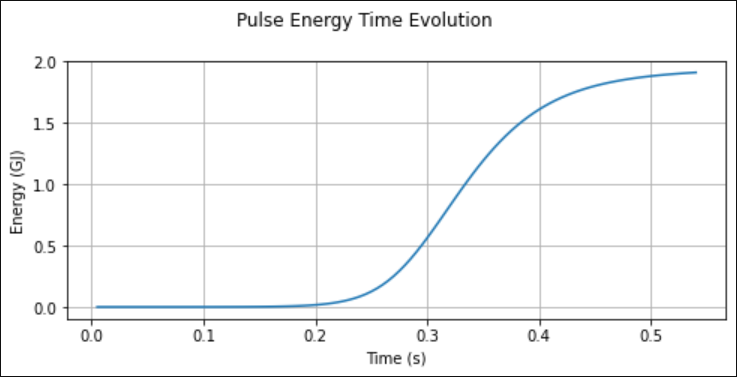
Figure 2: Pulse Energy Over Time
The pulse's power peaks at over 12 GW around 0.325 seconds into the simulation, and its energy peaks at over 17 GW by the end of the simulation at 0.54 seconds.
The fuel grain and moderator shell average temperatures are shown in Figure 3 and Figure 4, respectively.
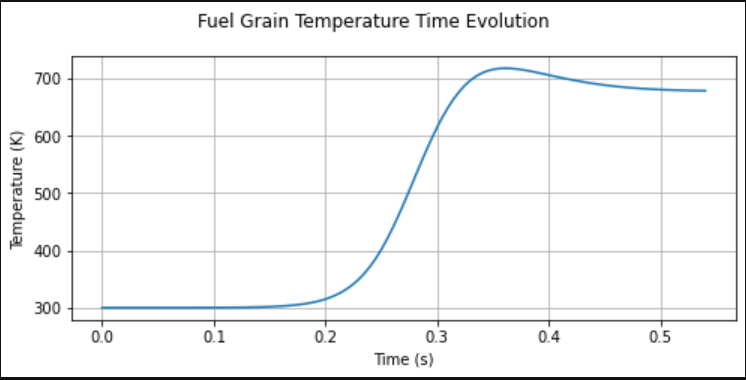
Figure 3: Fuel Grain Temperature Time Evolution
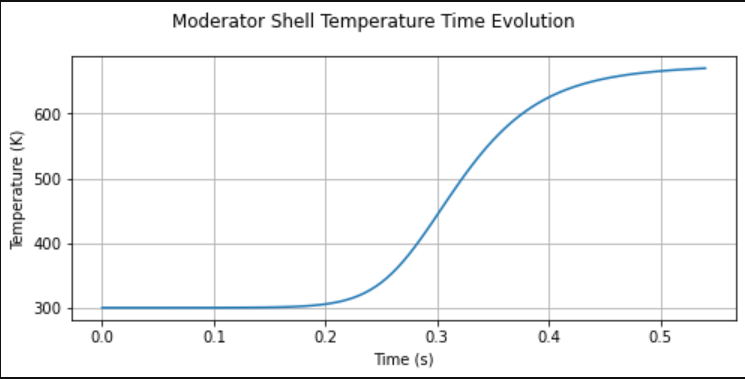
Figure 4: Moderator Shell Temperature Time Evolution
For a more detailed discussion of the results, see (Zabriskie, 2019).
References
- Adam X. Zabriskie.
Multi-Scale, Multi-Physics Reactor Pulse Simulation Method with Macroscopic and Microscopic Feedback Effects.
PhD thesis, Oregon State University, Corvallis OR, 2019.[BibTeX]