High Temperature Engineering Test Reactor (HTTR) Steady State Multiphysics Model Results
The model, even with its modeling approximations, reproduces relatively well the measured excess reactivity, axial flux distribution, shutdown margin, and axial and radial power distribution Labouré et al. (2022). The multiplication factor of this model was calculated to be 1.0123, which is satisfactory as the uncertainties in the graphite composition are very high, Bess and Fujimoto (2014).
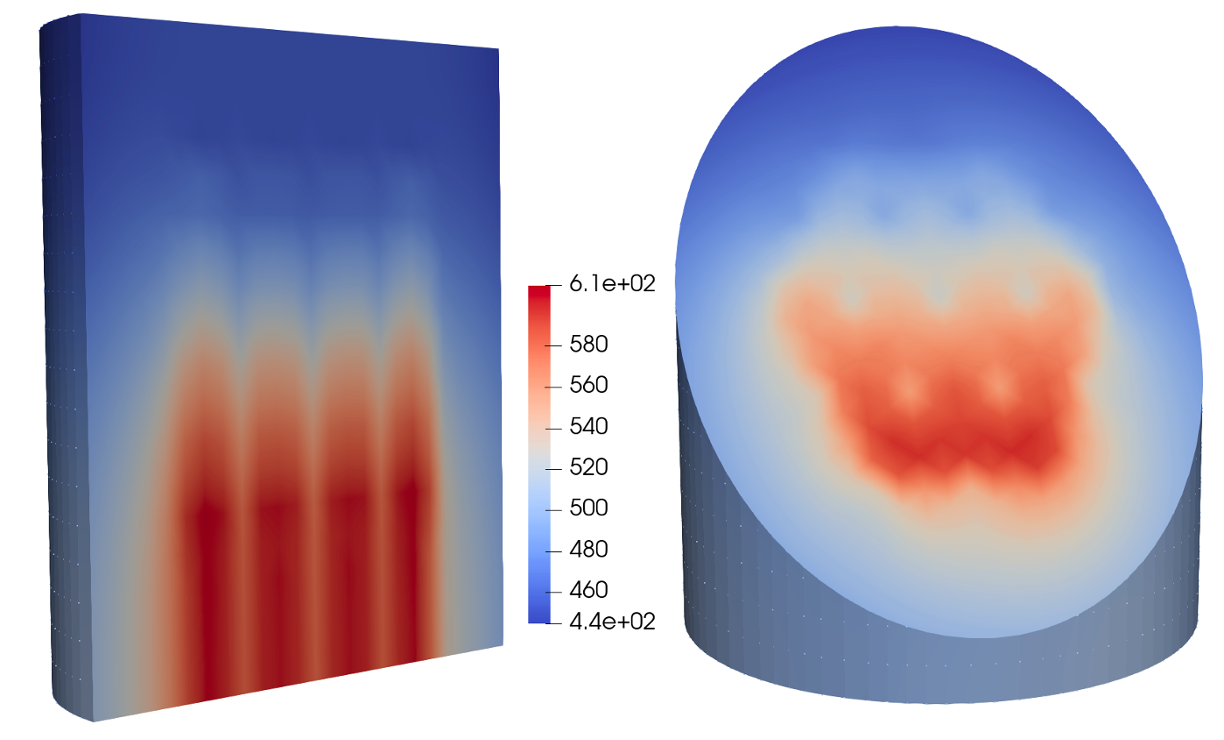
Figure 1: Moderator temperature distribution (K) of the HTTR Steady State Model.
Figure 1 shows higher temperatures at the bottom of the core, due to the cold helium flowing from the top of the reactor core through the cooling channels down to the bottom of the reactor core. The cold helium cools the graphite. The helium heats up as it flows towards the bottom, leaving the graphite at the bottom of the core much hotter.
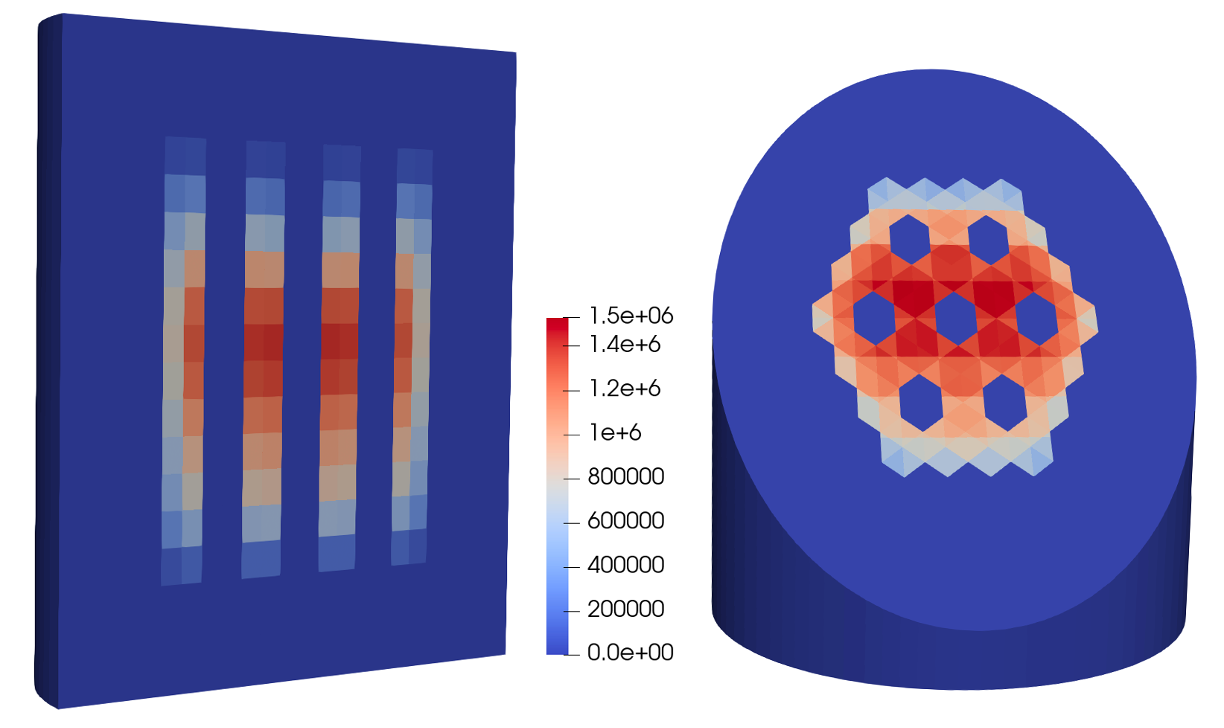
Figure 2: Power Density distribution (W/m) of the HTTR Steady State Model.
Figure 2 shows peaks in power at the center of the core and dips in power at the radial periphery of the hexagonal core layout, specifically close to the control rods. The control rods are responsible for some neutron absorption, causing a lower fission power.
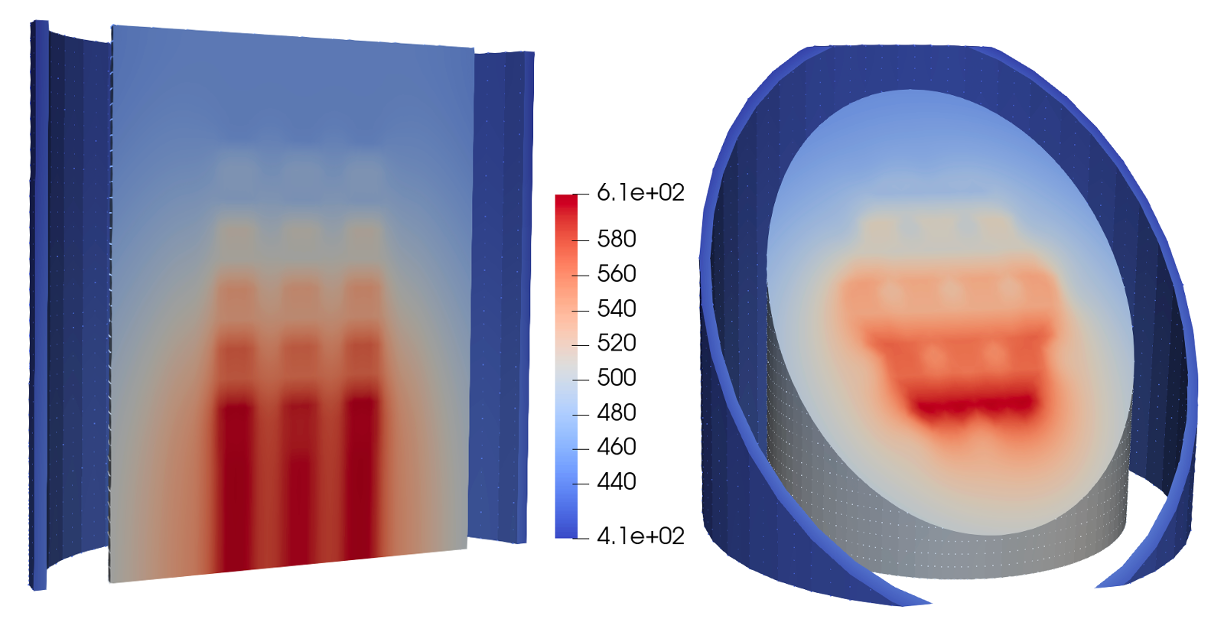
Figure 3: Fuel blocks temperature distribution of HTTR Steady State Model (K).
Figure 3 shows a higher temperature at the bottom of the core than at the top. Again, this is due to the cold helium flow from the top of the core, through the cooling channels, to the bottom of the core. Five squares can vaguely be seen in the left-hand section of the figure; these are the five fuel pins, varying from cooled to hotter as the helium flows through the fuel columns. The portion of the fuel columns that are traversed by the helium flow are effectively cooled. The fuel temperature field is extrapolated outside of the fueled portion of the core in order to be able to evaluate reflector cross sections that depend indirectly on the fuel temperature in the tabulation. Radially, fuel regions of high power correlate to higher fuel temperature.
References
- John D. Bess and Nozomu Fujimoto.
Benchmark evaluation of start-up and zero-power measurements at the high-temperature engineering test reactor.
Nuclear Science and Engineering, 178(3):414–427, 2014.
URL: https://doi.org/10.13182/NSE14-14, arXiv:https://doi.org/10.13182/NSE14-14, doi:10.13182/NSE14-14.[BibTeX]
- Vincent M. Labouré, Matilda Anna Elisabeth Åberg Lindell, Javier Ortensi, Gerhard Strydom, and Paolo Balestra.
FY22 Status Report on the ART-GCR CMVB and CNWG International Collaborations.
Technical Report, Idaho National Laboratory, 2022.
doi:10.2172/1893099.[BibTeX]