ver-1ha
Convective Gas Outflow Problem
Problem set up
This verification problem models a species '' (gaseous tritium) flowing through a system of three enclosures. It recreates the ver-1h case in Longhurst et al. (1992) and ver-1ha in Ambrosek and Longhurst (2008), and it has been updated and extended in Simon et al. (2025). Gas flows from enclosure 1 into enclosure 2, and then from enclosure 2 into 3. Enclosure 1 is defined as a boundary enclosure, so it is held at a constant pressure , and the flow of gas into enclosures 2 and 3 can be given by (1)
where Q is the volumetric flow rate, and is the concentration of gas molecules in the previous enclosure.
As gas flows through the system, the number of atoms of the gas entering the second and third enclosures is greater than the number exiting. The difference in pressures between two neighboring enclosures determines the net rate of gas flowing into the enclosure. The rate of change of the pressure of gas in the second and third enclosures is given as (2) (3)
We solve these time evolution equations for and using TMAP8 with the time and with the initial condition set to . We use m, Pa, and m/s.
Analytical solution
The analytical solution to the equations Eq. (2) and Eq. (3) is (4) and, if , (5) If and are not equal, (6)
In this analytical verification we use the equal volume solution Eq. (5), with the same values for the other parameters as used in the TMAP8 solution. Note that the TMAP4 verification case provides the initial value of , but plots the solutions as gas concentrations instead, and also only plots the solution up to 20 s Longhurst et al. (1992). The pressure calculations from TMAP8 and the analytical solutions are converted to concentration using the ideal gas law as where is the concentration in atoms/m, is Avogadro's constant, is the gas constant, and K is the temperature of the system Longhurst et al. (1992). The values of and are taken from the Physical Constants.
Results and comparison against analytical solution
The comparison of TMAP8 results against the analytical solution is shown in Figure 1 and Figure 2. The match between TMAP8's predictions and the analytical solution is satisfactory, with root mean square percentage errors (RMSPE) of 0.06 % for both the 2 and 3 enclosures. The RMSPE value is the same for the concentration and pressure comparisons.
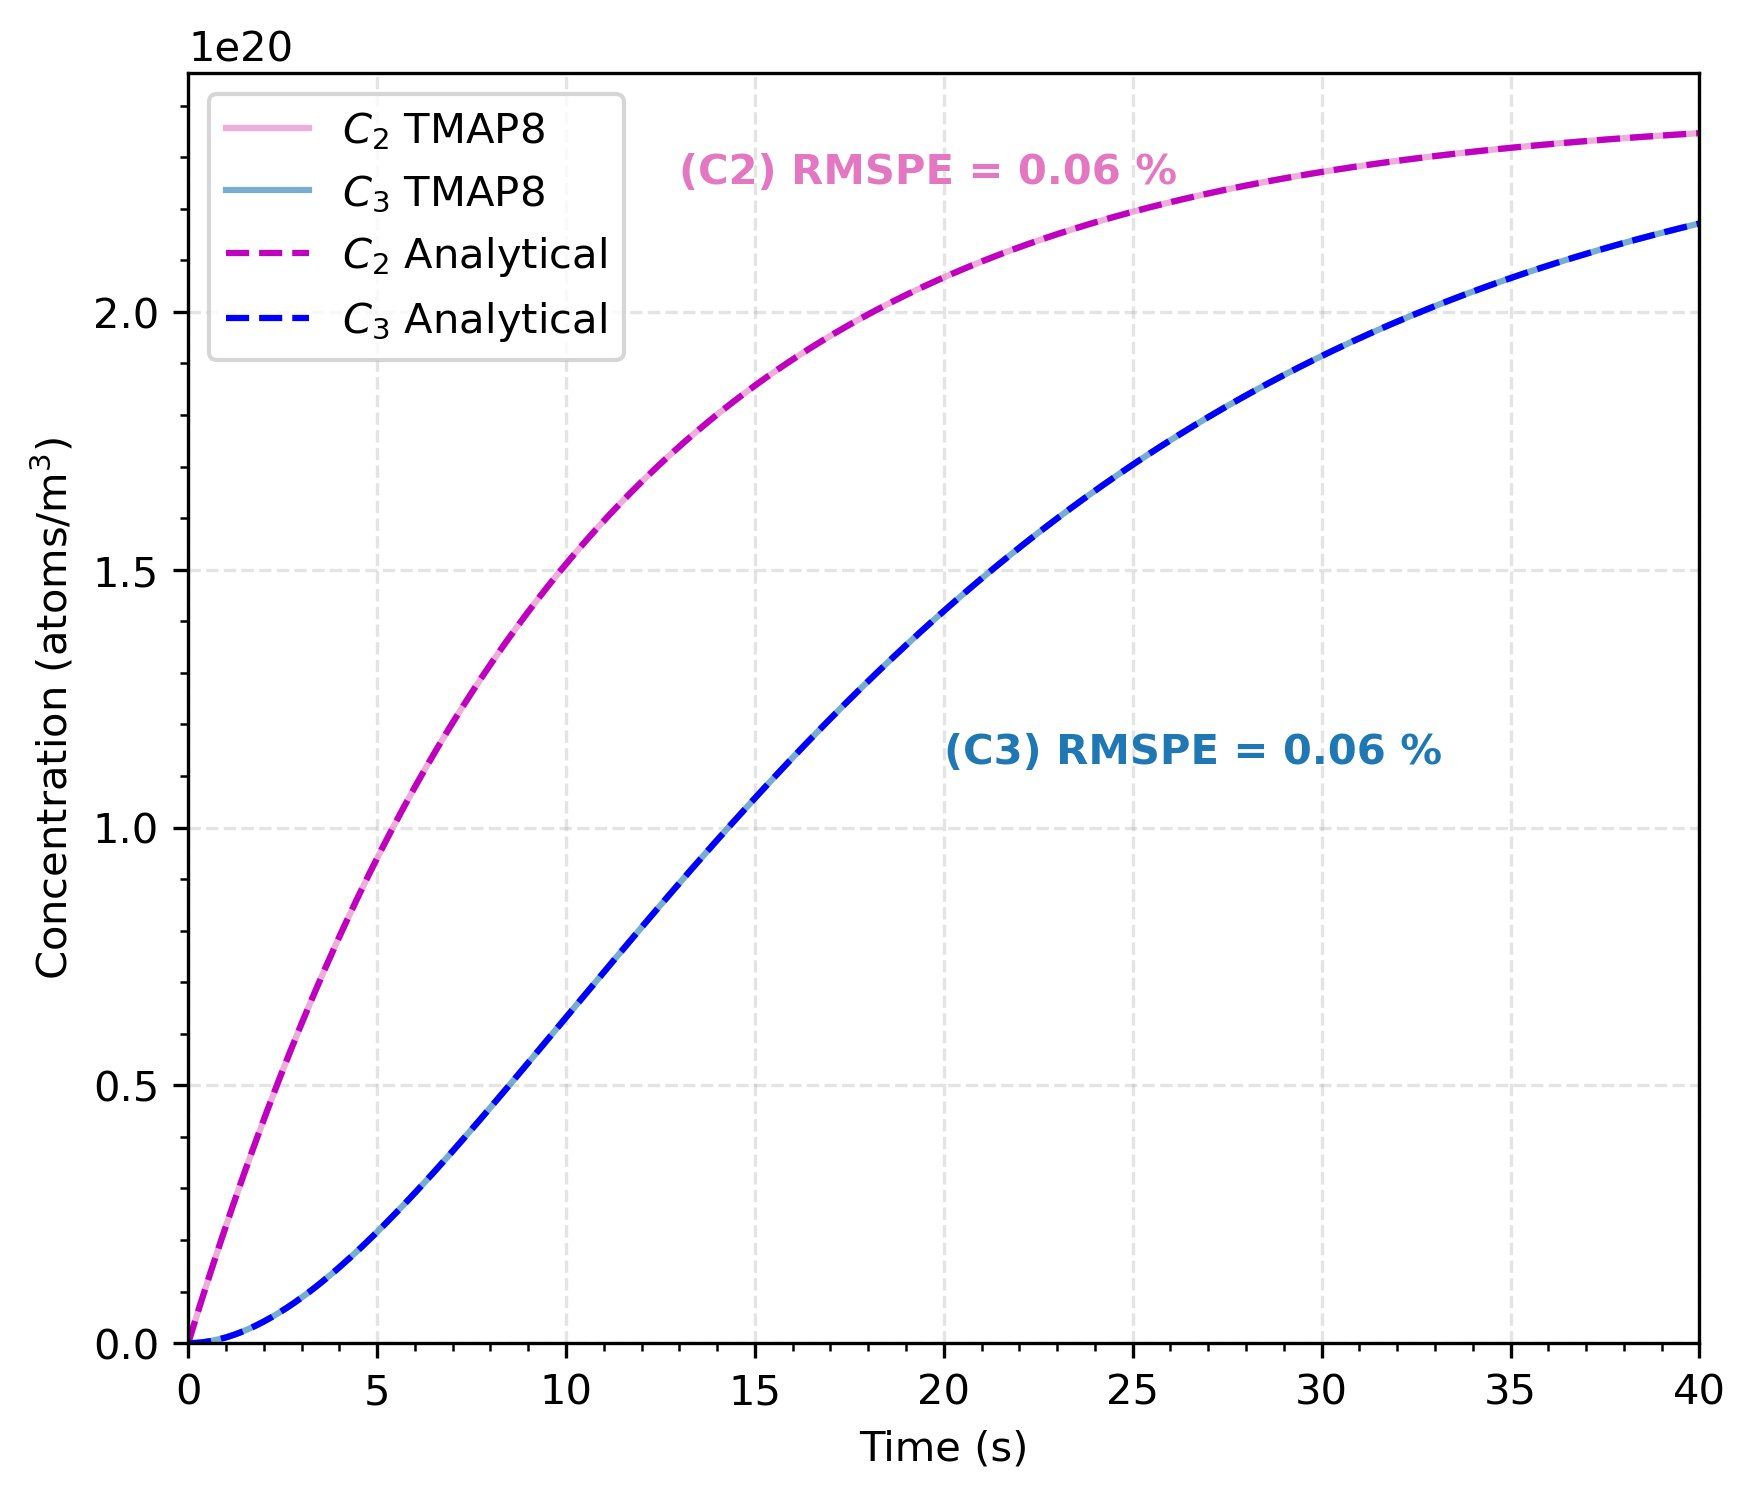
Figure 1: Comparison of concentration of species for the second and third enclosures in a series outflow predicted by TMAP8 and provided by the analytical solution. The RMSPE is the root mean square percent error between the analytical solution and TMAP8 predictions. This recreates the verification figure from TMAP4.
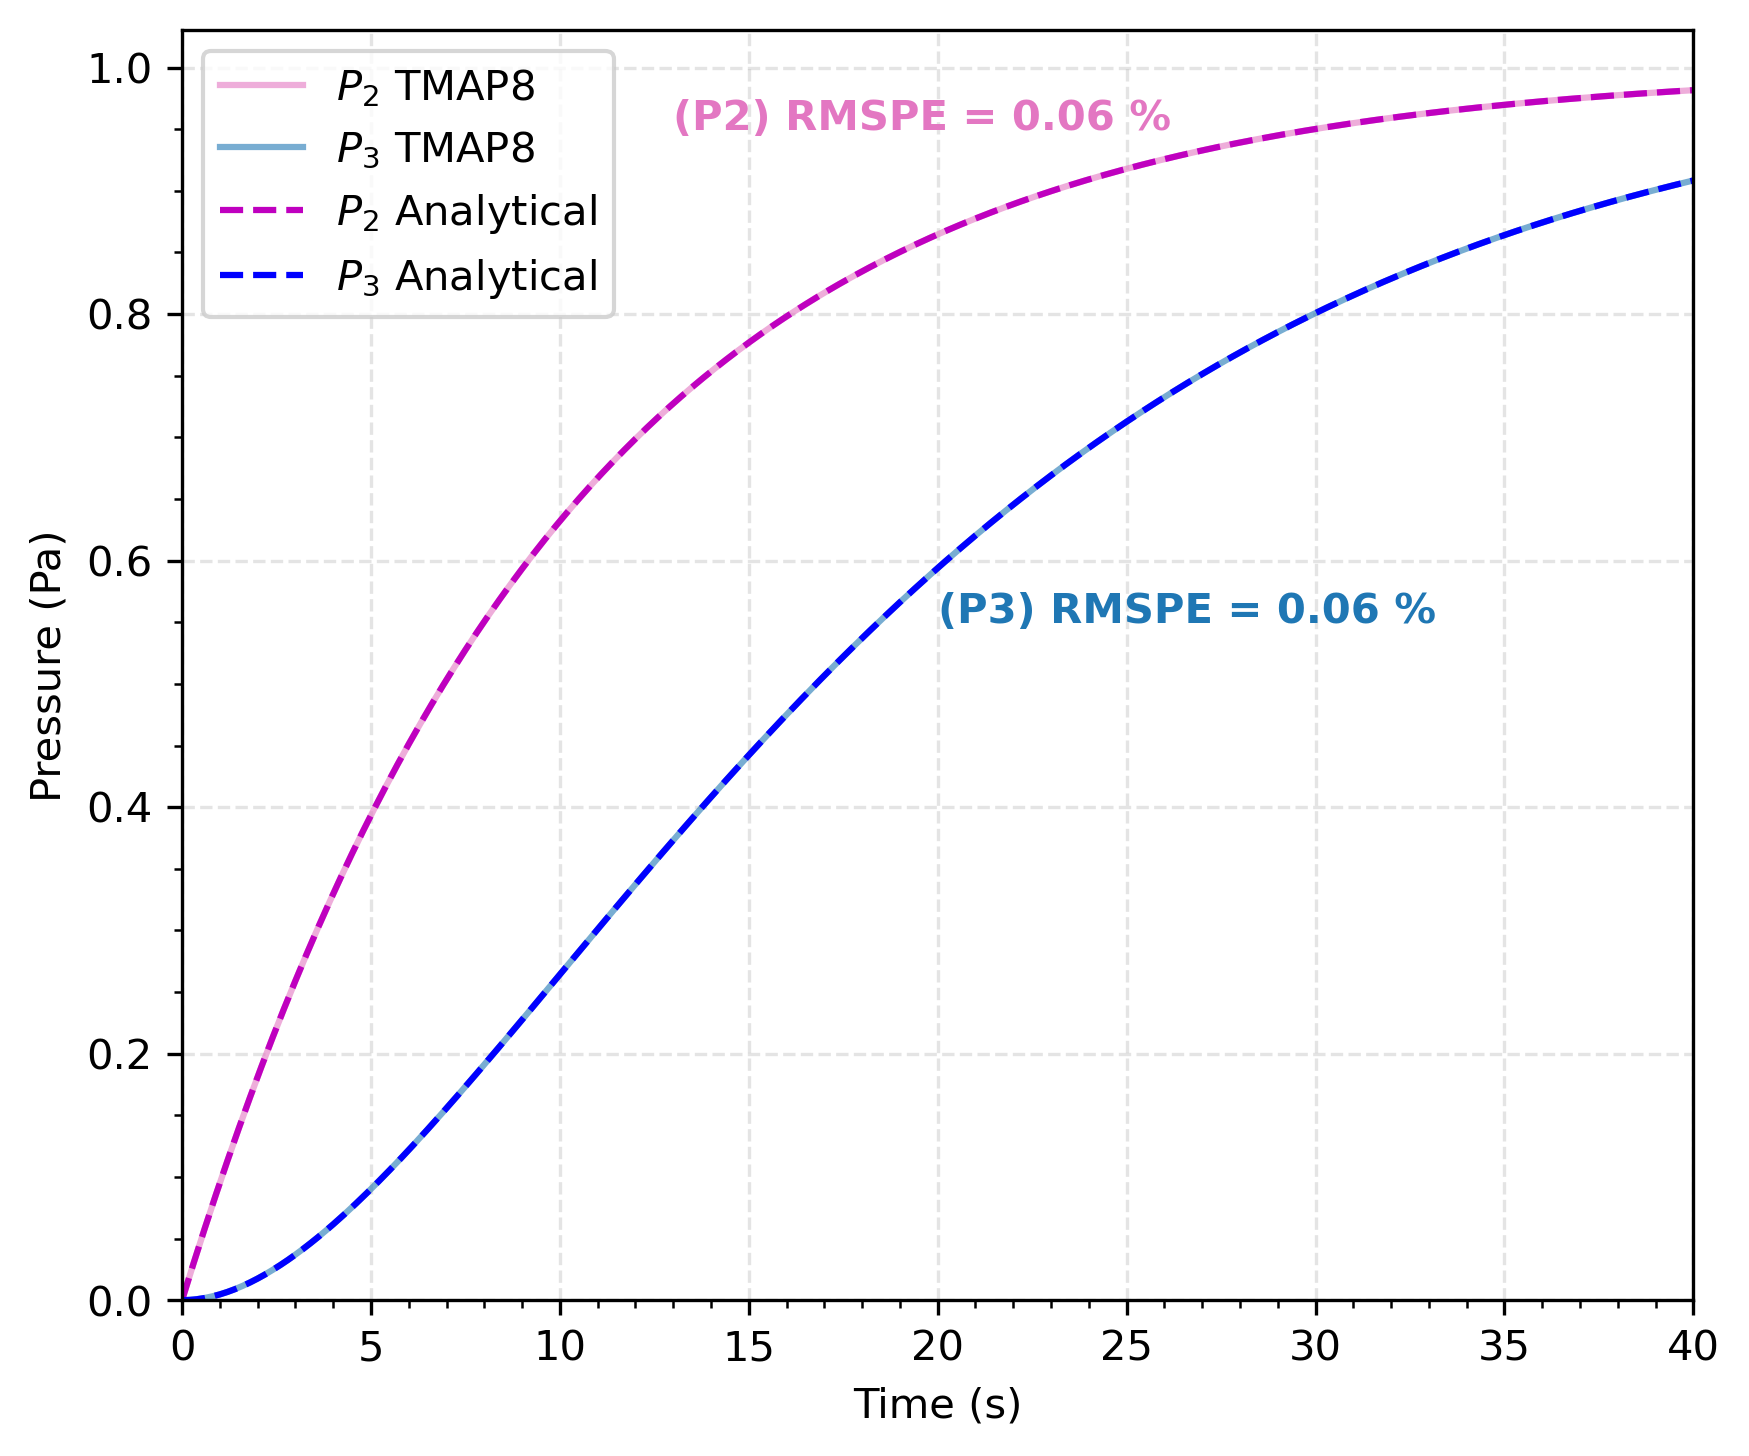
Figure 2: Comparison of pressure of species for the second and third enclosures in a series outflow predicted by TMAP8 and provided by the analytical solution. The RMSPE is the root mean square percent error between the analytical solution and TMAP8 predictions. This recreates the verification figure from TMAP7.
Input files
The input file for this case can be found at (test/tests/ver-1ha/ver-1ha.i), which is also used as test in TMAP8 at (test/tests/ver-1ha/tests).
References
- James Ambrosek and GR Longhurst.
Verification and Validation of TMAP7.
Technical Report INEEL/EXT-04-01657, Idaho National Engineering and Environmental Laboratory, December 2008.[BibTeX]
- GR Longhurst, SL Harms, ES Marwil, and BG Miller.
Verification and Validation of TMAP4.
Technical Report EGG-FSP-10347, Idaho National Engineering Laboratory, Idaho Falls, ID (United States), 1992.[BibTeX]
- Pierre-Clément A. Simon, Casey T. Icenhour, Gyanender Singh, Alexander D Lindsay, Chaitanya Vivek Bhave, Lin Yang, Adriaan Anthony Riet, Yifeng Che, Paul Humrickhouse, Masashi Shimada, and Pattrick Calderoni.
MOOSE-based tritium migration analysis program, version 8 (TMAP8) for advanced open-source tritium transport and fuel cycle modeling.
Fusion Engineering and Design, 214:114874, May 2025.
doi:10.1016/j.fusengdes.2025.114874.[BibTeX]