ver-1fb
Thermal Transient in a Slab
General Case Description
This heat transfer verification problem is taken from Longhurst et al. (1992) and Ambrosek and Longhurst (2008) and builds on the capabilities verified in ver-1fa. It has been updated and extended in Simon et al. (2025). The configuration is the same as in ver-1fa, except that, in the current case, there are no heat source in the slab and both ends with fixed temperature. This case is simulated in (test/tests/ver-1fb/ver-1fb.i).
The heat conduction in the one-dimensional model is described as:
(1)
where is the temperature, is the density, is the specific heat, and is the thermal conductivity.
The ends of a slab are kept fixed at different temperatures. The temperature distribution in the slab evolves from an initial state to steady-state.
In this case, the thickness of slab, , is 4.0 m, the thermal conductivity is W/m/K, the material density is assumed to be kg/m, and the specific heat is assumed to be J/kg/K. The fixed surface temperature, and , on both ends are defined as 400 K and 300 K, respectively.
Analytical solution
Incropera and DeWitt (2002) provides the analytical solution for the temperature of this case as:
(2)
where is the distance across the slab, is the time, is a coefficient of , and is the thermal diffusivity, which is defined as:
(3)
Both TMAP4 (Longhurst et al., 1992) and TMAP7 (Ambrosek and Longhurst, 2008) provide analytical solutions, but they use different equations. At the initial time and steady state, the solution from TMAP7 matches the real thermal distribution, whereas the solution from TMAP4 does not. Thus, TMAP8 selects the solution from TMAP7 as the analytical solution.
Results
A comparison of the temperature distribution in the slab, computed through TMAP8 and calculated analytically, is shown in Figure 1. The TMAP8 code predictions match very well with the analytical solution with the root mean square percentage errors of RMSPE = 0.09 % at s, RMSPE = 0.03 % at s, RMSPE = 0.02 % at s, and RMSPE = 0.00 % at s, respectively.
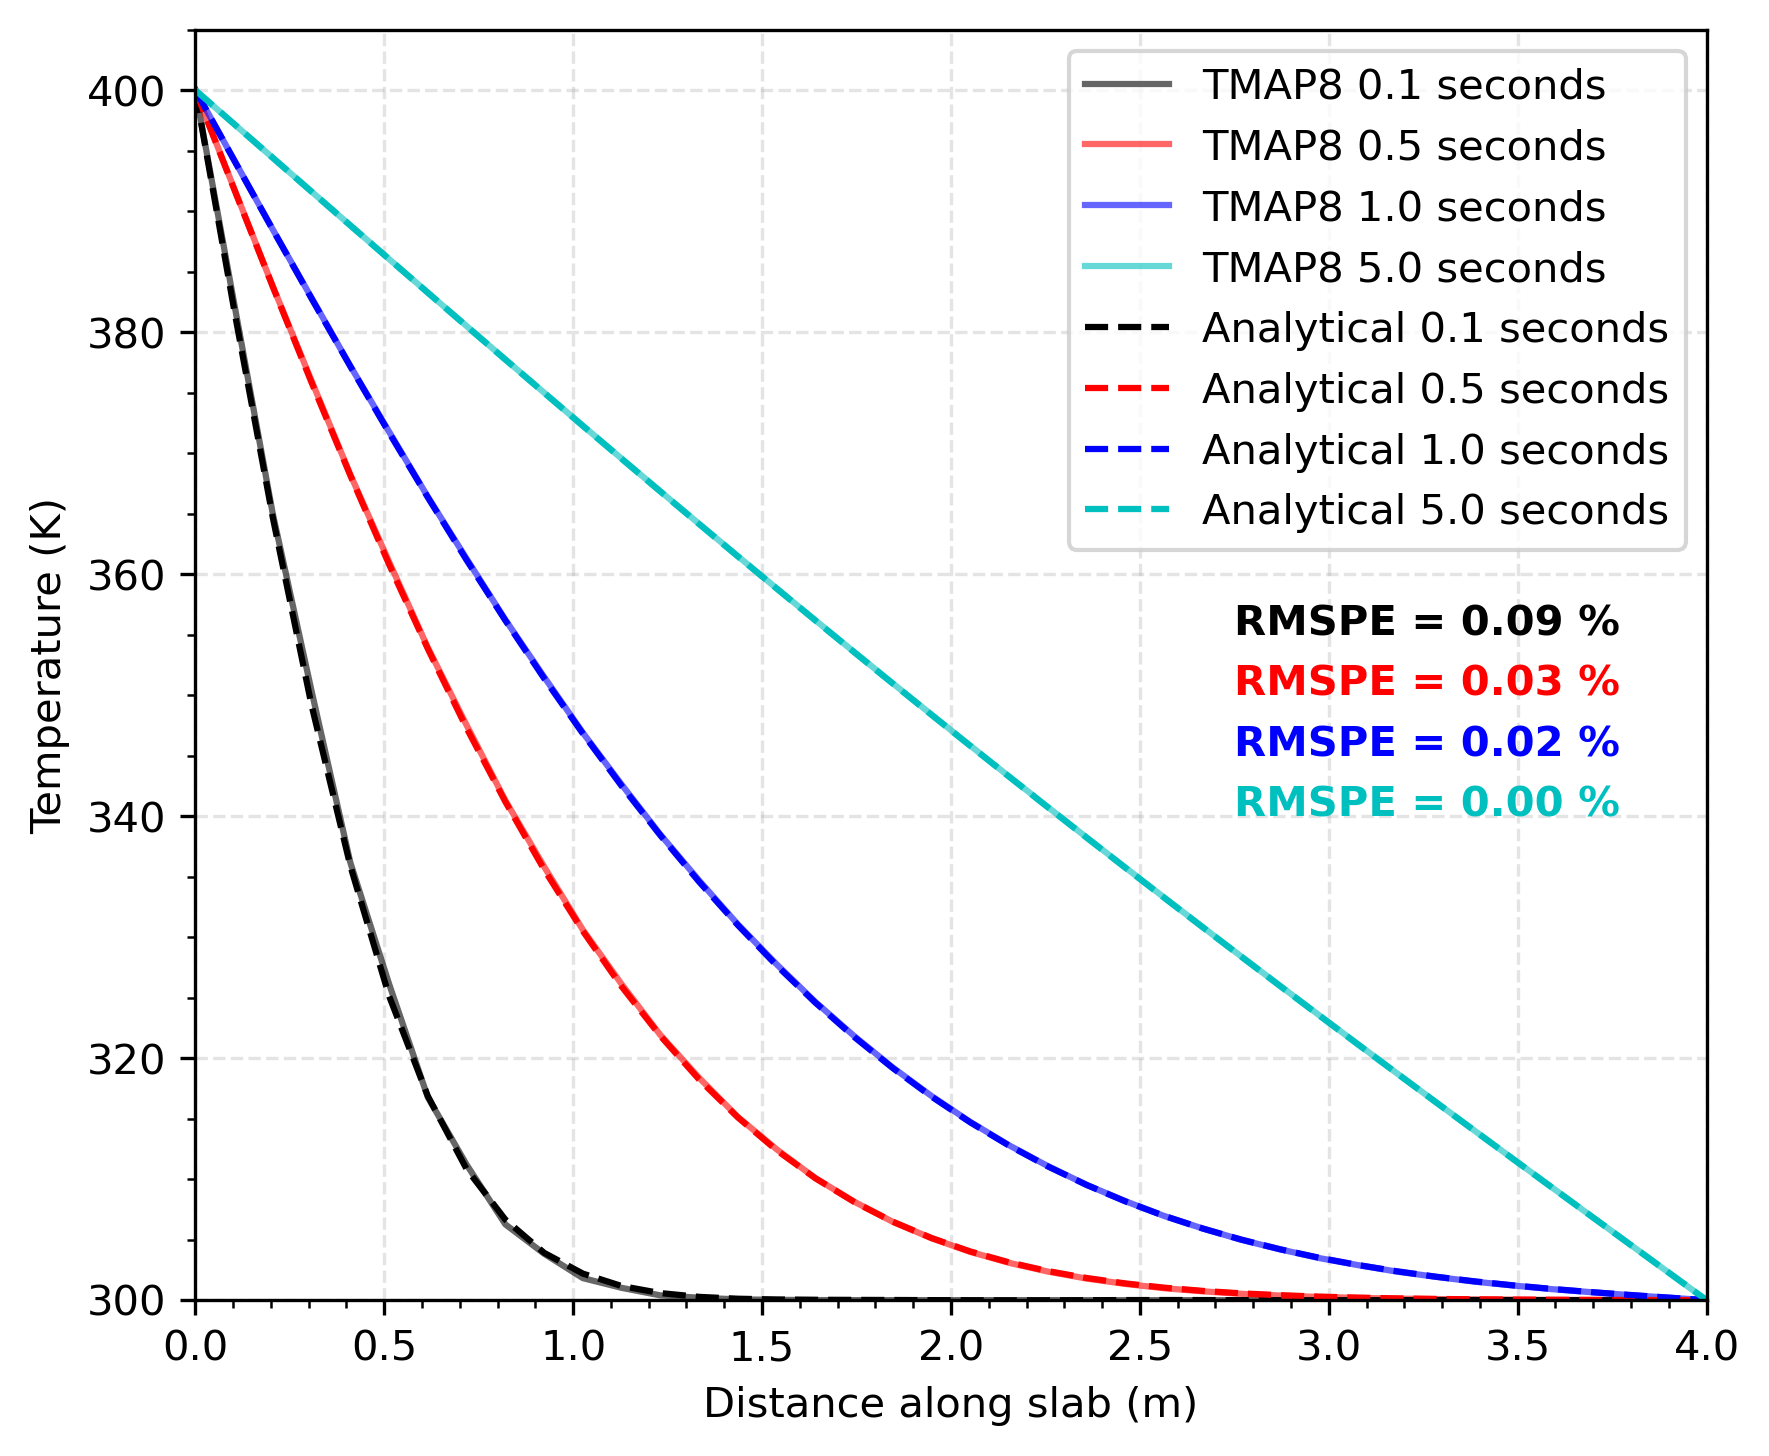
Figure 1: Comparison of temperature distribution in the slab calculated through TMAP8 and analytically
Input files
The input file for this case can be found at (test/tests/ver-1fb/ver-1fb.i), which is also used as test in TMAP8 at (test/tests/ver-1fb/tests).
References
- James Ambrosek and GR Longhurst.
Verification and Validation of TMAP7.
Technical Report INEEL/EXT-04-01657, Idaho National Engineering and Environmental Laboratory, December 2008.[BibTeX]
- F. P. Incropera and D. P. DeWitt.
Fundamentals of Heat and Mass Transfer.
John Wiley & Sons, 5th edition, 2002.[BibTeX]
- GR Longhurst, SL Harms, ES Marwil, and BG Miller.
Verification and Validation of TMAP4.
Technical Report EGG-FSP-10347, Idaho National Engineering Laboratory, Idaho Falls, ID (United States), 1992.[BibTeX]
- Pierre-Clément A. Simon, Casey T. Icenhour, Gyanender Singh, Alexander D Lindsay, Chaitanya Vivek Bhave, Lin Yang, Adriaan Anthony Riet, Yifeng Che, Paul Humrickhouse, Masashi Shimada, and Pattrick Calderoni.
MOOSE-based tritium migration analysis program, version 8 (TMAP8) for advanced open-source tritium transport and fuel cycle modeling.
Fusion Engineering and Design, 214:114874, May 2025.
doi:10.1016/j.fusengdes.2025.114874.[BibTeX]