val-2f
Modelling self-damaged tungsten effects on deuterium transport
Case Description
The case being used for validation here involves the use of recrystallized polycrystalline tungsten (PCW) samples, which are subjected to ion irradiation and subsequent analysis using thermal desorption spectroscopy (TDS). The primary objective is to determine how damage influences deuterium trapping and release. This case is drawn and updated from Dark et al. (2024).
The TDS process is simulated using TMAP8 in a 1D tungsten sample with a thickness of 0.8 mm. The TDS simulation consisted of three phases: implantation, cooldown, and desorption.
The sample temperature histories are shown in Figure 1.
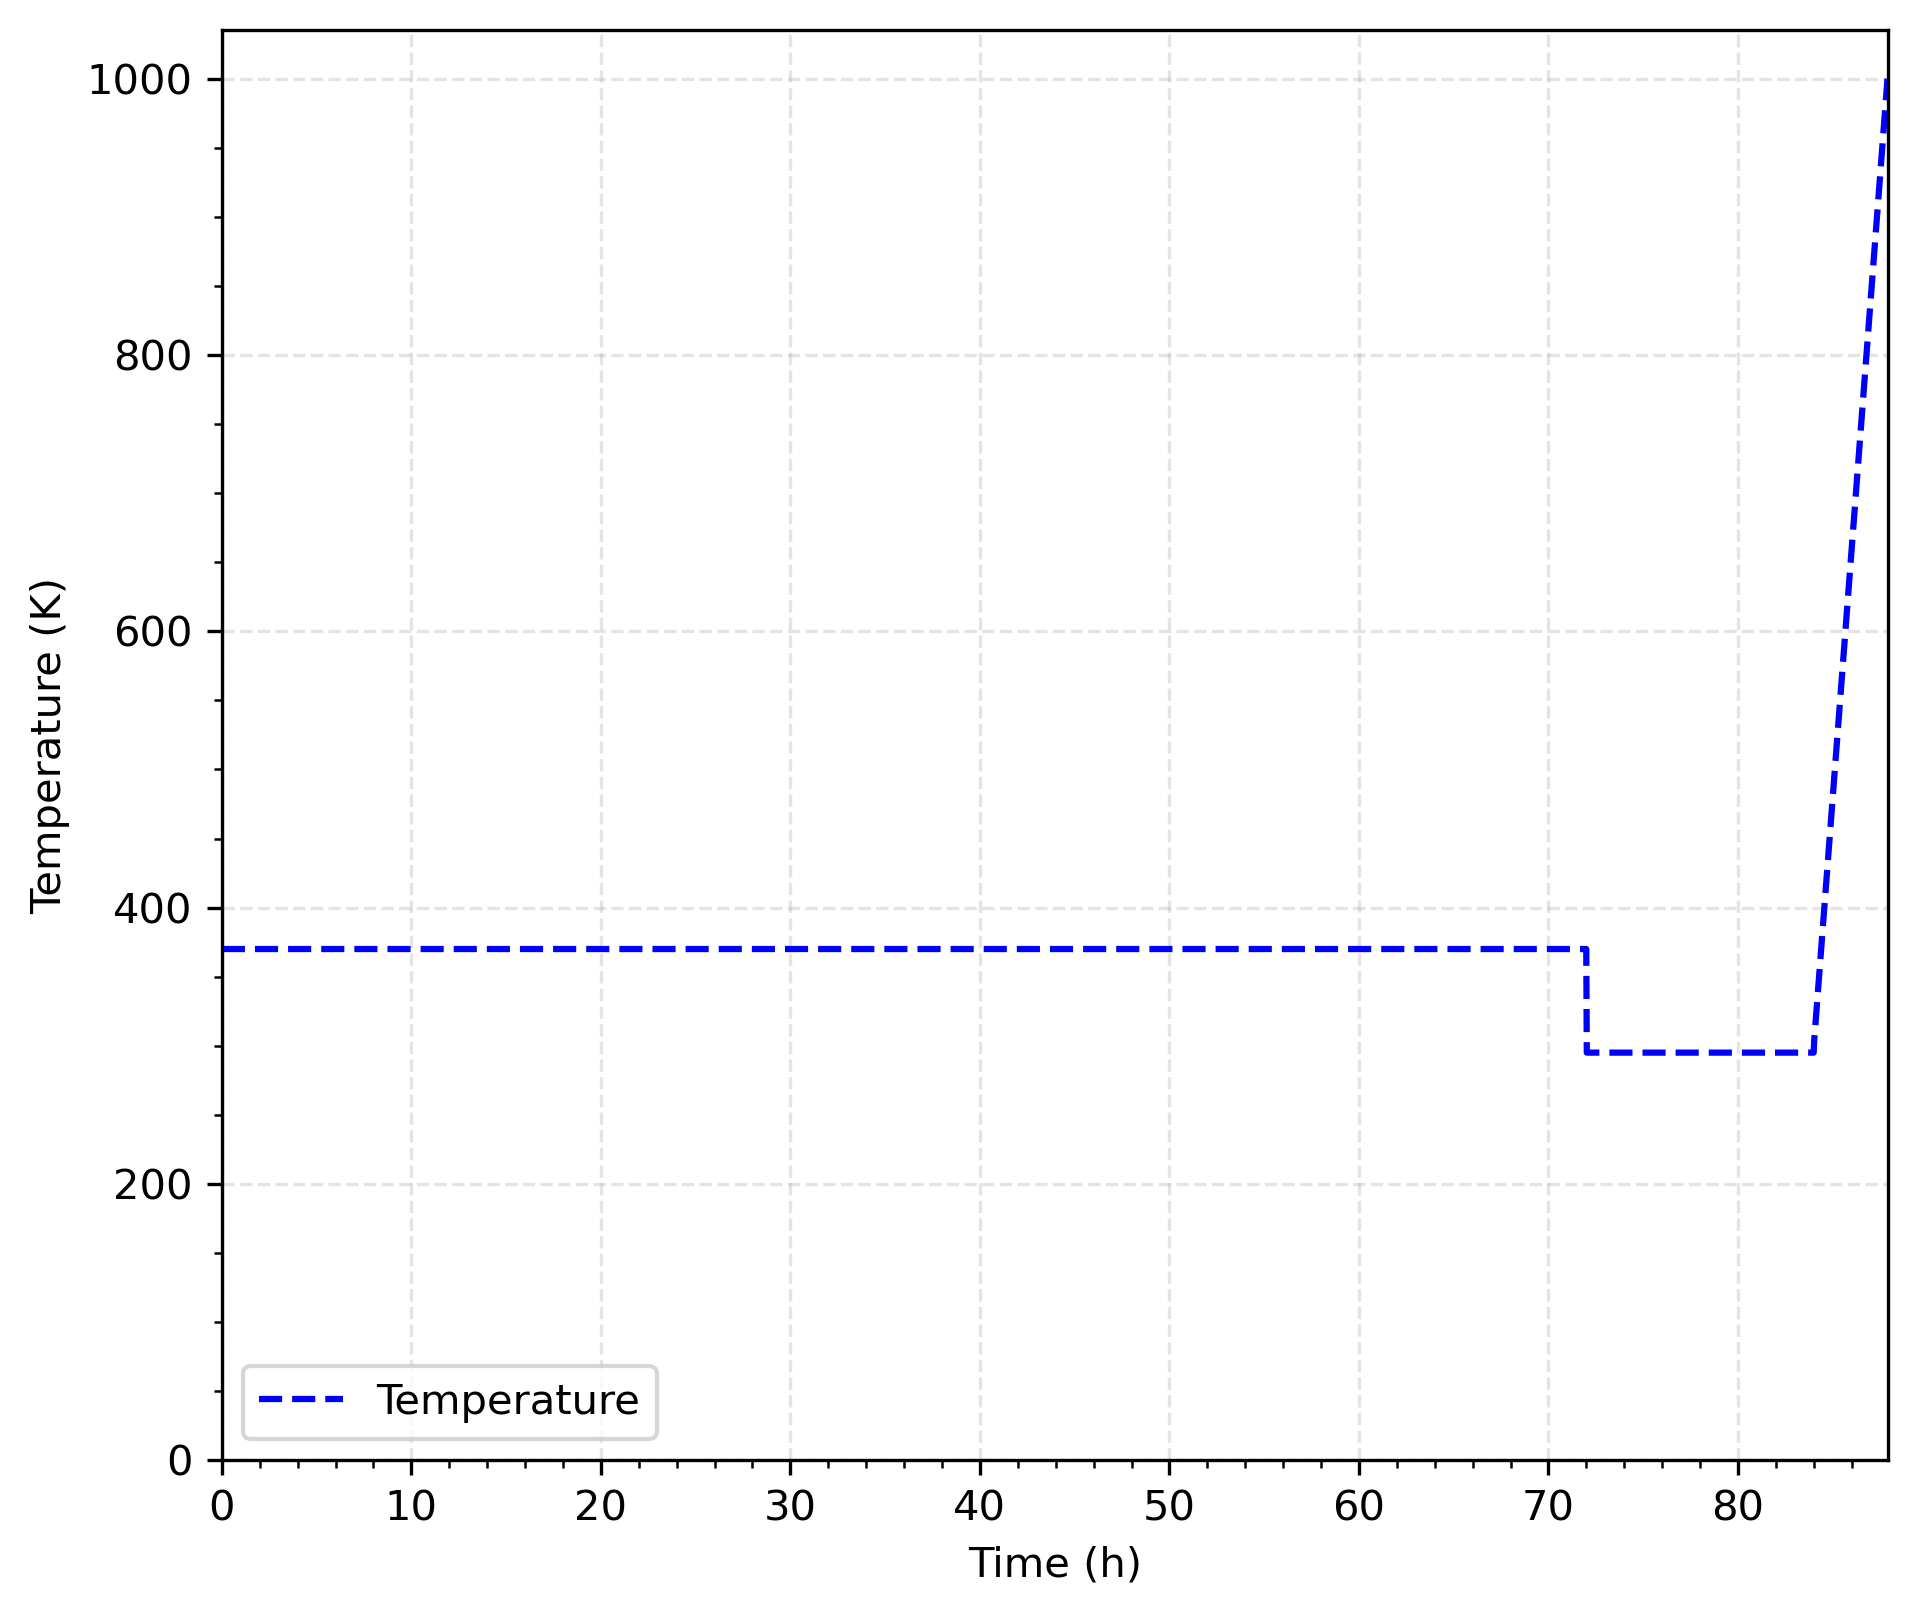
Figure 1: Temperature history.
Model Description
1- Implantation phase:
During the charging phase, deuterium is continuously implanted into the tungsten sample over a period of 72 hours. The temperature is maintained at 370 K throughout this phase. The surface is exposed to a constant flux of atoms/m/s, corresponding to a total fluence of atoms/m. The implantation profile follows a Gaussian distribution centered at the mean implantation depth of nm, with a standard deviation of nm :
(1)
where the surface flux function is given by:
The implantation distribution is illustrated in Figure 2: most of the implanted atoms are found within a few standard deviations () of the mean implantation depth (). In this context, it means that the mesh in the region where deuterium implantation occurs should be refined to a size comparable to . In this TMAP8 simulation, the first mesh region is set to length of , divided into 100 elements. This allows to capture the majority of the implantation profile and ensure that the mesh is sufficiently refined in this region.
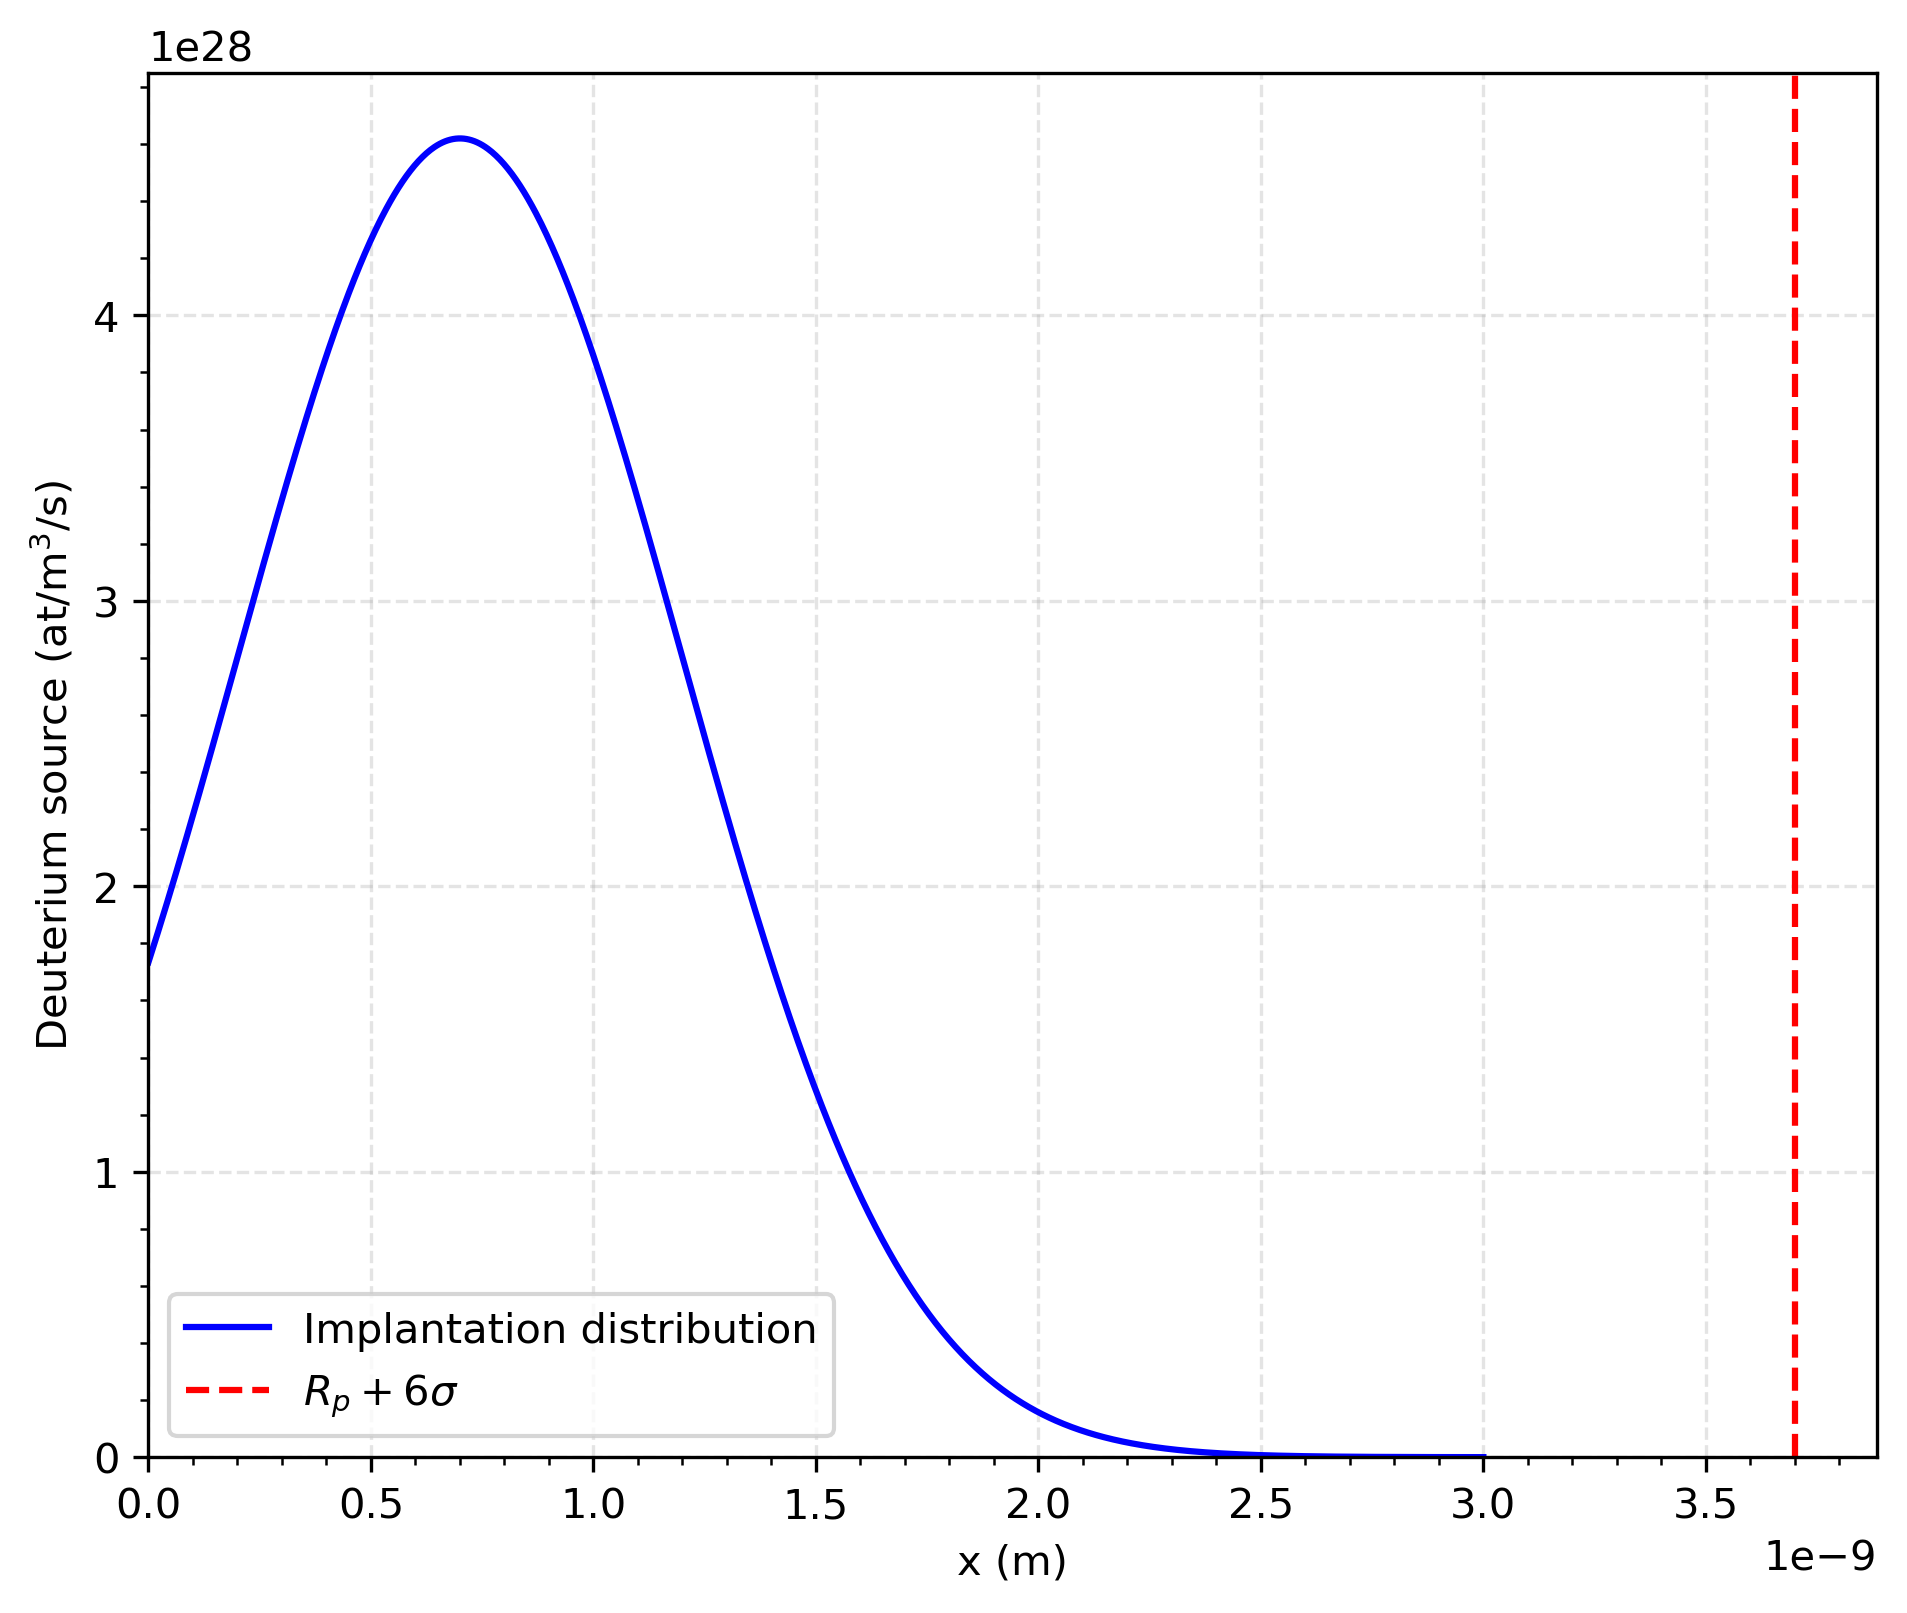
Figure 2: Deuterium implantation.
2- Cooldown phase:
After the implantation phase, the system enters the cooldown phase, lasting 12 hours. During this period, the sample temperature is rapidly reduced from 370 K to 295 K. No additional deuterium is introduced during this phase, meaning the source term is set to zero.
3- Desorption phase:
The final stage of the simulation is the desorption phase, during which the sample is gradually heated from 300 K to 1000 K at a constant rate of K/s.
Governing equations
• Damaged induced traps
The evolution of the trapping site density, , over time under irradiation is described by (Dark et al., 2024):
(2)
This equation consists of two terms. The first term, , represents the creation of trapping sites. It increases the trap density up to a saturation density, , due to the damage imposed on the sample. Here, is the damage rate in (dpa/s) and is the trap creation factor in (traps/m/dpa). The second term, , accounts for the annealing effect which decreases the density of trapping sites. is the trap annealing rate in (1/s) and follows an Arrhenius law given by (3) where is a pre-exponential factor, is the activation energy, is the Boltzmann constant, and is the temperature. The parameters for the evolution of the irradiation-induced traps are listed in Table 2.
The analytical solution for the ODE is given by:
(4)
The computed trap densities are provided in Table 3.
• Deuterium transport equations
The general form of the transport equations for the deuterium in tungsten is given by:
(5)
and, for representing the trapping sites:
(6)
and
where is the concentration of mobile tritium, is the time, is the source term in sample due to the deuterium implantation (Eq. (1)), is the trapped species in trap , and are the trapping and release rate coefficients for trap , is a factor scaling to be closer to for better numerical convergence, is the fraction of host sites that can contribute to trapping, is the concentration of empty trapping sites, and is the host density, and is the deuterium diffusivity in tungsten, which is defined as:
(7)
where is the diffusion activation energy, is the temperature, and is the maximum diffusivity coefficient.
and are defined as:
(8)
and
(9)
where and are the pre-exponential factors of trapping and release. The trapping energy is equal to the diffusion activation energy .
• Boundary conditions
There are several ways to model the surface behavior of deuterium, and this study tested two options. One can assume that every deuterium atom at the surface is immediately desorbed from the materials, effectively assuming an infinite recombination rate at the surface and imposing a null Dirichlet boundary condition for the mobile deuterium concentration ( atoms/m). This is the assumption used in Dark et al. (2024) and reproduced in Figure 5.
However, it is also possible to capture the rate of deuterium recombination at the surface as it recombines into gas. It can be described by the following surface flux:
where represents the recombination flux exiting the sample on both the left and right sides, is the surface area, and is the deuterium recombination coefficient. The coefficient of 2 accounts for the fact that 2 deuterium atoms combine to form one D molecule. Using this condition, the surface concentration will not be imposed, but be governed by the concentration of deuterium coming to the surface from the bulk and the rate of recombination. This boundary condition is used in Figure 7.
Case and Model Parameters
In this section provides the model parameters for this validation case. Table 1 provides the base model parameters for the validation case. Then, we presents two sets of parameter values for the trapping sites. First, in Table 2, we lists the parameters related to the damage-induced traps. These parameters capture the irradiation-dependent evolution of trap properties. Second, in Table 3, we reproduce the calibrated values used in Dark et al. (2024) to reproduce the desorption data. As illustrated in Figure 3, the trap densities in these two approaches, i.e., analytical solution in Eq. (4) and calibrated values in Figure 3, differ.
Table 1: Values of material properties.
| Parameter | Description | Value | Units | Reference |
|---|---|---|---|---|
| Boltzmann constant | 1.380649 | J/K | PhysicalConstants.h | |
| Initial temperature | 370 | K | Dark et al. (2024) | |
| Cooldown temperature | 295 | K | Dark et al. (2024) | |
| Desorption start temperature | 300 | K | Dark et al. (2024) | |
| Desorption end temperature | 1000 | K | Dark et al. (2024) | |
| Desorption heating rate | 0.05 | K/s | Dark et al. (2024) | |
| Charging time | 72 | h | Dark et al. (2024) | |
| Cooldown duration | 12 | h | Dark et al. (2024) | |
| Diffusion pre-factor | 1.6 | m/s | Dark et al. (2024) | |
| Activation energy for deuterium diffusion | 0.28 | eV | Dark et al. (2024) | |
| Mean implantation depth | 0.7 | nm | Dark et al. (2024) | |
| Standard deviation of implantation profile | 0.5 | nm | Dark et al. (2024) | |
| Incident fluence | 1.5 | atoms/m | Dark et al. (2024) | |
| Incident flux | 5.79 | atoms/m/s | Dark et al. (2024) | |
| Length of the tungsten sample | 0.8 | mm | Dark et al. (2024) | |
| Tungten density | 6.3222 | at/m | J-Dark-PhD |
Table 2: Damaged-induced traps parameters from Dark et al. (2024) used in Eq. (2) to capture the evolution of trap properties with irradiation.
| Trap | (dpa/s) | (traps/m/dpa) | (atoms/m) | (1/s) | (eV) | (K) |
|---|---|---|---|---|---|---|
| Trap 1 | 8.9 | 9.0 | 6.9 | 6.18 | 0.24 | 800 |
| Trap 2 | 8.9 | 4.2 | 7.0 | 6.18 | 0.24 | 800 |
| Trap 3 | 8.9 | 2.5 | 6.0 | 6.18 | 0.30 | 800 |
| Trap 4 | 8.9 | 5.0 | 4.7 | 6.18 | 0.30 | 800 |
| Trap 5 | 8.9 | 1.0 | 2.0 | 0 | - | 800 |
Table 3: Calibrated values of traps parameters for 0.1 dpa from Dark et al. (2024) to match the experimental desorption data.
| Parameter | Description | Value | Units | Reference |
|---|---|---|---|---|
| Pre-factor of trapping rate coefficient | atoms/s | J-Dark-PhD | ||
| Pre-factor of release rate coefficient | atoms/s | J-Dark-PhD | ||
| Trapping energy for all traps | 0.28 | eV | Dark et al. (2024) | |
| Release energy for trap 1 | 1.15 | eV | Dark et al. (2024) | |
| Release energy for trap 2 | 1.35 | eV | Dark et al. (2024) | |
| Release energy for trap 3 | 1.65 | eV | Dark et al. (2024) | |
| Release energy for trap 4 | 1.85 | eV | Dark et al. (2024) | |
| Release energy for trap 5 | 2.05 | eV | Dark et al. (2024) | |
| Release energy for intrinsic trap | 1.04 | eV | Dark et al. (2024) | |
| Density for trap 1 | 4.63 | atoms/m | Eq. (4) | |
| Density for trap 2 | 2.87 | atoms/m | Eq. (4) | |
| Density for trap 3 | 1.96 | atoms/m | Eq. (4) | |
| Density for trap 4 | 2.97 | atoms/m | Eq. (4) | |
| Density for trap 5 | 7.87 | atoms/m | Eq. (4) | |
| Density for intrinsic trap | 2.4 | atoms/m | Dark et al. (2024) |
 at 0.1 dpa.](figures/val-2f_trap_induced_density.png)
Figure 3: Trap densities as a function of damage. The analytical solutions are represented by the solid curve, while the points indicate the fitted values used in Dark et al. (2024) at 0.1 dpa.
As described in the boundary conditions section, we use two different approaches for the description of the surface recombination rates. We first impose atoms/m to reproduce the results from Dark et al. (2024). However, we also capture the finite kinetics of surface reaction using the recombination rate from Zhao et al. (2020), which has been increased in this study to better match the TDS data. The values used are listed in Table 4:
Table 4: Values of recombination rates.
| Parameter | Description | Value | Units | Reference |
|---|---|---|---|---|
| Deuterium recombination coefficient | 3.8 | m/at/s | Zhao et al. (2020) | |
| Adapted deuterium recombination coefficient | 3.8 | m/at/s | - |
There is a typo in the expression for the deuterium recombination coefficient for clean tungsten surfaces from Zhao et al. (2020) where the minus sign in the exponential is missing, even though the data shows it should be present. Consequently, we used the corrected value in our simulations, which includes the minus sign.
Results
The figures below show the comparison of the TMAP8 calculation and the experimental data during desorption. The experimental data are provided by T. Schwarz-Selinger and are available here.
We first reproduce the results from Dark et al. (2024) using a Dirichlet boundary condition at the surface and using the calibrated trapping properties from Table 3. Figure 4 displays the quantities of mobile, trapped, and desorbing deuterium atoms during the desorption process. During desorption, the temperature increases from 300 K to 1000 K. The amount of deuterium trapped will decrease as the temperature rises and the various trapping energies are reached, meaning that deuterium will leave the traps, become mobile, and diffuse out. During desorption, no further implantation occurs, resulting in a decrease in the number of mobile and trapped deuterium atoms and an increase in the number of desorbed deuterium atoms.
Mass conservation in Figure 4 is maintained during desorption, with a 0.01% root mean squared percentage error (RMSPE) between the initial number of mobile and trapped deuterium atoms and the total number of deuterium atoms (mobile, trapped, and desorbed).
Figure 5 shows a good alignment with the experimental data and the results presented in Dark et al. (2024). With an infinite recombination rate, the amount of mobile deuterium is minimal compared to the trapped deuterium, as demonstrated in Figure 4. Consequently, the desorbed deuterium flux is almost solely due to the deuterium desorbing from the traps.
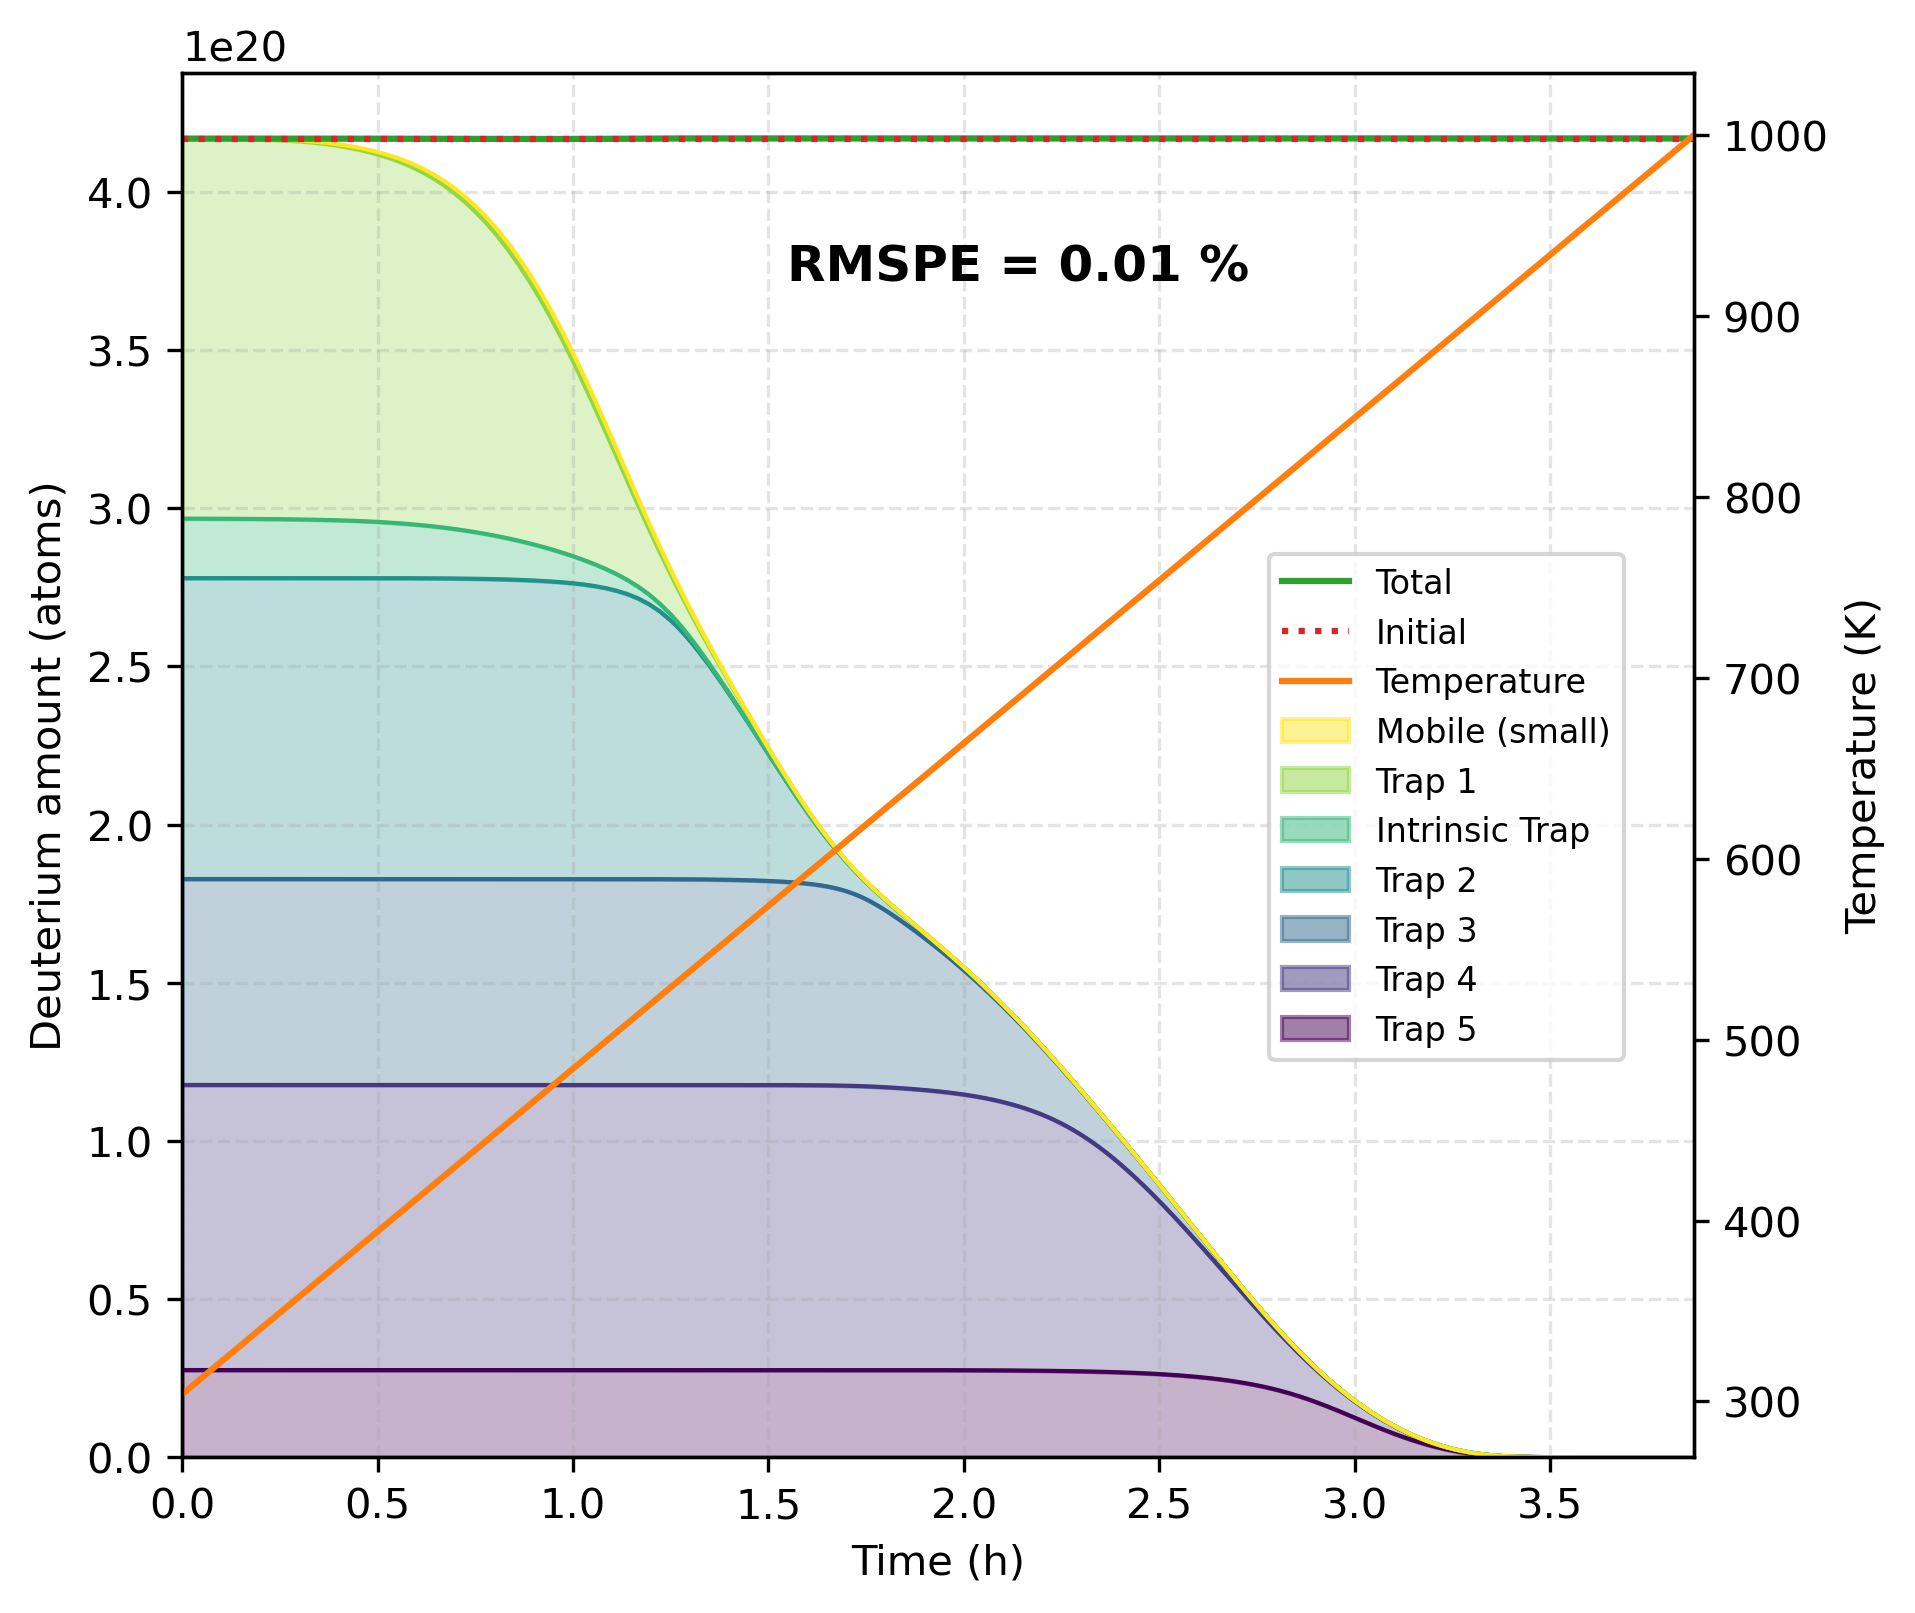
Figure 4: Quantity of deuterium atoms during the desorption process for an infinite recombination rate and calibrated trapping properties.
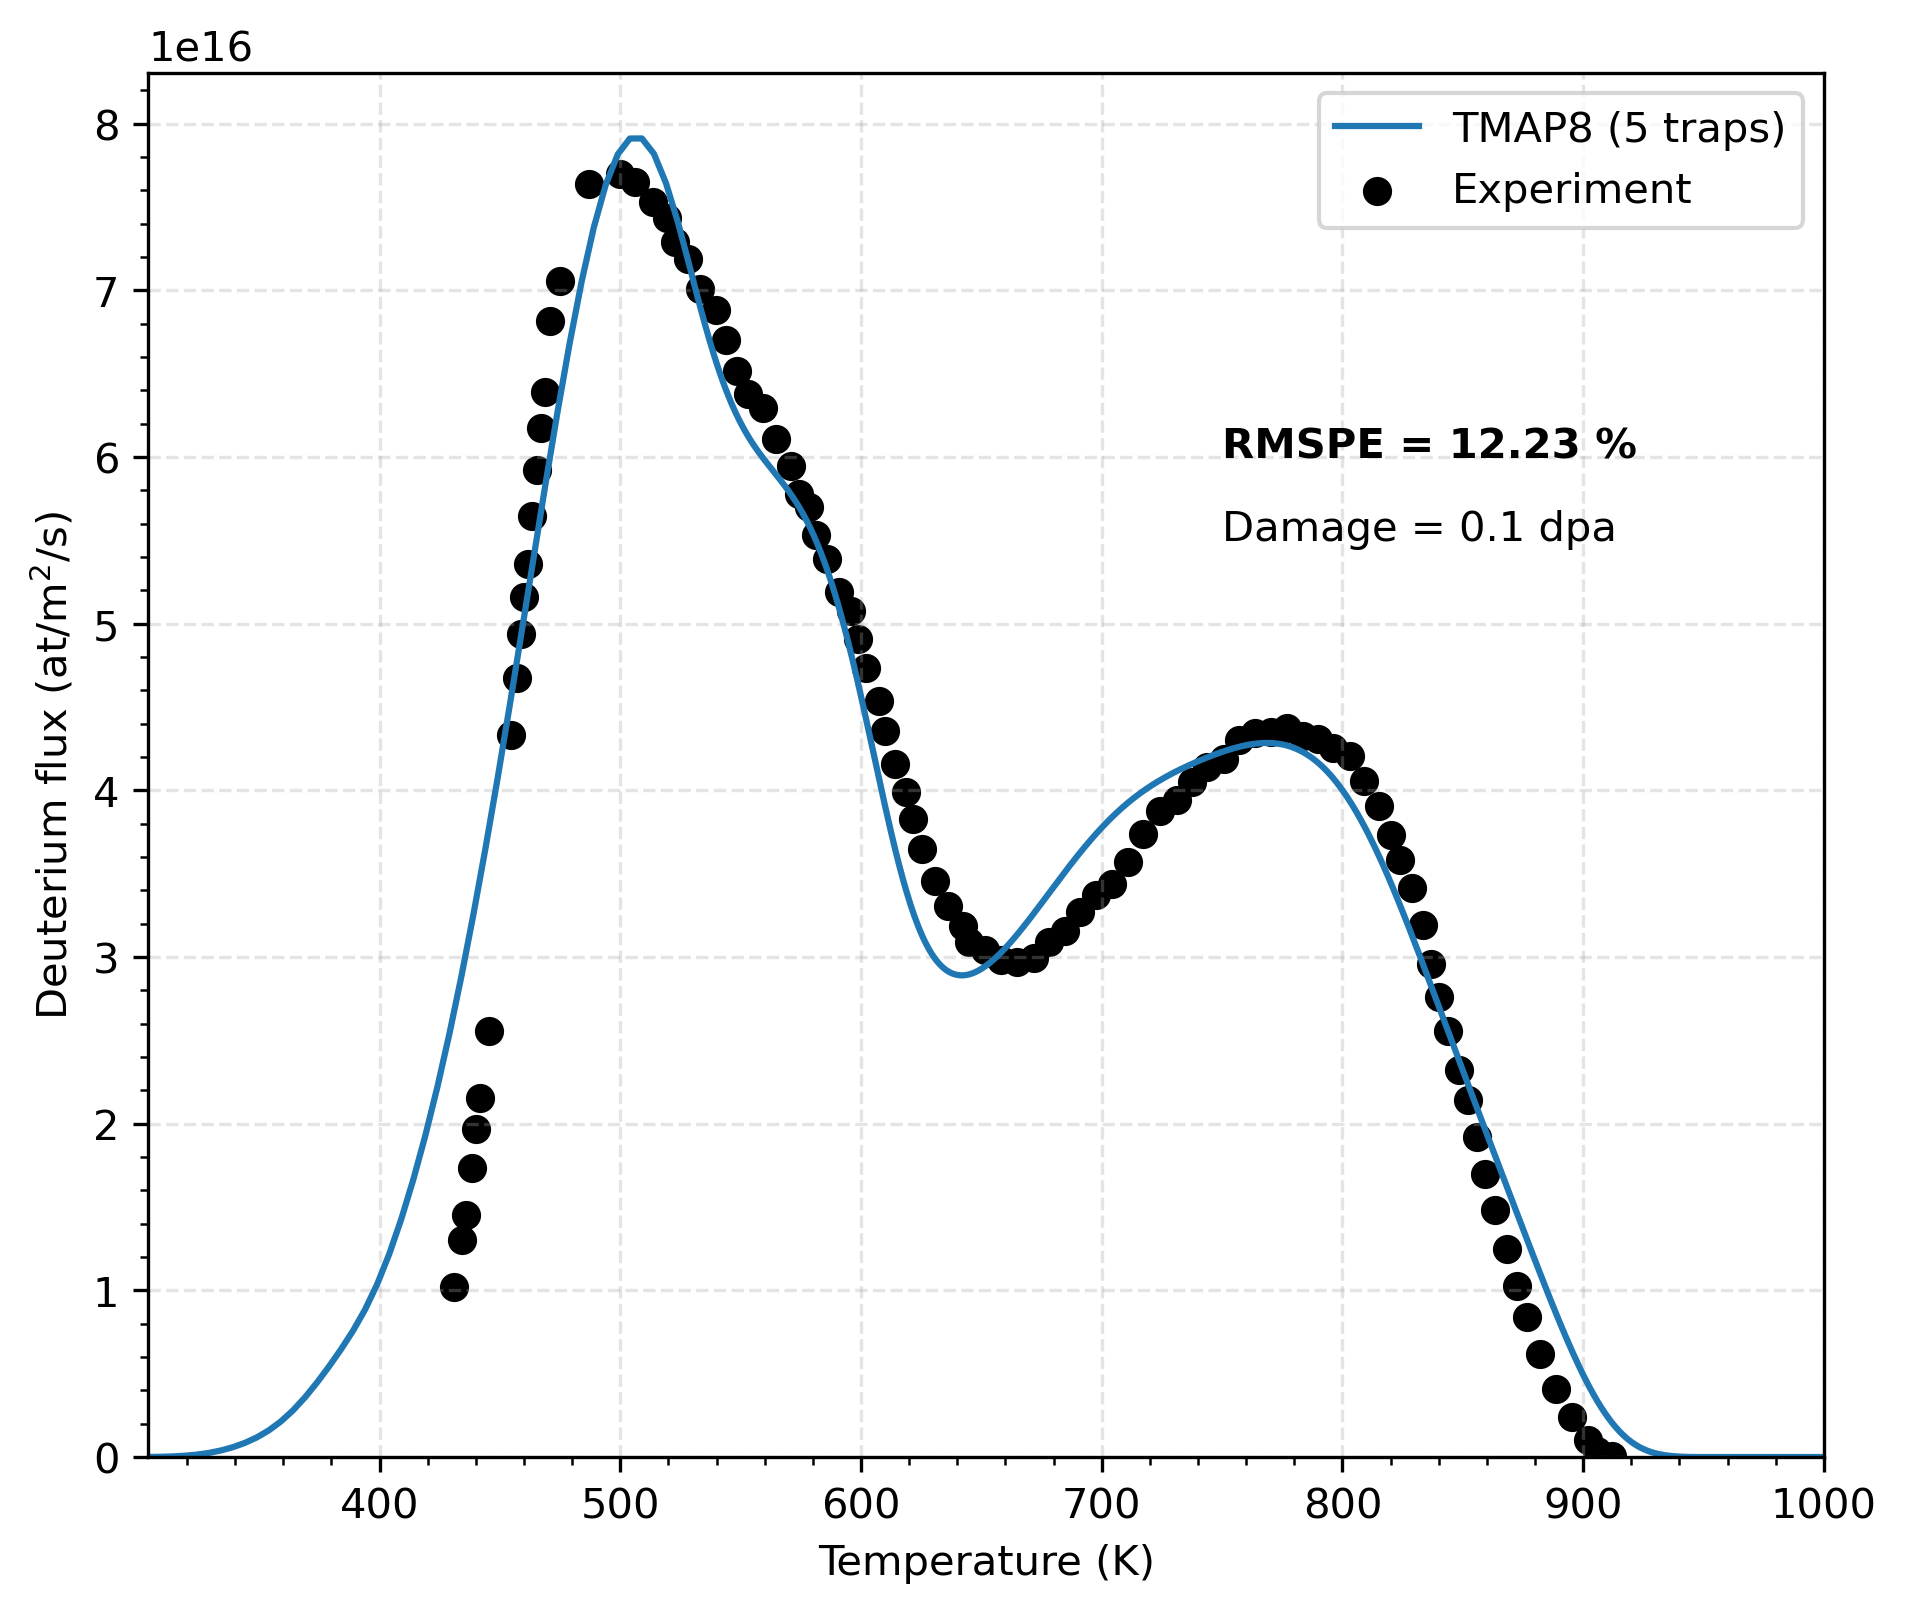
Figure 5: Comparison of TMAP8 calculations with experimental data on deuterium flux (atoms/m/s) for a damage of 0.1 dpa, an infinite recombination rate and calibrated trapping properties.
In this validation case, the recombination rate has been set to a finite value to better reflect real conditions. Specifically, the recombination rate is set to a value 10 orders of magnitude higher than that reported by Zhao et al. (2020). A recombination rate that is too low leads to the accumulation of a significant amount of mobile deuterium at the onset of the desorption phase. Consequently, this would result in desorption being attributed to mobile deuterium rather than trapped deuterium. The updated, increased recombination rate limits deuterium accumulation in the sample, without imposing a surface concentration. As shown in Figure 6, the quantity of mobile deuterium is nearly equal to zero, similar to the case with an infinite recombination rate, and mass conservation is maintained. The TMAP8 results in Figure 7 match well with the experimental data. There still exists an offset between the TMAP8 results and the experimental data, which can be reduced by better fitting the recombination rate and trapping parameters described in Table 3 using the MOOSE's stochastic tools module. It is important to mention here that the mesh for the infinite recombination rate requires a finer mesh as well as smaller time steps compared to the finite recombination rate case.
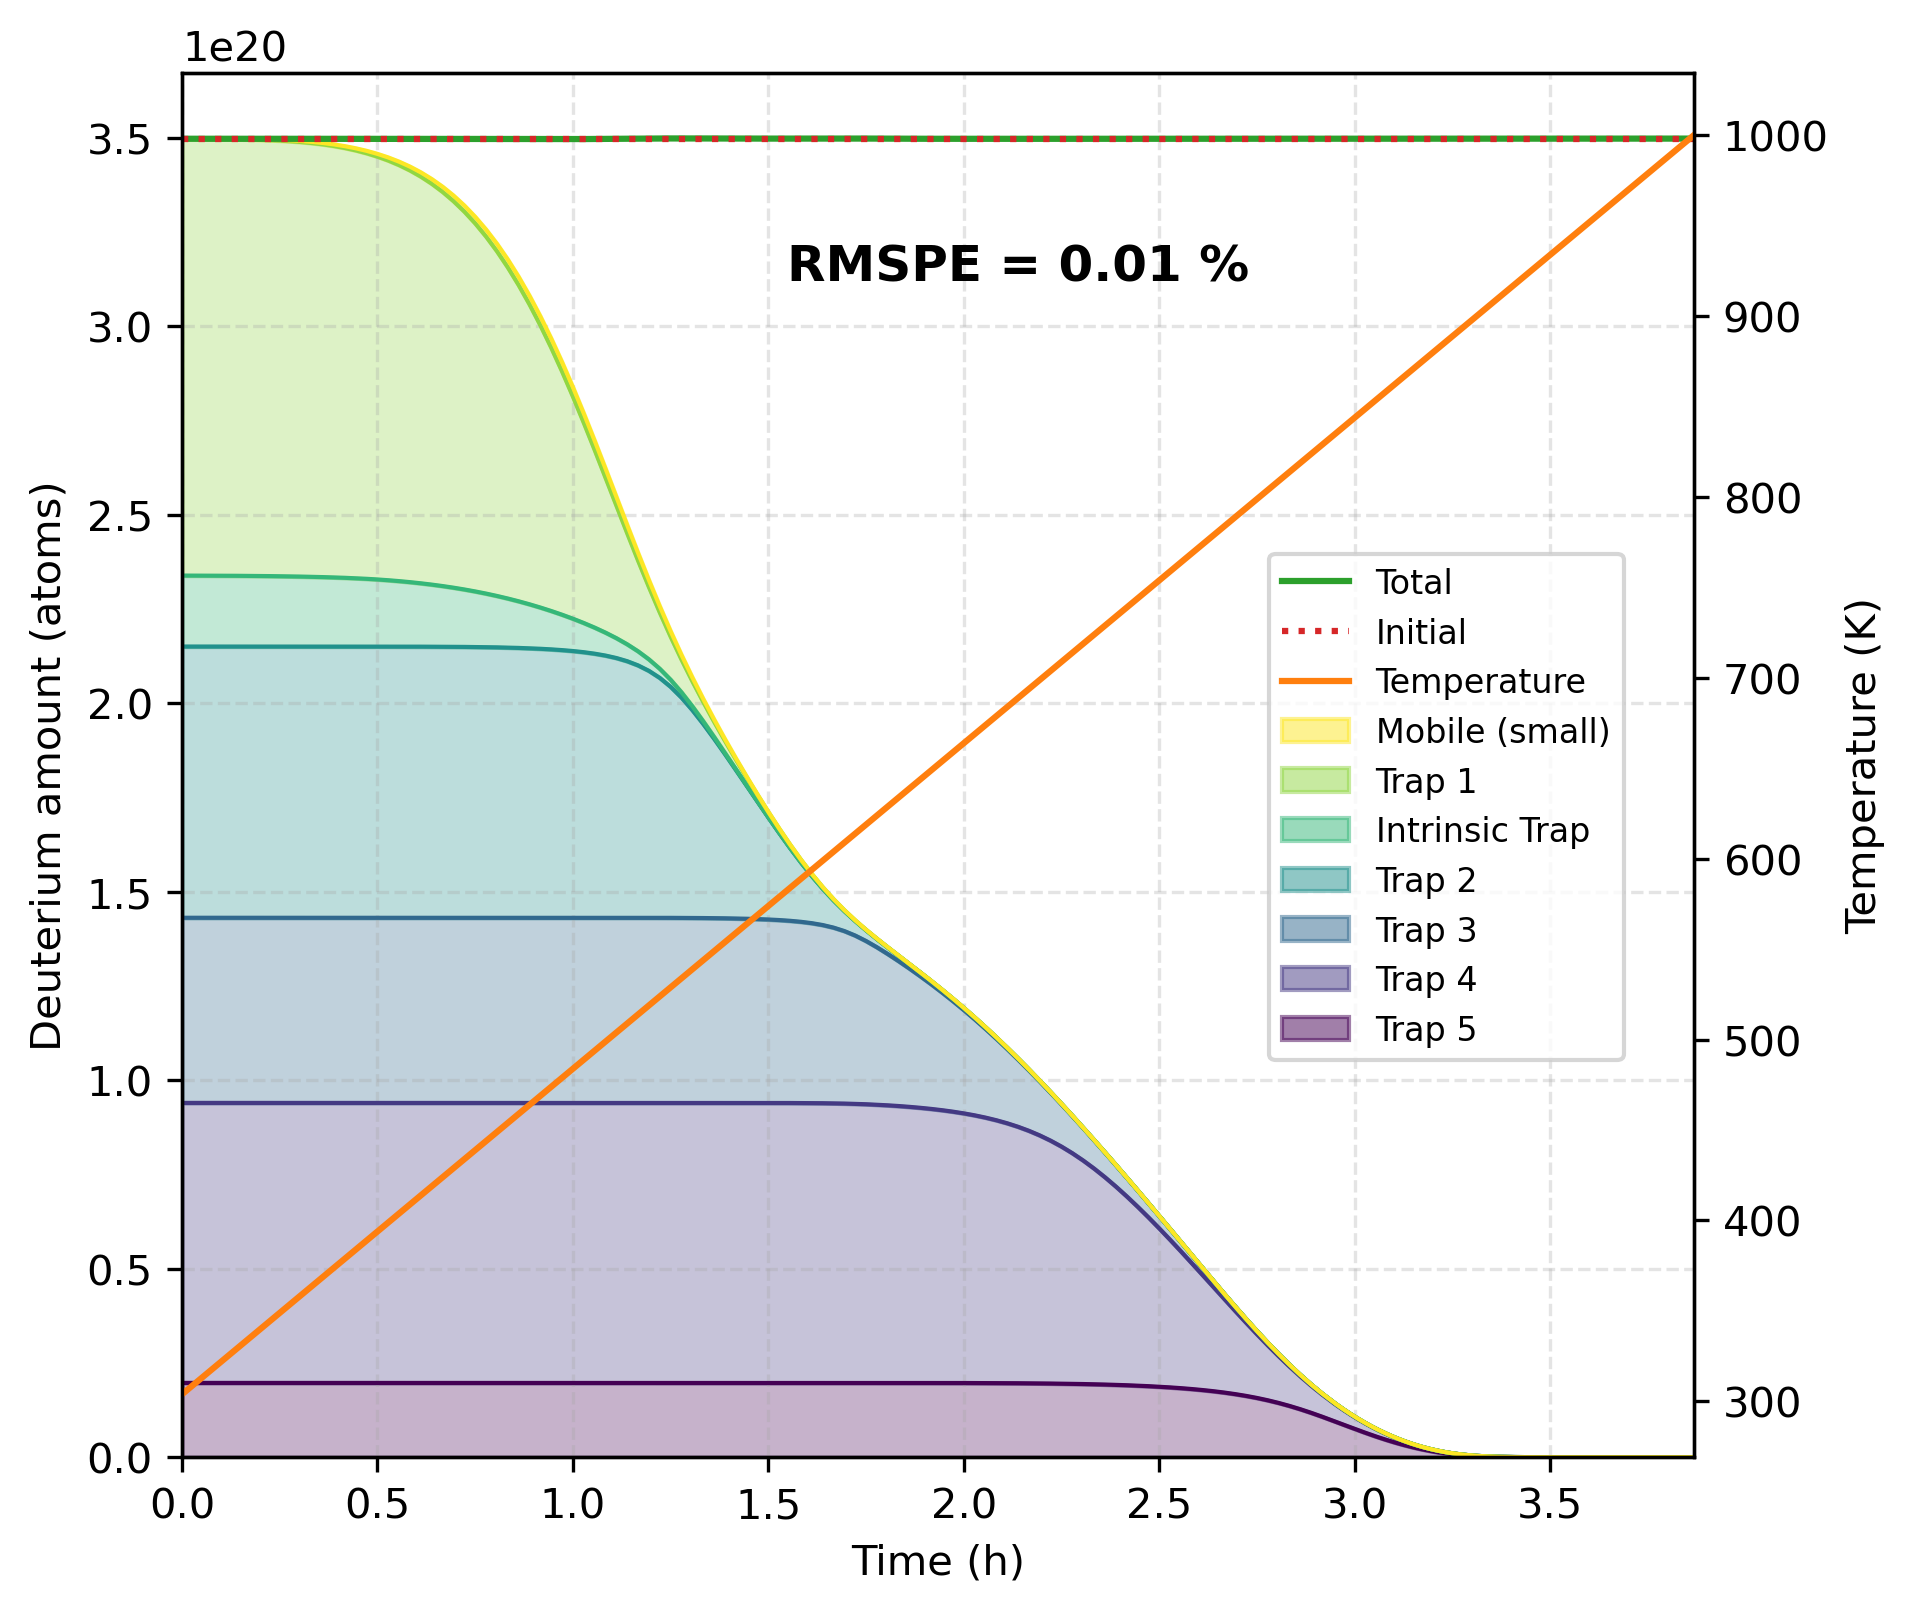
Figure 6: Quantity of deuterium atoms during the desorption process for an adapted recombination rate and uncalibrated trapping properties.
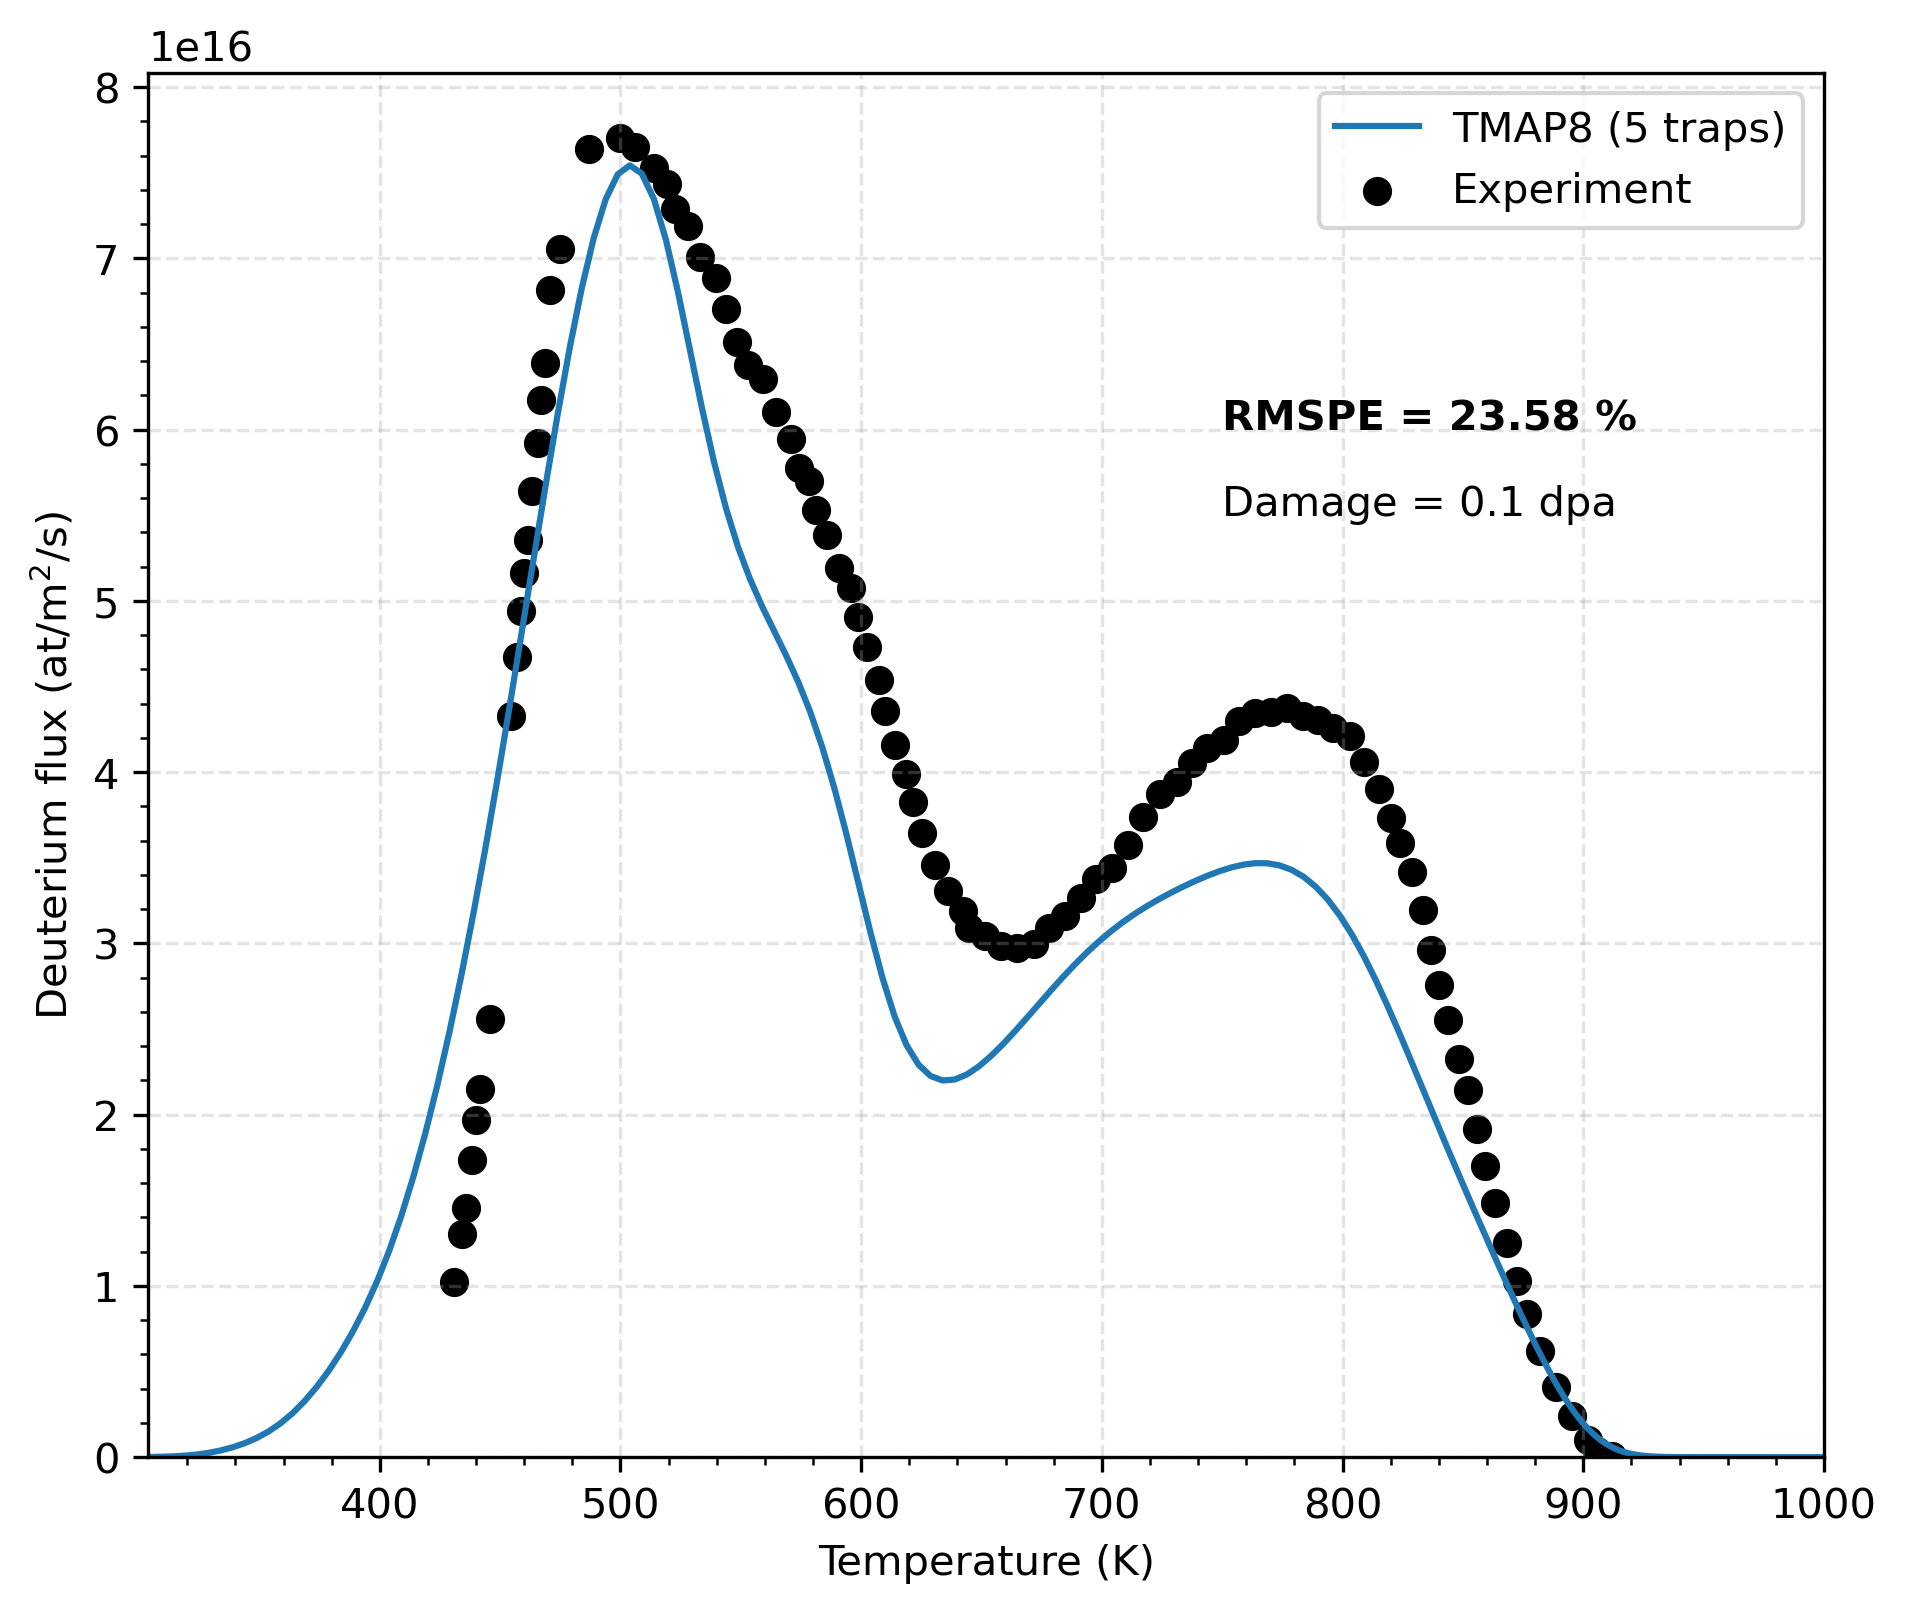
Figure 7: Comparison of TMAP8 calculations with experimental data on deuterium flux (atoms/m/s) for a damage of 0.1 dpa, an adapted recombination rate and uncalibrated trapping properties.
Input files
The input file for this case can be found at (test/tests/val-2f/val-2f.i). To minimize the length of the input file and organize it, it is divided into several parts:
(test/tests/val-2f/parameters_val-2f.params) lists the key values and model parameters used in this simulation
(test/tests/val-2f/val-2f_trapping_intrinsic.i) provides the blocks necessary to introduce the intrinsic traps in the simulation
(test/tests/val-2f/val-2f_trapping_1.i), (test/tests/val-2f/val-2f_trapping_2.i), (test/tests/val-2f/val-2f_trapping_3.i), (test/tests/val-2f/val-2f_trapping_4.i), (test/tests/val-2f/val-2f_trapping_5.i) provide the blocks necessary to introduce the trapping sites 1, 2, 3, 4, and 5, respectively, in the simulation.
To combine them into one input file when running the simulation, (test/tests/val-2f/val-2f.i) uses the !include feature.
To learn more about the !include feature, refer to the Input File Syntax page.
Note that both surface conditions can be modeled using (test/tests/val-2f/val-2f.i). By running it as is, the recombination condition with the updated recombination rate is utilized. (test/tests/val-2f/tests) used cli_args to modify (test/tests/val-2f/val-2f.i) into using the effectively infinite recombination rate at the surface and impose a null concentration at the surfaces.
To limit the computational costs of the test case, the test runs a version of the file with a smaller and coarser mesh, and fewer time steps. More information about the changes can be found in the test specification file for this case, namely (test/tests/val-2f/tests).
References
- James Dark, Rémi Delaporte-Mathurin, Thomas Schwarz-Selinger, Etienne A Hodille, Jonathan Mougenot, Yann Charles, and Christian Grisolia.
Modelling neutron damage effects on tritium transport in tungsten.
Nuclear Fusion, 64(8):086026, 2024.[BibTeX]
- Mingzhong Zhao, Shota Yamazaki, Takuro Wada, Ayaka Koike, Fei Sun, Naoko Ashikawa, Yoji Someya, Tetsu Mieno, and Yasuhisa Oya.
Deuterium recombination coefficient on tungsten surface determined by plasma driven permeation.
Fusion Engineering and Design, 160:111853, 2020.[BibTeX]