Co-permeation of H and D through Pd
Model Description
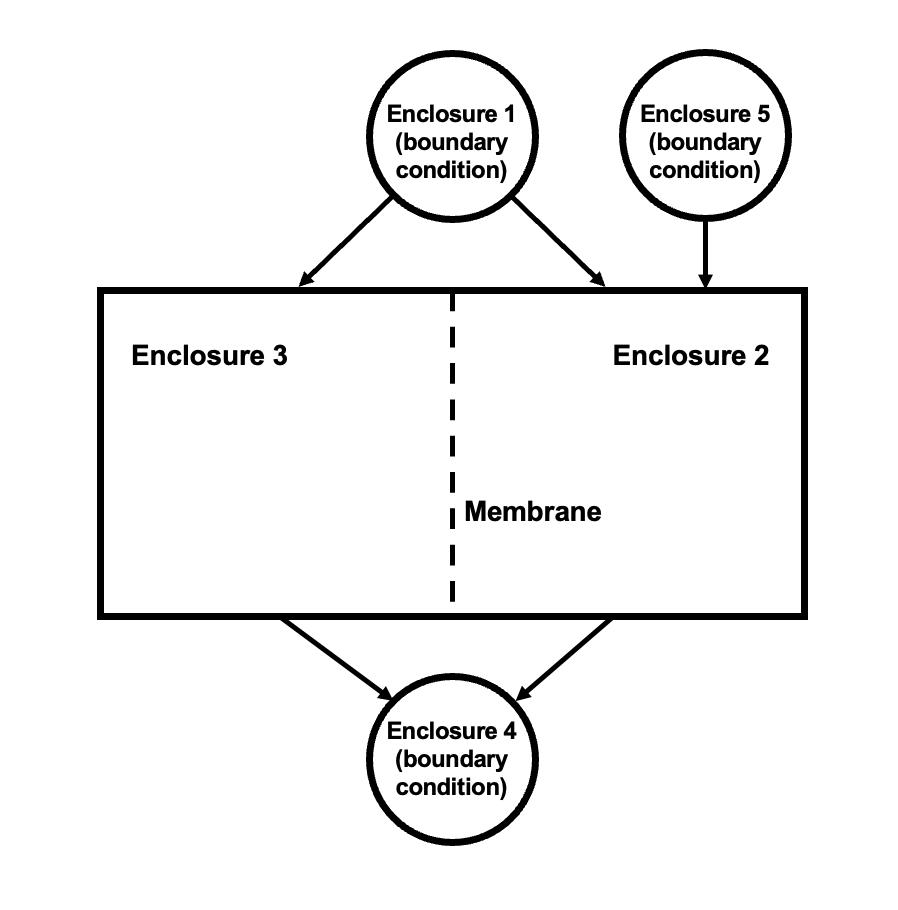
In the first three cases (val-2ea, val-2eb, and val-2ec), TMAP8 simulates a one-dimensional domain to represent the deuterium diffusion and gas flowing in the enclosures. Note that this case can easily be extended to a two- or three-dimensional case.
This model considers the diffusion of deuterium on both sides of the Pd membrane. First, the diffusion of deuterium in the membrane is described as:
(1)
where is the concentration of hydrogen isotope in membrane, represents hydrogen isotope H or D, is the time, is the diffusivity of hydrogen isotope .
The flow of gas into enclosures 2 and 3 can be given by
(2)
where is the volumetric flow rate of always 0.1 m/s, is the volume of current enclosure , and are the pressure of gas molecules in the previous enclosure and current enclosure , gas molecules represents H, or D, or HD.
The hydrogen isotopes recombine into gas on both sides of the membrane, and there are several ways to model this process, two of which are used in this validation case: (1) Assuming steady state at the surface, also called lawdep boundary conditions in TMAP4 and TMAP7 (Ambrosek and Longhurst, 2008), and (2) capturing the kinetics of dissociation and recombination, also called ratedep conditions in TMAP4 and TMAP7 (Ambrosek and Longhurst, 2008).
By assuming that the kinetics of the dissociation and recombination processes are faster than diffusion, surface reactions can be assumed to be at steady state. The concentrations on both sides can then be described as
(3)
where is the solubility of hydrogen isotope in the membrane, and is the exponent for the relation of pressure and concentration.
However, for the kinetics of surface reactions to be captured, the boundary conditions is set as
(4)
where is the recombination flux of hydrogen isotope out of the sample sides in enclosure , is the area on either side of the membrane, and and are the recombination and dissociation coefficients, respectively. The coefficient of 2 accounts for the fact that 2 atoms (D and H) form one isotope molecule (HD).
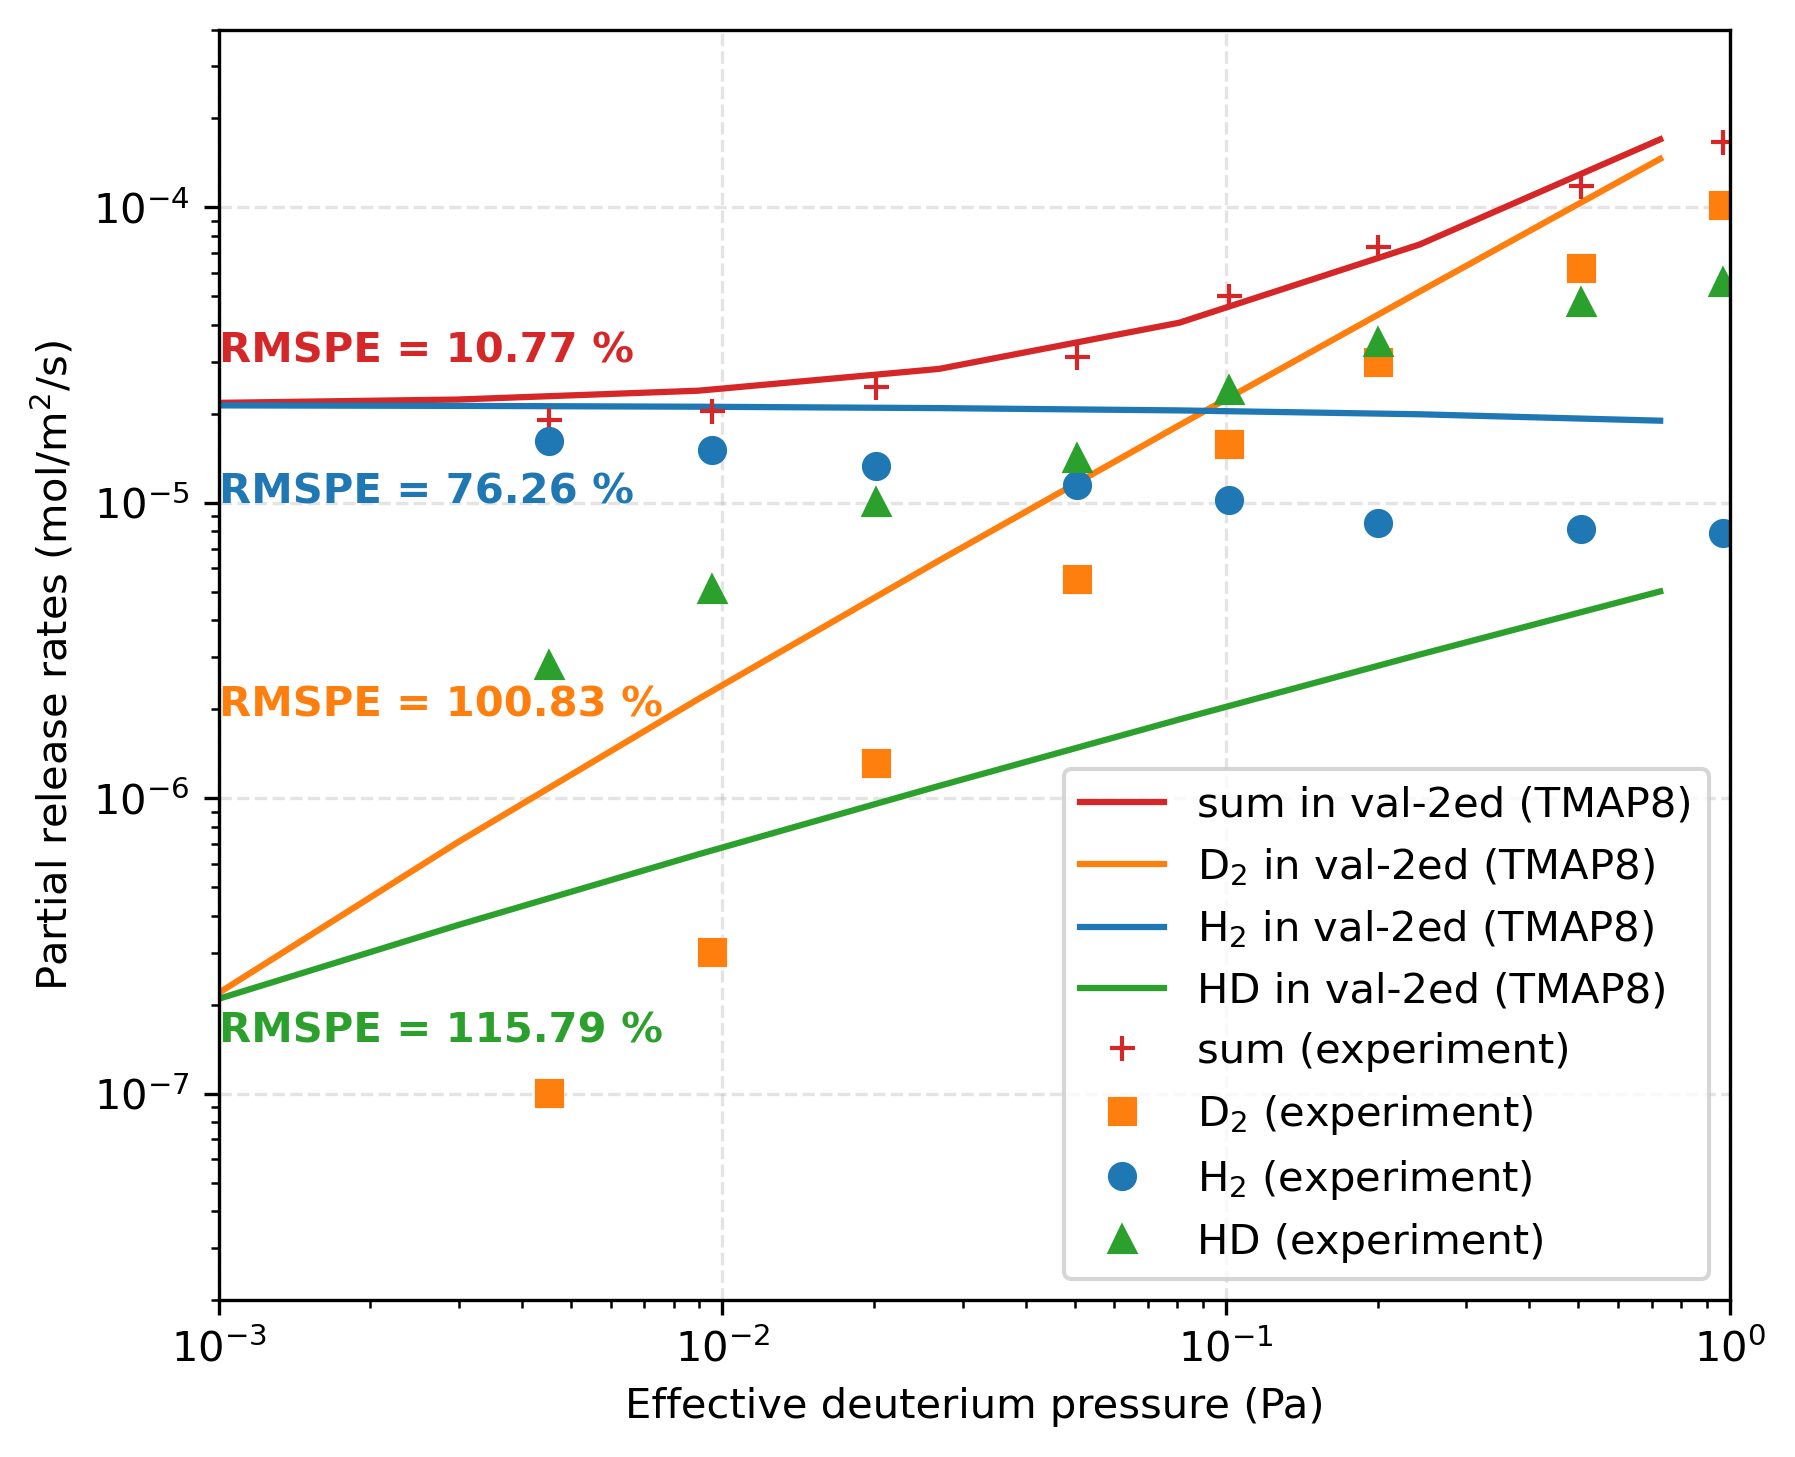
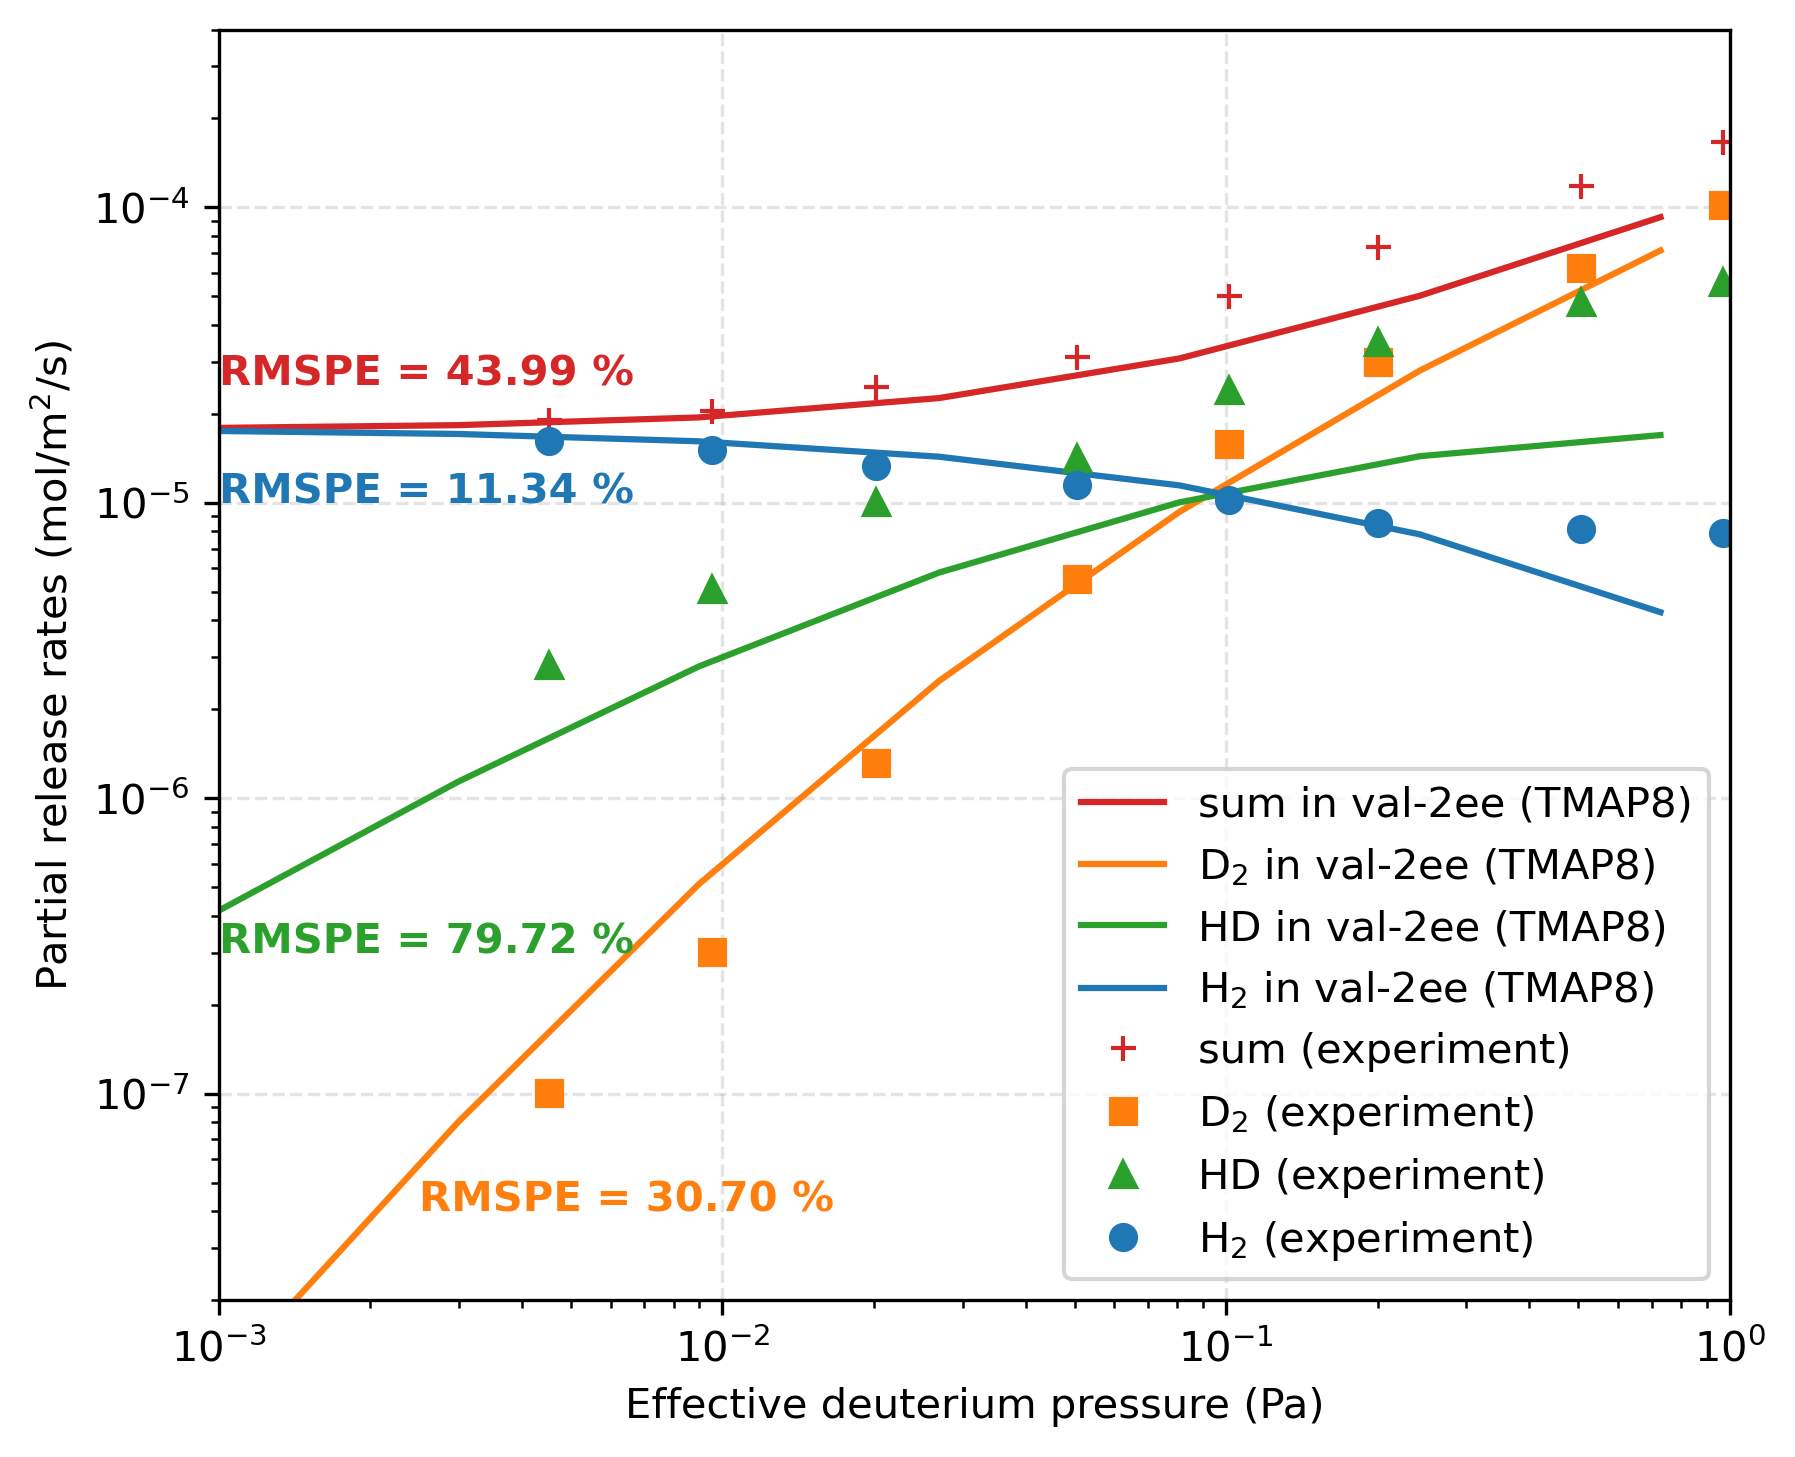
The two co-permeation simulations, i.e., val-2ed and val-2ec, also include the chemical reactions in the upstream and downstream enclosure. The reaction rates for H, D, and HD are described by
(5)
for lawdep boundary condition and
(6)
for ratedep boundary condition, where is the Boltzmann’s constant, is the surface area of the membrane, are the temperature.
(test/tests/val-2e/val-2ea.i)
# Validation Problem #2ea from TMAP7's V&V document
# Deuterium permeation through 0.05-mm Pd at 825 K.
# No Soret effect, or trapping included.
# Necessary physical and model parameters (kb, R, temperature)
!include parameters_deuterium_gas.params
# Enclosure data used in TMAP7 case
pressure_enclosure1 = '${units 1e-6 Pa}'
pressure_initial = '${units 1e-6 Pa}'
# Modeling data used in current case
slab_thickness = '${units 5e-5 m -> mum}'
file_name = 'val-2ea_out'
simulation_time = '${units 1900 s}'
!include val-2e_base.i
# Diffusion data used in TMAP7 case
solubility_exponent = 0.9297 # -
solubility_pre = '${units ${fparse 1.511e23 / 1e18} at/mum^3/Pa^0.9297}'
solubility_energy = '${units ${fparse 5918 * R} J/mol}'
[Variables]
[D2_pressure_upstream]
initial_condition = '${pressure_initial}'
[]
[D2_pressure_downstream]
initial_condition = '${pressure_initial}'
[]
[D_concentration]
initial_condition = 0
[]
[]
[AuxVariables]
[D2_pressure_enclosure1]
initial_condition = '${pressure_enclosure1}'
[]
[D2_pressure_enclosure4]
initial_condition = '${pressure_enclosure4}'
[]
[D2_pressure_enclosure5]
[]
[]
[AuxKernels]
[D2_pressure_enclosure5_kernel]
type = FunctionAux
variable = D2_pressure_enclosure5
function = D2_pressure_enclosure5_function
[]
[]
[Functions]
[D2_pressure_enclosure5_function]
type = ParsedFunction
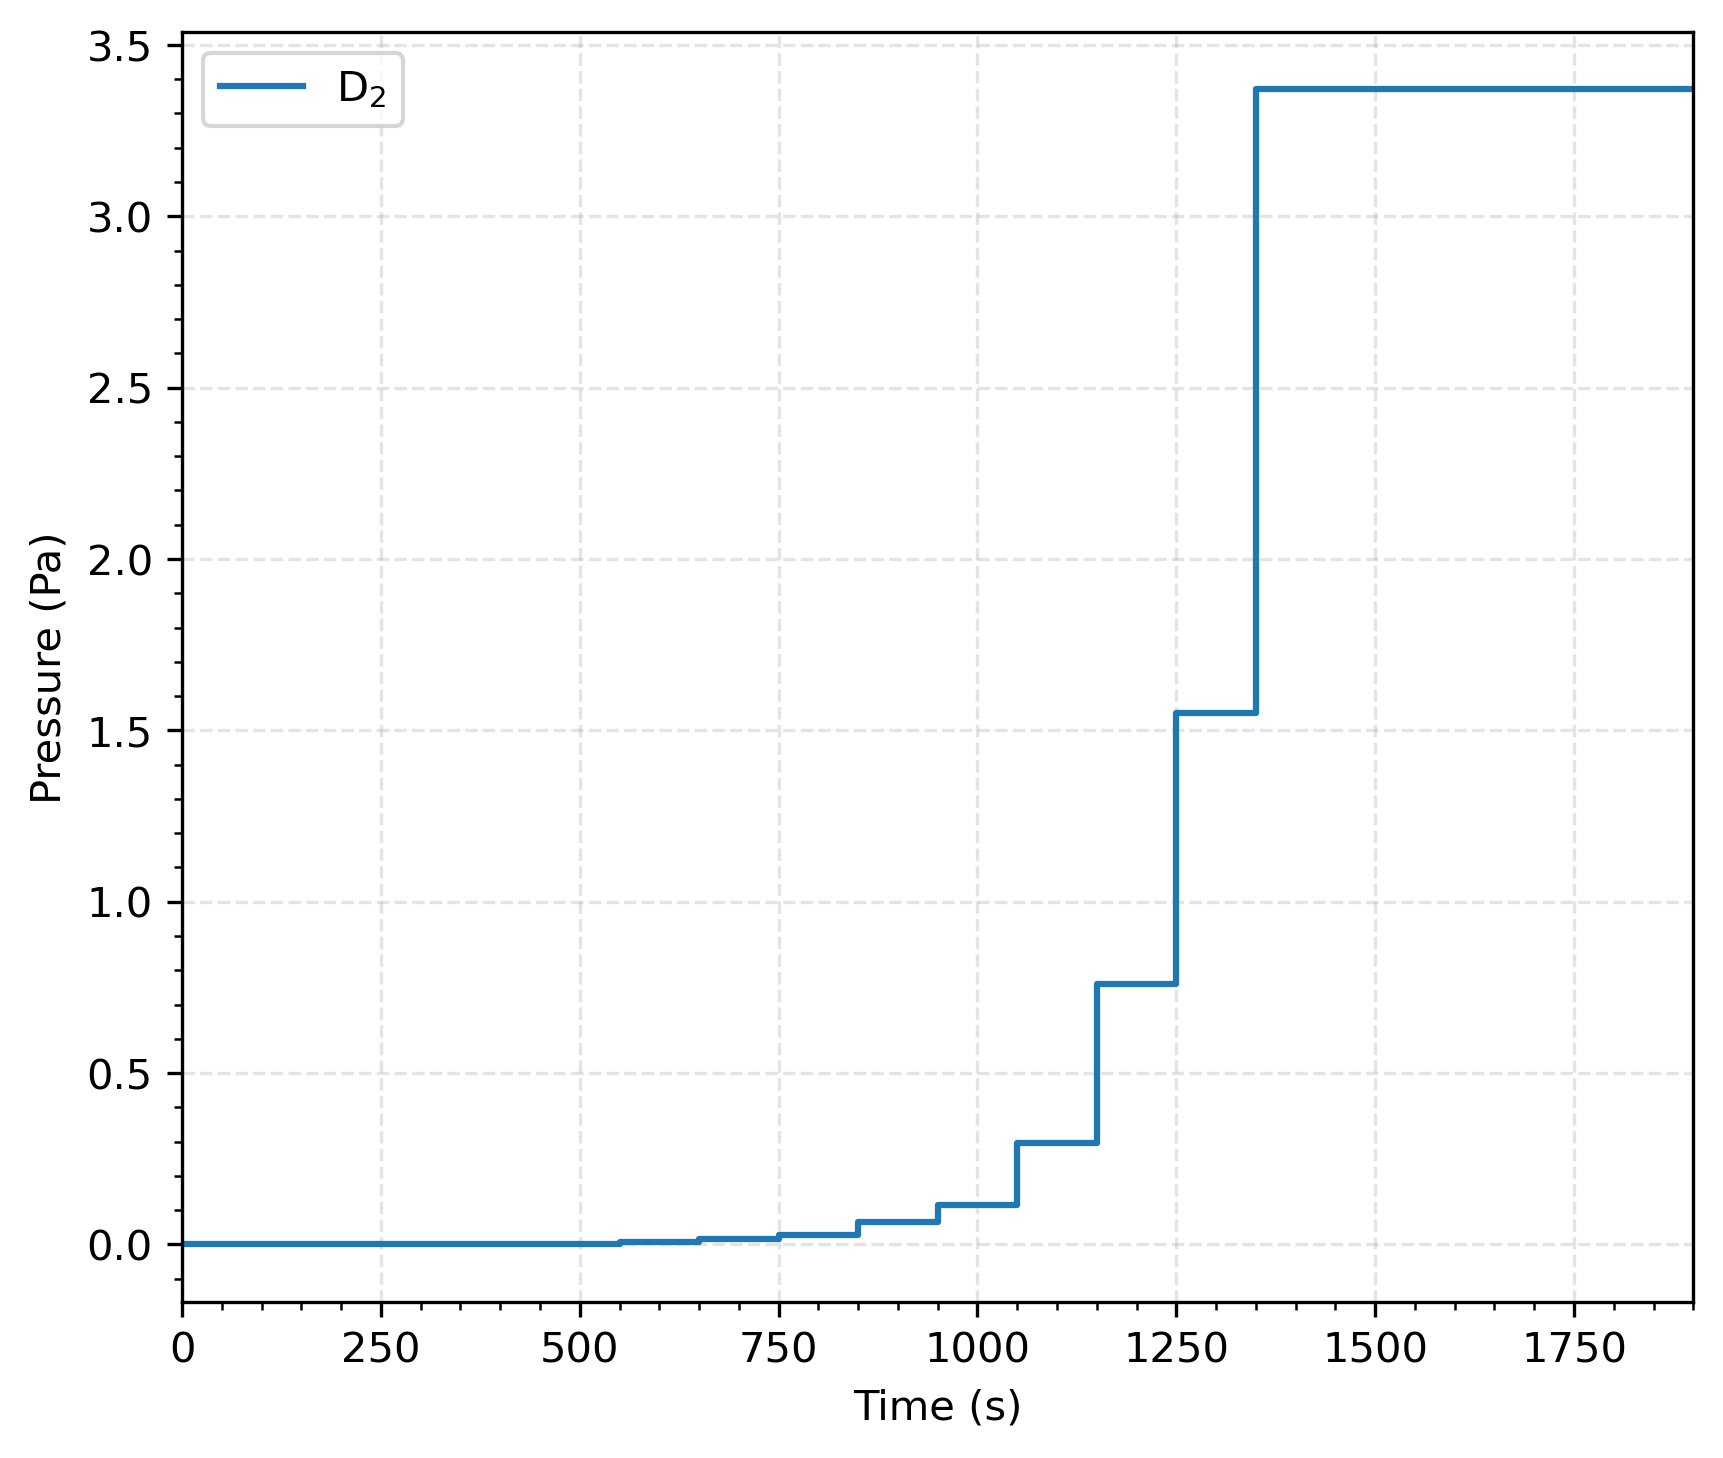
expression = 'if(t < 150, 1.20e-4,
if(t < 250, 2.41e-4,
if(t < 350, 6.06e-4,
if(t < 450, 1.30e-3,
if(t < 550, 2.53e-3,
if(t < 650, 7.08e-3,
if(t < 750, 1.45e-2,
if(t < 850, 2.63e-2,
if(t < 950, 6.51e-2,
if(t < 1050, 0.116,
if(t < 1150, 0.297,
if(t < 1250, 0.760,
if(t < 1350, 1.550,
if(t < 1900, 3.370, 3.370))))))))))))))'
[]
[]
[Kernels]
# Gas flow kernels
# Equation for enclosure upstream
[MatReaction_upstream_D2_outflux_membrane]
type = ADMatBodyForce
variable = D2_pressure_upstream
material_property = 'membrane_reaction_rate_right'
extra_vector_tags = 'ref'
[]
# Equation for enclosure downstream
[MatReaction_downstream_D2_influx_membrane]
type = ADMatBodyForce
variable = D2_pressure_downstream
material_property = 'membrane_reaction_rate_left'
extra_vector_tags = 'ref'
[]
[]
[Materials]
[membrane_reaction_rate_right]
type = ADParsedMaterial
property_name = 'membrane_reaction_rate_right'
postprocessor_names = flux_surface_right_D
expression = 'flux_surface_right_D * ${surface_area} / ${volume_enclosure} * ${concentration_to_pressure_conversion_factor} / 2'
outputs = 'exodus'
[]
[membrane_reaction_rate_left]
type = ADParsedMaterial
property_name = 'membrane_reaction_rate_left'
postprocessor_names = flux_surface_left_D
expression = 'flux_surface_left_D * ${surface_area} / ${volume_enclosure} * ${concentration_to_pressure_conversion_factor} / 2'
outputs = 'exodus'
[]
[converter_to_regular]
type = MaterialADConverter
ad_props_in = 'diffusivity_D'
reg_props_out = 'diffusivity_D_nonAD'
outputs = none
[]
[]
[BCs]
# The surface of the slab in contact with the source is assumed to be in equilibrium with the source enclosure
[right_diffusion]
type = EquilibriumBC
variable = D_concentration
enclosure_var = D2_pressure_upstream
boundary = 'right'
Ko = '${solubility_pre}'
activation_energy = '${solubility_energy}'
p = '${solubility_exponent}'
temperature = ${temperature}
[]
[left_diffusion]
type = EquilibriumBC
variable = D_concentration
enclosure_var = D2_pressure_downstream
boundary = 'left'
Ko = '${solubility_pre}'
activation_energy = '${solubility_energy}'
p = '${solubility_exponent}'
temperature = ${temperature}
[]
[]
(test/tests/val-2e/val-2e_base_three_gases.i)
# Base input file for Validation Problem #2ed 2ee
# Except for the blocks in val-2e_base.i
# Include [Variables], [AuxVariables], [AuxKernels], [Functions],
# [Kernels] for H2, HD, and H, [Materials] for H,
# [Postprocessors] for H2, HD, and H blocks
# This input file is not meant to run on its own and is included in case-specific input files.
# Enclosure data used in TMAP7 case
pressure_enclosure1 = '${units 1e-7 Pa}'
pressure_initial_enclosure2 = '${units 1e-7 Pa}'
pressure_initial_enclosure2_H2 = '${units 0.063 Pa}'
pressure_initial_enclosure3 = '${units 1e-20 Pa}'
# Modeling data used in current case
slab_thickness = '${units 2.5e-5 m -> mum}'
simulation_time = '${units 1000 s}'
# Diffusion data used in TMAP7 case
diffusivity_pre_H = '${units 3.728e-4 m^2/s -> mum^2/s}'
diffusivity_energy_H = '${units ${fparse 1315.8 * R} J/mol}'
!include val-2e_base.i
[Variables]
[D2_pressure_upstream]
initial_condition = '${pressure_initial_enclosure2}'
[]
[H2_pressure_upstream]
initial_condition = '${pressure_initial_enclosure2_H2}'
[]
[HD_pressure_upstream]
initial_condition = '${pressure_initial_enclosure2}'
[]
[D2_pressure_downstream]
initial_condition = '${pressure_initial_enclosure3}'
[]
[H2_pressure_downstream]
initial_condition = '${pressure_initial_enclosure3}'
[]
[HD_pressure_downstream]
initial_condition = '${pressure_initial_enclosure3}'
[]
[D_concentration]
initial_condition = 0
[]
[H_concentration]
initial_condition = 0
[]
[]
[AuxVariables]
[D2_pressure_enclosure1]
initial_condition = '${pressure_enclosure1}'
[]
[H2_pressure_enclosure1]
initial_condition = '${pressure_enclosure1}'
[]
[HD_pressure_enclosure1]
initial_condition = '${pressure_enclosure1}'
[]
[D2_pressure_enclosure4]
initial_condition = '${pressure_enclosure4}'
[]
[H2_pressure_enclosure4]
initial_condition = '${pressure_enclosure4}'
[]
[HD_pressure_enclosure4]
initial_condition = '${pressure_enclosure4}'
[]
[D2_pressure_enclosure5]
initial_condition = 1.8421e-4
[]
[H2_pressure_enclosure5]
initial_condition = '${pressure_initial_enclosure2_H2}'
[]
[HD_pressure_enclosure5]
initial_condition = '${pressure_enclosure4}'
[]
[D2_partial_pressure_upstream]
initial_condition = '${fparse pressure_initial_enclosure2 + pressure_initial_enclosure2/2}'
[]
[D2_partial_pressure_downstream]
initial_condition = '${fparse pressure_initial_enclosure3 + pressure_initial_enclosure3/2}'
[]
[H2_partial_pressure_upstream]
initial_condition = '${fparse pressure_initial_enclosure2_H2 + pressure_initial_enclosure2/2}'
[]
[H2_partial_pressure_downstream]
initial_condition = '${fparse pressure_initial_enclosure3 + pressure_initial_enclosure3/2}'
[]
[sqrt_PH2_sqrt_PD2_upstream]
[]
[sqrt_PH2_sqrt_PD2_downstream]
[]
[HD_pressure_upstream_reference]
[]
[HD_pressure_downstream_reference]
[]
[]
[AuxKernels]
[D2_pressure_enclosure5_kernel]
type = FunctionAux
variable = D2_pressure_enclosure5
function = D2_pressure_enclosure5_function
[]
[H2_pressure_enclosure5_kernel]
type = FunctionAux
variable = H2_pressure_enclosure5
function = H2_pressure_enclosure5_function
[]
[sqrt_PH2_sqrt_PD2_upstream_kernel]
type = ParsedAux
variable = sqrt_PH2_sqrt_PD2_upstream
coupled_variables = 'D2_pressure_upstream H2_pressure_upstream'
expression = 'sqrt(D2_pressure_upstream) * sqrt(H2_pressure_upstream)'
[]
[sqrt_PH2_sqrt_PD2_downstream_kernel]
type = ParsedAux
variable = sqrt_PH2_sqrt_PD2_downstream
coupled_variables = 'D2_pressure_downstream H2_pressure_downstream'
expression = 'sqrt(D2_pressure_downstream) * sqrt(H2_pressure_downstream)'
[]
[D2_partial_pressure_upstream_kernel]
type = ParsedAux
variable = D2_partial_pressure_upstream
coupled_variables = 'D2_pressure_upstream HD_pressure_upstream'
expression = 'D2_pressure_upstream + HD_pressure_upstream / 2'
[]
[D2_partial_pressure_downstream_kernel]
type = ParsedAux
variable = D2_partial_pressure_downstream
coupled_variables = 'D2_pressure_downstream HD_pressure_downstream'
expression = 'D2_pressure_downstream + HD_pressure_downstream / 2'
[]
[H2_partial_pressure_upstream_kernel]
type = ParsedAux
variable = H2_partial_pressure_upstream
coupled_variables = 'H2_pressure_upstream HD_pressure_upstream'
expression = 'H2_pressure_upstream + HD_pressure_upstream / 2'
[]
[H2_partial_pressure_downstream_kernel]
type = ParsedAux
variable = H2_partial_pressure_downstream
coupled_variables = 'H2_pressure_downstream HD_pressure_downstream'
expression = 'H2_pressure_downstream + HD_pressure_downstream / 2'
[]
[HD_pressure_upstream_reference_kernel]
type = ParsedAux
variable = HD_pressure_upstream_reference
coupled_variables = 'D2_pressure_upstream H2_pressure_upstream'
expression = '2 * sqrt(D2_pressure_upstream) * sqrt(H2_pressure_upstream)'
[]
[HD_pressure_downstream_reference_kernel]
type = ParsedAux
variable = HD_pressure_downstream_reference
coupled_variables = 'D2_pressure_downstream H2_pressure_downstream'
expression = '2 * sqrt(D2_pressure_downstream) * sqrt(H2_pressure_downstream)'
[]
[]
[Functions]
[D2_pressure_enclosure5_function]
type = ParsedFunction
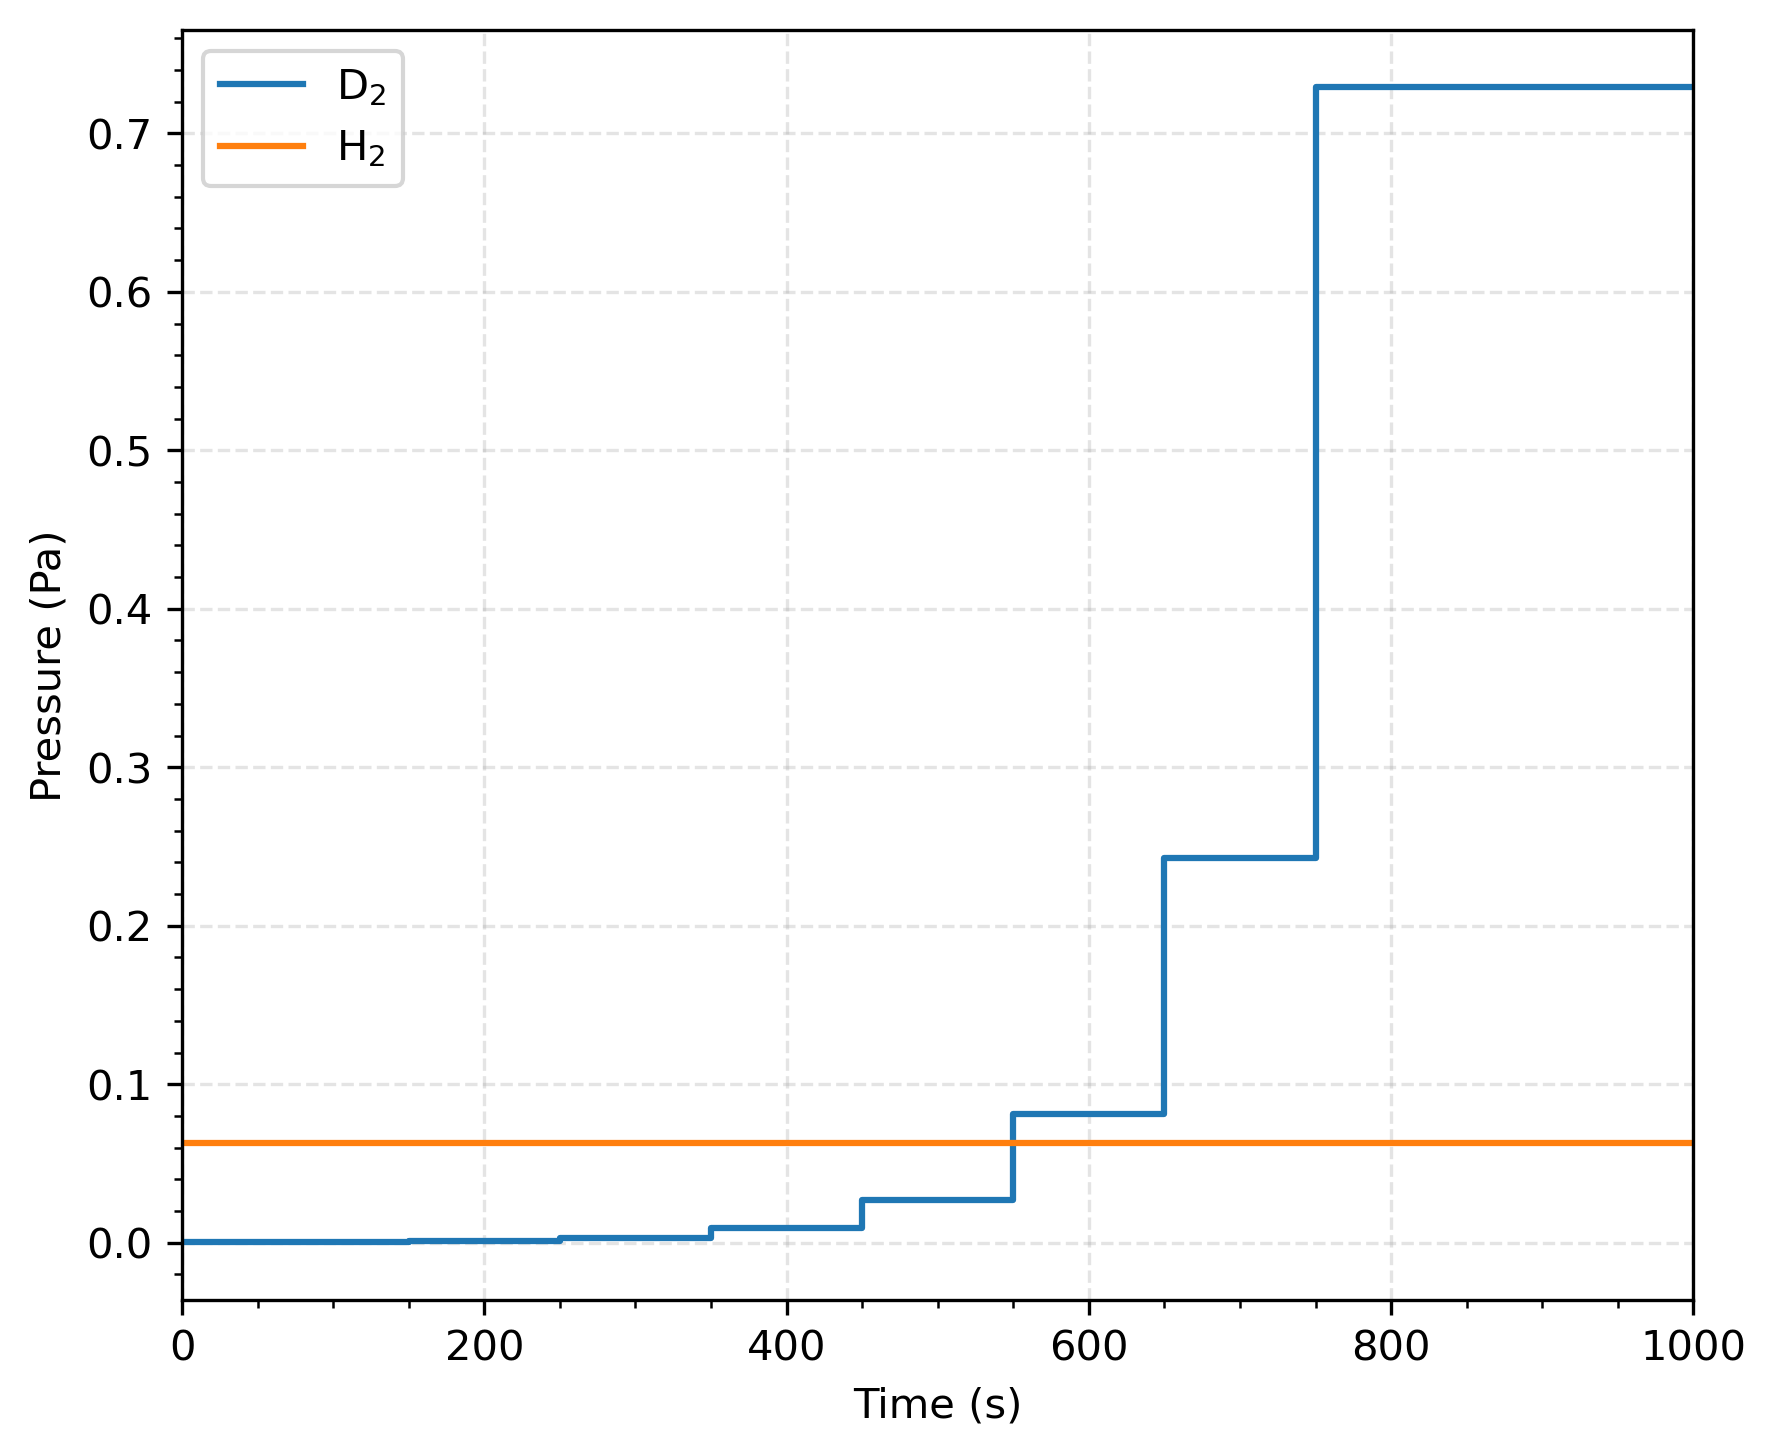
expression = 'if(t < 150, 1.8421e-4,
if(t < 250, 1e-3,
if(t < 350, 3e-3,
if(t < 450, 0.009,
if(t < 550, 0.027,
if(t < 650, 0.081,
if(t < 750, 0.243,
if(t < ${simulation_time}, 0.729, 0.729))))))))'
[]
[H2_pressure_enclosure5_function]
type = ParsedFunction
expression = '${pressure_initial_enclosure2_H2}' # Pa
[]
[]
[Kernels]
# Gas flow kernels
# Equation for D2 in enclosure upstream in val-2e_base.i
# Equation for H2 in enclosure upstream
[timeDerivative_upstream_H2]
type = ADTimeDerivative
variable = H2_pressure_upstream
extra_vector_tags = 'ref'
[]
[MatReaction_upstream_H2_influx_5]
type = ADMatReaction
variable = H2_pressure_upstream
v = 'H2_pressure_enclosure5'
reaction_rate = ${flow_rate_by_V}
extra_vector_tags = 'ref'
[]
[MatReaction_upstream_H2_influx_1]
type = ADMatReaction
variable = H2_pressure_upstream
v = 'H2_pressure_enclosure1'
reaction_rate = ${flow_rate_by_V}
extra_vector_tags = 'ref'
[]
[MatReaction_upstream_H2_outflux_4]
type = ADMatReaction
variable = H2_pressure_upstream
v = 'H2_pressure_upstream'
reaction_rate = -${flow_rate_by_V}
extra_vector_tags = 'ref'
[]
# Equation for HD in enclosure upstream
[timeDerivative_upstream_HD]
type = ADTimeDerivative
variable = HD_pressure_upstream
extra_vector_tags = 'ref'
[]
[MatReaction_upstream_HD_influx_5]
type = ADMatReaction
variable = HD_pressure_upstream
v = 'HD_pressure_enclosure5'
reaction_rate = ${flow_rate_by_V}
extra_vector_tags = 'ref'
[]
[MatReaction_upstream_HD_influx_1]
type = ADMatReaction
variable = HD_pressure_upstream
v = 'HD_pressure_enclosure1'
reaction_rate = ${flow_rate_by_V}
extra_vector_tags = 'ref'
[]
[MatReaction_upstream_HD_outflux_4]
type = ADMatReaction
variable = HD_pressure_upstream
v = 'HD_pressure_upstream'
reaction_rate = -${flow_rate_by_V}
extra_vector_tags = 'ref'
[]
# Equation for D2 enclosure downstream in val-2e_base.i
# Equation for H2 enclosure downstream
[timeDerivative_downstream_H2]
type = ADTimeDerivative
variable = H2_pressure_downstream
extra_vector_tags = 'ref'
[]
[MatReaction_downstream_H2_influx_1]
type = ADMatReaction
variable = H2_pressure_downstream
v = 'H2_pressure_enclosure1'
reaction_rate = ${flow_rate_by_V}
extra_vector_tags = 'ref'
[]
[MatReaction_downstream_H2_outflux_4]
type = ADMatReaction
variable = H2_pressure_downstream
v = 'H2_pressure_downstream'
reaction_rate = -${flow_rate_by_V}
extra_vector_tags = 'ref'
[]
# Equation for HD enclosure downstream
[timeDerivative_downstream_HD]
type = ADTimeDerivative
variable = HD_pressure_downstream
extra_vector_tags = 'ref'
[]
[MatReaction_downstream_HD_influx_1]
type = ADMatReaction
variable = HD_pressure_downstream
v = 'HD_pressure_enclosure1'
reaction_rate = ${flow_rate_by_V}
extra_vector_tags = 'ref'
[]
[MatReaction_downstream_HD_outflux_4]
type = ADMatReaction
variable = HD_pressure_downstream
v = 'HD_pressure_downstream'
reaction_rate = -${flow_rate_by_V}
extra_vector_tags = 'ref'
[]
# Diffusion kernels
[timeDerivative_diffusion_H]
type = ADTimeDerivative
variable = H_concentration
extra_vector_tags = 'ref'
[]
[MatDiffusion_diffusion_H]
type = ADMatDiffusion
variable = H_concentration
diffusivity = diffusivity_H
extra_vector_tags = 'ref'
[]
[]
[Materials]
[diffusivity_H]
type = ADParsedMaterial
property_name = 'diffusivity_H'
expression = '${diffusivity_pre_H} * exp( - ${diffusivity_energy_H} / ${R} / ${temperature})'
[]
[converter_to_regular]
type = MaterialADConverter
ad_props_in = 'diffusivity_D diffusivity_H'
reg_props_out = 'diffusivity_D_nonAD diffusivity_H_nonAD'
outputs = none
[]
[]
[Postprocessors]
# Pressure
[pressure_upstream_H2]
type = SideAverageValue
variable = H2_pressure_upstream
boundary = right
[]
[pressure_downstream_H2]
type = SideAverageValue
variable = H2_pressure_downstream
boundary = left
[]
[pressure_upstream_HD]
type = SideAverageValue
variable = HD_pressure_upstream
boundary = right
[]
[pressure_upstream_HD_reference]
type = SideAverageValue
variable = HD_pressure_upstream_reference
boundary = right
[]
[pressure_downstream_HD]
type = SideAverageValue
variable = HD_pressure_downstream
boundary = left
[]
[pressure_downstream_HD_reference]
type = SideAverageValue
variable = HD_pressure_downstream_reference
boundary = left
[]
# Flux
[flux_surface_right_H]
type = SideDiffusiveFluxIntegral
variable = H_concentration
diffusivity = diffusivity_H_nonAD
boundary = 'right'
execute_on = 'initial timestep_end'
outputs = 'console csv exodus'
[]
[flux_surface_left_H]
type = SideDiffusiveFluxIntegral
variable = H_concentration
diffusivity = diffusivity_H_nonAD
boundary = 'left'
execute_on = 'initial timestep_end'
outputs = 'console csv exodus'
[]
[]
(test/tests/val-2e/val-2ea.i)
# Validation Problem #2ea from TMAP7's V&V document
# Deuterium permeation through 0.05-mm Pd at 825 K.
# No Soret effect, or trapping included.

# Necessary physical and model parameters (kb, R, temperature)
!include parameters_deuterium_gas.params

# Enclosure data used in TMAP7 case
pressure_enclosure1 = '${units 1e-6 Pa}'
pressure_initial = '${units 1e-6 Pa}'

# Modeling data used in current case
slab_thickness = '${units 5e-5 m -> mum}'
file_name = 'val-2ea_out'
simulation_time = '${units 1900 s}'

!include val-2e_base.i

# Diffusion data used in TMAP7 case
solubility_exponent = 0.9297 # -
solubility_pre = '${units ${fparse 1.511e23 / 1e18} at/mum^3/Pa^0.9297}'
solubility_energy = '${units ${fparse 5918 * R} J/mol}'

[Variables]
  [D2_pressure_upstream]
    initial_condition = '${pressure_initial}'
  []
  [D2_pressure_downstream]
    initial_condition = '${pressure_initial}'
  []
  [D_concentration]
    initial_condition = 0
  []
[]

[AuxVariables]
  [D2_pressure_enclosure1]
    initial_condition = '${pressure_enclosure1}'
  []
  [D2_pressure_enclosure4]
    initial_condition = '${pressure_enclosure4}'
  []
  [D2_pressure_enclosure5]
  []
[]

[AuxKernels]
  [D2_pressure_enclosure5_kernel]
    type = FunctionAux
    variable = D2_pressure_enclosure5
    function = D2_pressure_enclosure5_function
  []
[]

[Functions]
  [D2_pressure_enclosure5_function]
    type = ParsedFunction
    expression = 'if(t < 150, 1.20e-4,
                  if(t < 250, 2.41e-4,
                  if(t < 350, 6.06e-4,
                  if(t < 450, 1.30e-3,
                  if(t < 550, 2.53e-3,
                  if(t < 650, 7.08e-3,
                  if(t < 750, 1.45e-2,
                  if(t < 850, 2.63e-2,
                  if(t < 950, 6.51e-2,
                  if(t < 1050, 0.116,
                  if(t < 1150, 0.297,
                  if(t < 1250, 0.760,
                  if(t < 1350, 1.550,
                  if(t < 1900, 3.370, 3.370))))))))))))))'
  []
[]

[Kernels]
  # Gas flow kernels
  # Equation for enclosure upstream
  [MatReaction_upstream_D2_outflux_membrane]
    type = ADMatBodyForce
    variable = D2_pressure_upstream
    material_property = 'membrane_reaction_rate_right'
    extra_vector_tags = 'ref'
  []
  # Equation for enclosure downstream
  [MatReaction_downstream_D2_influx_membrane]
    type = ADMatBodyForce
    variable = D2_pressure_downstream
    material_property = 'membrane_reaction_rate_left'
    extra_vector_tags = 'ref'
  []
[]

[Materials]
  [membrane_reaction_rate_right]
    type = ADParsedMaterial
    property_name = 'membrane_reaction_rate_right'
    postprocessor_names = flux_surface_right_D
    expression = 'flux_surface_right_D * ${surface_area} / ${volume_enclosure} * ${concentration_to_pressure_conversion_factor} / 2'
    outputs = 'exodus'
  []
  [membrane_reaction_rate_left]
    type = ADParsedMaterial
    property_name = 'membrane_reaction_rate_left'
    postprocessor_names = flux_surface_left_D
    expression = 'flux_surface_left_D * ${surface_area} / ${volume_enclosure} * ${concentration_to_pressure_conversion_factor} / 2'
    outputs = 'exodus'
  []
  [converter_to_regular]
    type = MaterialADConverter
    ad_props_in = 'diffusivity_D'
    reg_props_out = 'diffusivity_D_nonAD'
    outputs = none
  []
[]

[BCs]
  # The surface of the slab in contact with the source is assumed to be in equilibrium with the source enclosure
  [right_diffusion]
    type = EquilibriumBC
    variable = D_concentration
    enclosure_var = D2_pressure_upstream
    boundary = 'right'
    Ko = '${solubility_pre}'
    activation_energy = '${solubility_energy}'
    p = '${solubility_exponent}'
    temperature = ${temperature}
  []
  [left_diffusion]
    type = EquilibriumBC
    variable = D_concentration
    enclosure_var = D2_pressure_downstream
    boundary = 'left'
    Ko = '${solubility_pre}'
    activation_energy = '${solubility_energy}'
    p = '${solubility_exponent}'
    temperature = ${temperature}
  []
[]
(test/tests/val-2e/val-2e_base_three_gases.i)
# Base input file for Validation Problem #2ed 2ee
# Except for the blocks in val-2e_base.i
# Include [Variables], [AuxVariables], [AuxKernels], [Functions],
# [Kernels] for H2, HD, and H, [Materials] for H,
# [Postprocessors] for H2, HD, and H blocks

# This input file is not meant to run on its own and is included in case-specific input files.

# Enclosure data used in TMAP7 case
pressure_enclosure1 = '${units 1e-7 Pa}'
pressure_initial_enclosure2 = '${units 1e-7 Pa}'
pressure_initial_enclosure2_H2 = '${units 0.063 Pa}'
pressure_initial_enclosure3 = '${units 1e-20 Pa}'

# Modeling data used in current case
slab_thickness = '${units 2.5e-5 m -> mum}'
simulation_time = '${units 1000 s}'

# Diffusion data used in TMAP7 case
diffusivity_pre_H = '${units 3.728e-4 m^2/s -> mum^2/s}'
diffusivity_energy_H = '${units ${fparse 1315.8 * R} J/mol}'

!include val-2e_base.i

[Variables]
  [D2_pressure_upstream]
    initial_condition = '${pressure_initial_enclosure2}'
  []
  [H2_pressure_upstream]
    initial_condition = '${pressure_initial_enclosure2_H2}'
  []
  [HD_pressure_upstream]
    initial_condition = '${pressure_initial_enclosure2}'
  []

  [D2_pressure_downstream]
    initial_condition = '${pressure_initial_enclosure3}'
  []
  [H2_pressure_downstream]
    initial_condition = '${pressure_initial_enclosure3}'
  []
  [HD_pressure_downstream]
    initial_condition = '${pressure_initial_enclosure3}'
  []

  [D_concentration]
    initial_condition = 0
  []
  [H_concentration]
    initial_condition = 0
  []
[]

[AuxVariables]
  [D2_pressure_enclosure1]
    initial_condition = '${pressure_enclosure1}'
  []
  [H2_pressure_enclosure1]
    initial_condition = '${pressure_enclosure1}'
  []
  [HD_pressure_enclosure1]
    initial_condition = '${pressure_enclosure1}'
  []
  [D2_pressure_enclosure4]
    initial_condition = '${pressure_enclosure4}'
  []
  [H2_pressure_enclosure4]
    initial_condition = '${pressure_enclosure4}'
  []
  [HD_pressure_enclosure4]
    initial_condition = '${pressure_enclosure4}'
  []
  [D2_pressure_enclosure5]
    initial_condition = 1.8421e-4
  []
  [H2_pressure_enclosure5]
    initial_condition = '${pressure_initial_enclosure2_H2}'
  []
  [HD_pressure_enclosure5]
    initial_condition = '${pressure_enclosure4}'
  []

  [D2_partial_pressure_upstream]
    initial_condition = '${fparse pressure_initial_enclosure2 + pressure_initial_enclosure2/2}'
  []
  [D2_partial_pressure_downstream]
    initial_condition = '${fparse pressure_initial_enclosure3 + pressure_initial_enclosure3/2}'
  []
  [H2_partial_pressure_upstream]
    initial_condition = '${fparse pressure_initial_enclosure2_H2 + pressure_initial_enclosure2/2}'
  []
  [H2_partial_pressure_downstream]
    initial_condition = '${fparse pressure_initial_enclosure3 + pressure_initial_enclosure3/2}'
  []

  [sqrt_PH2_sqrt_PD2_upstream]
  []
  [sqrt_PH2_sqrt_PD2_downstream]
  []

  [HD_pressure_upstream_reference]
  []
  [HD_pressure_downstream_reference]
  []
[]

[AuxKernels]
  [D2_pressure_enclosure5_kernel]
    type = FunctionAux
    variable = D2_pressure_enclosure5
    function = D2_pressure_enclosure5_function
  []
  [H2_pressure_enclosure5_kernel]
    type = FunctionAux
    variable = H2_pressure_enclosure5
    function = H2_pressure_enclosure5_function
  []

  [sqrt_PH2_sqrt_PD2_upstream_kernel]
    type = ParsedAux
    variable = sqrt_PH2_sqrt_PD2_upstream
    coupled_variables = 'D2_pressure_upstream H2_pressure_upstream'
    expression = 'sqrt(D2_pressure_upstream) * sqrt(H2_pressure_upstream)'
  []
  [sqrt_PH2_sqrt_PD2_downstream_kernel]
    type = ParsedAux
    variable = sqrt_PH2_sqrt_PD2_downstream
    coupled_variables = 'D2_pressure_downstream H2_pressure_downstream'
    expression = 'sqrt(D2_pressure_downstream) * sqrt(H2_pressure_downstream)'
  []

  [D2_partial_pressure_upstream_kernel]
    type = ParsedAux
    variable = D2_partial_pressure_upstream
    coupled_variables = 'D2_pressure_upstream HD_pressure_upstream'
    expression = 'D2_pressure_upstream + HD_pressure_upstream / 2'
  []
  [D2_partial_pressure_downstream_kernel]
    type = ParsedAux
    variable = D2_partial_pressure_downstream
    coupled_variables = 'D2_pressure_downstream HD_pressure_downstream'
    expression = 'D2_pressure_downstream + HD_pressure_downstream / 2'
  []
  [H2_partial_pressure_upstream_kernel]
    type = ParsedAux
    variable = H2_partial_pressure_upstream
    coupled_variables = 'H2_pressure_upstream HD_pressure_upstream'
    expression = 'H2_pressure_upstream + HD_pressure_upstream / 2'
  []
  [H2_partial_pressure_downstream_kernel]
    type = ParsedAux
    variable = H2_partial_pressure_downstream
    coupled_variables = 'H2_pressure_downstream HD_pressure_downstream'
    expression = 'H2_pressure_downstream + HD_pressure_downstream / 2'
  []

  [HD_pressure_upstream_reference_kernel]
    type = ParsedAux
    variable = HD_pressure_upstream_reference
    coupled_variables = 'D2_pressure_upstream H2_pressure_upstream'
    expression = '2 * sqrt(D2_pressure_upstream) * sqrt(H2_pressure_upstream)'
  []
  [HD_pressure_downstream_reference_kernel]
    type = ParsedAux
    variable = HD_pressure_downstream_reference
    coupled_variables = 'D2_pressure_downstream H2_pressure_downstream'
    expression = '2 * sqrt(D2_pressure_downstream) * sqrt(H2_pressure_downstream)'
  []
[]

[Functions]
  [D2_pressure_enclosure5_function]
    type = ParsedFunction
    expression = 'if(t < 150, 1.8421e-4,
                  if(t < 250, 1e-3,
                  if(t < 350, 3e-3,
                  if(t < 450, 0.009,
                  if(t < 550, 0.027,
                  if(t < 650, 0.081,
                  if(t < 750, 0.243,
                  if(t < ${simulation_time}, 0.729, 0.729))))))))'
  []
  [H2_pressure_enclosure5_function]
    type = ParsedFunction
    expression = '${pressure_initial_enclosure2_H2}' # Pa
  []
[]

[Kernels]
  # Gas flow kernels
  # Equation for D2 in enclosure upstream in val-2e_base.i
  # Equation for H2 in enclosure upstream
  [timeDerivative_upstream_H2]
    type = ADTimeDerivative
    variable = H2_pressure_upstream
    extra_vector_tags = 'ref'
  []
  [MatReaction_upstream_H2_influx_5]
    type = ADMatReaction
    variable = H2_pressure_upstream
    v = 'H2_pressure_enclosure5'
    reaction_rate = ${flow_rate_by_V}
    extra_vector_tags = 'ref'
  []
  [MatReaction_upstream_H2_influx_1]
    type = ADMatReaction
    variable = H2_pressure_upstream
    v = 'H2_pressure_enclosure1'
    reaction_rate = ${flow_rate_by_V}
    extra_vector_tags = 'ref'
  []
  [MatReaction_upstream_H2_outflux_4]
    type = ADMatReaction
    variable = H2_pressure_upstream
    v = 'H2_pressure_upstream'
    reaction_rate = -${flow_rate_by_V}
    extra_vector_tags = 'ref'
  []
  # Equation for HD in enclosure upstream
  [timeDerivative_upstream_HD]
    type = ADTimeDerivative
    variable = HD_pressure_upstream
    extra_vector_tags = 'ref'
  []
  [MatReaction_upstream_HD_influx_5]
    type = ADMatReaction
    variable = HD_pressure_upstream
    v = 'HD_pressure_enclosure5'
    reaction_rate = ${flow_rate_by_V}
    extra_vector_tags = 'ref'
  []
  [MatReaction_upstream_HD_influx_1]
    type = ADMatReaction
    variable = HD_pressure_upstream
    v = 'HD_pressure_enclosure1'
    reaction_rate = ${flow_rate_by_V}
    extra_vector_tags = 'ref'
  []
  [MatReaction_upstream_HD_outflux_4]
    type = ADMatReaction
    variable = HD_pressure_upstream
    v = 'HD_pressure_upstream'
    reaction_rate = -${flow_rate_by_V}
    extra_vector_tags = 'ref'
  []

  # Equation for D2 enclosure downstream in val-2e_base.i
  # Equation for H2 enclosure downstream
  [timeDerivative_downstream_H2]
    type = ADTimeDerivative
    variable = H2_pressure_downstream
    extra_vector_tags = 'ref'
  []
  [MatReaction_downstream_H2_influx_1]
    type = ADMatReaction
    variable = H2_pressure_downstream
    v = 'H2_pressure_enclosure1'
    reaction_rate = ${flow_rate_by_V}
    extra_vector_tags = 'ref'
  []
  [MatReaction_downstream_H2_outflux_4]
    type = ADMatReaction
    variable = H2_pressure_downstream
    v = 'H2_pressure_downstream'
    reaction_rate = -${flow_rate_by_V}
    extra_vector_tags = 'ref'
  []
  # Equation for HD enclosure downstream
  [timeDerivative_downstream_HD]
    type = ADTimeDerivative
    variable = HD_pressure_downstream
    extra_vector_tags = 'ref'
  []
  [MatReaction_downstream_HD_influx_1]
    type = ADMatReaction
    variable = HD_pressure_downstream
    v = 'HD_pressure_enclosure1'
    reaction_rate = ${flow_rate_by_V}
    extra_vector_tags = 'ref'
  []
  [MatReaction_downstream_HD_outflux_4]
    type = ADMatReaction
    variable = HD_pressure_downstream
    v = 'HD_pressure_downstream'
    reaction_rate = -${flow_rate_by_V}
    extra_vector_tags = 'ref'
  []

  # Diffusion kernels
  [timeDerivative_diffusion_H]
    type = ADTimeDerivative
    variable = H_concentration
    extra_vector_tags = 'ref'
  []
  [MatDiffusion_diffusion_H]
    type = ADMatDiffusion
    variable = H_concentration
    diffusivity = diffusivity_H
    extra_vector_tags = 'ref'
  []
[]

[Materials]
  [diffusivity_H]
    type = ADParsedMaterial
    property_name = 'diffusivity_H'
    expression = '${diffusivity_pre_H} * exp( - ${diffusivity_energy_H} / ${R} / ${temperature})'
  []
  [converter_to_regular]
    type = MaterialADConverter
    ad_props_in = 'diffusivity_D diffusivity_H'
    reg_props_out = 'diffusivity_D_nonAD diffusivity_H_nonAD'
    outputs = none
  []
[]

[Postprocessors]
  # Pressure
  [pressure_upstream_H2]
    type = SideAverageValue
    variable = H2_pressure_upstream
    boundary = right
  []
  [pressure_downstream_H2]
    type = SideAverageValue
    variable = H2_pressure_downstream
    boundary = left
  []
  [pressure_upstream_HD]
    type = SideAverageValue
    variable = HD_pressure_upstream
    boundary = right
  []
  [pressure_upstream_HD_reference]
    type = SideAverageValue
    variable = HD_pressure_upstream_reference
    boundary = right
  []
  [pressure_downstream_HD]
    type = SideAverageValue
    variable = HD_pressure_downstream
    boundary = left
  []
  [pressure_downstream_HD_reference]
    type = SideAverageValue
    variable = HD_pressure_downstream_reference
    boundary = left
  []
  # Flux
  [flux_surface_right_H]
    type = SideDiffusiveFluxIntegral
    variable = H_concentration
    diffusivity = diffusivity_H_nonAD
    boundary = 'right'
    execute_on = 'initial timestep_end'
    outputs = 'console csv exodus'
  []
  [flux_surface_left_H]
    type = SideDiffusiveFluxIntegral
    variable = H_concentration
    diffusivity = diffusivity_H_nonAD
    boundary = 'left'
    execute_on = 'initial timestep_end'
    outputs = 'console csv exodus'
  []
[]
(test/tests/val-2e/val-2ea.i)
# Validation Problem #2ea from TMAP7's V&V document
# Deuterium permeation through 0.05-mm Pd at 825 K.
# No Soret effect, or trapping included.

# Necessary physical and model parameters (kb, R, temperature)
!include parameters_deuterium_gas.params

# Enclosure data used in TMAP7 case
pressure_enclosure1 = '${units 1e-6 Pa}'
pressure_initial = '${units 1e-6 Pa}'

# Modeling data used in current case
slab_thickness = '${units 5e-5 m -> mum}'
file_name = 'val-2ea_out'
simulation_time = '${units 1900 s}'

!include val-2e_base.i

# Diffusion data used in TMAP7 case
solubility_exponent = 0.9297 # -
solubility_pre = '${units ${fparse 1.511e23 / 1e18} at/mum^3/Pa^0.9297}'
solubility_energy = '${units ${fparse 5918 * R} J/mol}'

[Variables]
  [D2_pressure_upstream]
    initial_condition = '${pressure_initial}'
  []
  [D2_pressure_downstream]
    initial_condition = '${pressure_initial}'
  []
  [D_concentration]
    initial_condition = 0
  []
[]

[AuxVariables]
  [D2_pressure_enclosure1]
    initial_condition = '${pressure_enclosure1}'
  []
  [D2_pressure_enclosure4]
    initial_condition = '${pressure_enclosure4}'
  []
  [D2_pressure_enclosure5]
  []
[]

[AuxKernels]
  [D2_pressure_enclosure5_kernel]
    type = FunctionAux
    variable = D2_pressure_enclosure5
    function = D2_pressure_enclosure5_function
  []
[]

[Functions]
  [D2_pressure_enclosure5_function]
    type = ParsedFunction
    expression = 'if(t < 150, 1.20e-4,
                  if(t < 250, 2.41e-4,
                  if(t < 350, 6.06e-4,
                  if(t < 450, 1.30e-3,
                  if(t < 550, 2.53e-3,
                  if(t < 650, 7.08e-3,
                  if(t < 750, 1.45e-2,
                  if(t < 850, 2.63e-2,
                  if(t < 950, 6.51e-2,
                  if(t < 1050, 0.116,
                  if(t < 1150, 0.297,
                  if(t < 1250, 0.760,
                  if(t < 1350, 1.550,
                  if(t < 1900, 3.370, 3.370))))))))))))))'
  []
[]

[Kernels]
  # Gas flow kernels
  # Equation for enclosure upstream
  [MatReaction_upstream_D2_outflux_membrane]
    type = ADMatBodyForce
    variable = D2_pressure_upstream
    material_property = 'membrane_reaction_rate_right'
    extra_vector_tags = 'ref'
  []
  # Equation for enclosure downstream
  [MatReaction_downstream_D2_influx_membrane]
    type = ADMatBodyForce
    variable = D2_pressure_downstream
    material_property = 'membrane_reaction_rate_left'
    extra_vector_tags = 'ref'
  []
[]

[Materials]
  [membrane_reaction_rate_right]
    type = ADParsedMaterial
    property_name = 'membrane_reaction_rate_right'
    postprocessor_names = flux_surface_right_D
    expression = 'flux_surface_right_D * ${surface_area} / ${volume_enclosure} * ${concentration_to_pressure_conversion_factor} / 2'
    outputs = 'exodus'
  []
  [membrane_reaction_rate_left]
    type = ADParsedMaterial
    property_name = 'membrane_reaction_rate_left'
    postprocessor_names = flux_surface_left_D
    expression = 'flux_surface_left_D * ${surface_area} / ${volume_enclosure} * ${concentration_to_pressure_conversion_factor} / 2'
    outputs = 'exodus'
  []
  [converter_to_regular]
    type = MaterialADConverter
    ad_props_in = 'diffusivity_D'
    reg_props_out = 'diffusivity_D_nonAD'
    outputs = none
  []
[]

[BCs]
  # The surface of the slab in contact with the source is assumed to be in equilibrium with the source enclosure
  [right_diffusion]
    type = EquilibriumBC
    variable = D_concentration
    enclosure_var = D2_pressure_upstream
    boundary = 'right'
    Ko = '${solubility_pre}'
    activation_energy = '${solubility_energy}'
    p = '${solubility_exponent}'
    temperature = ${temperature}
  []
  [left_diffusion]
    type = EquilibriumBC
    variable = D_concentration
    enclosure_var = D2_pressure_downstream
    boundary = 'left'
    Ko = '${solubility_pre}'
    activation_energy = '${solubility_energy}'
    p = '${solubility_exponent}'
    temperature = ${temperature}
  []
[]